STOP THE VIOLENCE IN LATIN AMERICA - A Look at Prevention from Cradle to Adulthood - Semantic Scholar
←
→
Page content transcription
If your browser does not render page correctly, please read the page content below

Latin American Development Forum

 STOP THE VIOLENCE
  IN LATIN AMERICA
      A Look at Prevention from
         Cradle to Adulthood

                            Laura Chioda

                                           OVERVIEW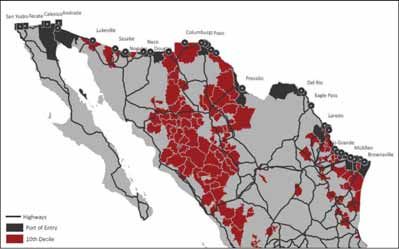
STOP THE VIOLENCE
 IN LATIN AMERICA
OVERVIEW

STOP THE
VIOLENCE IN
LATIN AMERICA
A Look at Prevention from Cradle to Adulthood

Laura Chioda
This booklet contains the overview of Stop the Violence in Latin America: A Look at Prevention from
Cradle to Adulthood, doi: 10.1596/978-1-4648-0664-3. The PDF of the final, full-length book,
once published, will be available at https://openknowledge.worldbank.org/ and print copies can be
ordered at http://Amazon.com. Please use the final version of the book for citation, reproduction, and
adaptation purposes.
© 2016 International Bank for Reconstruction and Development / The World Bank
1818 H Street NW, Washington, DC 20433
Telephone: 202-473-1000; Internet: www.worldbank.org
Some rights reserved
This work is a product of the staff of The World Bank with external contributions. The findings,
interpretations, and conclusions expressed in this work do not necessarily reflect the views of The World
Bank, its Board of Executive Directors, or the governments they represent. The World Bank does not
guarantee the accuracy of the data included in this work. The boundaries, colors, denominations, and other
information shown on any map in this work do not imply any judgment on the part of The World Bank
concerning the legal status of any territory or the endorsement or acceptance of such boundaries.
Nothing herein shall constitute or be considered to be a limitation upon or waiver of the privileges and
immunities of The World Bank, all of which are specifically reserved.
RIGHTS AND PERMISSIONS

This work is available under the Creative Commons Attribution 3.0 IGO license (CC BY 3.0 IGO) http://
creativecommons.org/licenses/by/3.0/igo. Under the Creative Commons Attribution license, you are free
to copy, distribute, transmit, and adapt this work, including for commercial purposes, under the following
conditions:
Attribution—Please cite the work as follows: Chioda, Laura. 2016. Stop the Violence in Latin America: A
Look at Prevention from Cradle to Adulthood. Overview booklet. World Bank, Washington, DC. License:
Creative Commons Attribution CC BY 3.0 IGO
Translations—If you create a translation of this work, please add the following disclaimer along with the
attribution: This translation was not created by The World Bank and should not be considered an official
World Bank translation. The World Bank shall not be liable for any content or error in this translation.
Adaptations—If you create an adaptation of this work, please add the following disclaimer along with the
attribution: This is an adaptation of an original work by The World Bank. Views and opinions expressed in the
adaptation are the sole responsibility of the author or authors of the adaptation and are not endorsed by The
World Bank.
Third-party content—The World Bank does not necessarily own each component of the content contained
within the work. The World Bank therefore does not warrant that the use of any third-party-owned individual
component or part contained in the work will not infringe on the rights of those third parties. The risk of
claims resulting from such infringement rests solely with you. If you wish to re-use a component of the work,
it is your responsibility to determine whether permission is needed for that re-use and to obtain permission
from the copyright owner. Examples of components can include, but are not limited to, tables, figures, or
images.
All queries on rights and licenses should be addressed to the Publishing and Knowledge Division, The
World Bank, 1818 H Street NW, Washington, DC 20433, USA; fax: 202-522-2625; e-mail: pubrights
@worldbank.org.
Cover art: © Jurandir Lima. Used with permission of Jurandir Lima. Further permission is required
for reuse.
Cover design: Bill Pragluski of Critical Stages.
Latin American Development Forum Series
This series was created in 2003 to promote debate, disseminate information and
analysis, and convey the excitement and complexity of the most topical issues
in economic and social development in Latin America and the Caribbean. It is
sponsored by the Inter-American Development Bank, the United Nations Economic
Commission for Latin America and the Caribbean, and the World Bank, and
represents the highest quality in each institution’s research and activity output. Titles
in the series have been selected for their relevance to the academic community, policy
makers, researchers, and interested readers, and have been subjected to rigorous
anonymous peer review prior to publication.

Advisory Committee Members
Alicia Bárcena Ibarra, Executive Secretary, Economic Commission for Latin
America and the Caribbean, United Nations
Inés Bustillo, Director, Washington Office, Economic Commission for Latin
America and the Caribbean, United Nations
Augusto de la Torre, Chief Economist, Latin America and the Caribbean Region,
World Bank
Daniel Lederman, Deputy Chief Economist, Latin America and the Caribbean
Region, World Bank
Santiago Levy, Vice President for Sectors and Knowledge, Inter-American
Development Bank
Roberto Rigobon, President, Latin American and Caribbean Economic Association
José Juan Ruiz, Chief Economist and Manager of the Research Department, Inter-
American Development Bank
Ernesto Talvi, Director, Brookings Global-CERES Economic and Social Policy in
Latin America Initiative
Andrés Velasco, Cieplan, Chile

                                                                                            v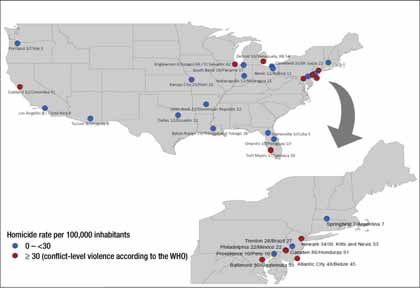
Titles in the Latin American
Development Forum Series
Work and Family: Latin American and Caribbean Women in Search of a New Balance
(2015) by Laura Chioda
Great Teachers: How to Raise Student Learning in Latin America and the Caribbean
(2014) by Barbara Bruns and Javier Luque
Entrepreneurship in Latin America: A Step Up the Social Ladder? (2013) by Eduardo
Lora and Francesca Castellani, editors
Emerging Issues in Financial Development: Lessons from Latin America (2013) by
Tatiana Didier and Sergio L. Schmukler, editors
New Century, Old Disparities: Gaps in Ethnic and Gender Earnings in Latin
America and the Caribbean (2012) by Hugo Ñopo
Does What You Export Matter? In Search of Empirical Guidance for Industrial
Policies (2012) by Daniel Lederman and William F. Maloney
From Right to Reality: Incentives, Labor Markets, and the Challenge of Achieving
Universal Social Protection in Latin America and the Caribbean (2012) by Helena
Ribe, David Robalino, and Ian Walker
Breeding Latin American Tigers: Operational Principles for Rehabilitating Industrial
Policies (2011) by Robert Devlin and Graciela Moguillansky
New Policies for Mandatory Defined Contribution Pensions: Industrial Organization
Models and Investment Products (2010) by Gregorio Impavido, Esperanza
Lasagabaster, and Manuel García-Huitrón
The Quality of Life in Latin American Cities: Markets and Perception (2010) by Eduardo
Lora, Andrew Powell, Bernard M. S. van Praag, and Pablo Sanguinetti, editors
Discrimination in Latin America: An Economic Perspective (2010) by Hugo Ñopo,
Alberto Chong, and Andrea Moro, editors
The Promise of Early Childhood Development in Latin America and the Caribbean
(2010) by Emiliana Vegas and Lucrecia Santibáñez
Job Creation in Latin America and the Caribbean: Trends and Policy Challenges
(2009) by Carmen Pagés, Gaëlle Pierre, and Stefano Scarpetta

                                                                                         vii
China’s and India’s Challenge to Latin America: Opportunity or Threat? (2009) by
Daniel Lederman, Marcelo Olarreaga, and Guillermo E. Perry, editors
Does the Investment Climate Matter? Microeconomic Foundations of Growth in Latin
America (2009) by Pablo Fajnzylber, José Luis Guasch, and J. Humberto López, editors
Measuring Inequality of Opportunities in Latin America and the Caribbean (2009)
by Ricardo de Paes Barros, Francisco H. G. Ferreira, José R. Molinas Vega, and Jaime
Saavedra Chanduvi
The Impact of Private Sector Participation in Infrastructure: Lights, Shadows, and
the Road Ahead (2008) by Luis Andres, Jose Luis Guasch, Thomas Haven, and
Vivien Foster
Remittances and Development: Lessons from Latin America (2008) by Pablo
Fajnzylber and J. Humberto López, editors
Fiscal Policy, Stabilization, and Growth: Prudence or Abstinence? (2007) by
Guillermo Perry, Luis Servén, and Rodrigo Suescún, editors
Raising Student Learning in Latin America: Challenges for the 21st Century (2007)
by Emiliana Vegas and Jenny Petrow
Investor Protection and Corporate Governance: Firm-level Evidence Across Latin
America (2007) by Alberto Chong and Florencio López-de-Silanes, editors
Natural Resources: Neither Curse nor Destiny (2007) by Daniel Lederman and
William F. Maloney, editors
The State of State Reform in Latin America (2006) by Eduardo Lora, editor
Emerging Capital Markets and Globalization: The Latin American Experience
(2006) by Augusto de la Torre and Sergio L. Schmukler
Beyond Survival: Protecting Households from Health Shocks in Latin America (2006)
by Cristian C. Baeza and Truman G. Packard
Beyond Reforms: Structural Dynamics and Macroeconomic Vulnerability (2005) by
José Antonio Ocampo, editor
Privatization in Latin America: Myths and Reality (2005) by Alberto Chong and
Florencio López-de-Silanes, editors
Keeping the Promise of Social Security in Latin America (2004) by Indermit S. Gill,
Truman G. Packard, and Juan Yermo
Lessons from NAFTA: For Latin America and the Caribbean (2004) by Daniel
Lederman, William F. Maloney, and Luis Servén
The Limits of Stabilization: Infrastructure, Public Deficits, and Growth in Latin
America (2003) by William Easterly and Luis Servén, editors
Globalization and Development: A Latin American and Caribbean Perspective (2003)
by José Antonio Ocampo and Juan Martin, editors
Is Geography Destiny? Lessons from Latin America (2003) by John Luke Gallup,
Alejandro Gaviria, and Eduardo Lora
viii TITLES IN THE LATIN AMERICAN DEVELOPMENT FORUM SERIESContents
Foreword xi
Acknowledgments xiii
Abbreviations xv
Overview 1
Introduction 1
Stylized facts: The physiognomy of crime and violence in LAC 7
Never too early: Stopping the transmission of violence across generations 30
Adolescence and young adulthood: A critical age for policy intervention 34
The link between poverty and crime and violence 37
Does crime respond to features of labor market incentives? 40
The effect of neighborhood characteristics and social networks on
crime and violence 42
Deterrence: The role of incentives in the justice system 46
Final thoughts 50
Notes 52
References 56
Figures
O.1 The homicide rates in Latin America and the Caribbean 4
O.2 A model of the supply of criminal offenses, but also a model of crime and violence
prevention 6
O.3 LAC’s homicide rate relative to other regions in terms of GDP per capita, 2012 8
O.4 Evolution of poverty, the middle class, economic development, and violence in
Latin America, 1995–2012 8
O.5 Employment profiles of male perpetrators and the male general population,
Mexico, 2010 11
ixO.6 Victim reporting on where the last crime occurred, 2010 and 2014 17
O.7 LAC homicide age-crime profile, selected years 19
O.8 Trends in homicide rates in the United States and Mexico, by age and race 21
O.9 Age-crime incidence by income level for property and violent crimes, LAC 23
O.10 Marginal effects on victimization of income, education, age, neighborhood
safety, social capital, and trust in institutions, LAC 24
O.11 Marginal effects on victimization of the variable “police asked for bribes” 26
O.12 Trends in homicides, concerns about crime, and victimization, LAC, 1996–2013 27
Maps
O.1 World cartogram showing country size proportional to homicide rate 2
O.2 U.S. ports of entry, Mexican highways, and homicide rates for the most
violent municipalities in 2012 13
O.3 Homicides rates by municipality in Colombia, Guatemala, El Salvador, and Brazil 14
O.4 U.S. cities and LAC countries with comparable homicide rates circa 2012 30
x CONTENTSForeword
For a long time, the logic seemed unassailable: Crime and violence were histori-
cally thought of as symptoms of a country’s early stages of development that could
be “cured” with economic growth and reductions in poverty, unemployment, and
inequality. More recently, however, our understanding has changed. Studies now
show that economic progress does not necessarily bring better security to the streets.
Developments in Latin America and the Caribbean exemplify this point.
Between 2003 and 2011, average annual regional growth in Latin America and
the Caribbean, excluding the global crisis of 2009, reached nearly 5 percent. What’s
more, the growth rate among the bottom 40 percent of the population eclipsed that of
the same group in every other region of the world. During that same decade, the region
experienced unprecedented economic and social progress: extreme poverty was cut
by more than half, to 11.5 percent; income inequality dropped more than 7 percent
in the Gini index; and, for the first time in history, the region had more people in the
middle class than in poverty.
Despite all this progress, the region retained its undesirable distinction as the
world’s most violent region, with 23.9 homicides per 100,000 inhabitants. The rate
of homicide actually accelerated during the latter half of the decade. The problem
remains staggering and stubbornly persistent.
Every 15 minutes, at least four people are victims of homicide in Latin America
and the Caribbean. In 2013, of the top 50 most violent cities in the world, 42 were in
the region. And between 2005 and 2012, the annual growth rate of homicides was
more than three times higher than population growth. Not surprisingly, the number of
Latin Americans who mention crime as their top concern tripled during those years.
Violence makes people withdraw, hide behind closed doors, and avoid public spaces,
weakening interpersonal and social ties that bind us as a community.
Insecurity is the result of a combination of many factors, from drug trafficking and
organized crime, to weak judicial and law enforcement systems that promote impunity, to
a lack of opportunities and support for young people who live in deprived communities.
xiYouth bear a disproportionate share of the risk of committing and falling victim to
violence, with important repercussions for their life trajectories and society as a whole.
The complexity of the issue (and multiplicity of its causes) is one of its defining
characteristics and the main reason why there is no magic formula or a single policy
that will fix the violence in our region. We will not solve the problem by relying only on
greater police action or greater incarceration, or through more education or employ-
ment. We must do all this and do it in a deliberate way, based on reliable data and
proven approaches, while continuously striving to fill existing knowledge and data
gaps to improve policy design.
To that end, Stop the Violence in Latin America: A Look at Prevention from Cradle
to Adulthood is a significant contribution. This report takes a new and comprehen-
sive look at much of the evidence that now exists in preventing crime and violence.
It identifies novel approaches —both in Latin America and elsewhere—that have
been shown to reduce antisocial behavior at different stages in life. Effective preven-
tion starts even before birth, the report argues, and, contrary to common perceptions,
well-designed policies can also be successful later in life, even with at-risk individuals
and offenders. The report emphasizes the importance of a comprehensive approach
to tackle violence, and it highlights the benefits and cost-effectiveness of redesigning
existing policies through the lens of crime prevention. This will require substantial
coordination across ministries, as well as accountable and efficient institutions.
While economic and social development do not necessarily lead to a reduction
in crime and violence, high levels of crime and violence do take a toll on development.
And in that regard, we at the World Bank are fully aware that in order to succeed in our
goals to eradicate extreme poverty and boost prosperity, the unrivaled levels of crime
and violence in the region need to come to an end.
Jorge Familiar
Vice President
Latin America and the Caribbean Region
World Bank Group
xii FOREWORDAcknowledgments
This regional study is the product of a broader analytical effort by the World Bank’s
Latin America and the Caribbean Region that focuses on crime, violence, and security.
This study was developed and prepared by Laura Chioda, under the patient
direction and support of Augusto de la Torre. It builds on background papers by econ-
omists inside and outside the World Bank. We are very grateful for and acknowledge
contributions by Pedro Carneiro, Rafael Di Tella, David Evans, Sebastian Galiani,
Paul Gertler, Nancy Guerra, Sebastian Martinez, and Ernesto Schargrodsky.
The report has benefited from the encouragement and conversations with sev-
eral colleagues, many of whom are also members of the crime and violence team.
The author is indebted to Markus Kostner and Rodrigo Serrano-Berthet, who have
unwaveringly and enthusiastically supported this process, making work across the
Global Practices seamless. The author is particularly grateful to Wendy Cunningham
and Maninder Gill, whose guidance and expert insights shaped the stages of the
study.
The painstaking data collecting required almost a googol of long days and was
the cause of numerous headaches. The author is grateful for the countless hours that
Karen del Mar Ortiz Becerra, Carlos Castañeda, Joaquin Urrego Garcia, Elisa Jacome,
Camila Galindo Pardo, and Juan Pablo Uribe dedicated to this report and for their
research assistance. A very special thanks goes to Luis Diego Rojas Alvarado, Joaquin
Urrego Garcia, and Tanya Maureen Taveras, who provided cheerful, outstanding,
and tireless research assistance. In particular, the report would not have been possible
without Diego’s commitment and Joaquin’s help.
The author would also like to thank the peer reviewers, Aline Coudouel,
Alexandre Marc, and Andy Morrison, for their early feedback on the Concept Note
and for their patience and willingness to review early drafts. Margaret Grosh and Bill
Maloney also provided insightful and thoughtful comments. Makhtar Diop’s encour-
agement to pursue this line of research and his constant support for the report are
gratefully acknowledged.
xiiiThe study also benefited from insightful comments from Valentina Calderon,
Óscar Calvo-González, Adriana Camacho, Flavia Carbonari, Tito Cordella, Rafael de
Hoyos, Tatiana Didier, David Evans, Ben Feigenberg, Francisco Ferreira, Paul Gertler,
Marcus Holmlund, Ana Maria Ibanez, Felipe Jaramillo, Florence Kondylis, Daniel
Lederman, Arianna Legovini , Reema Nayar, Marcela Sanchez- Bender, Sameh Wahba,
and several others to whom we apologize for omitting. Members of the AL CAPONE
Network (America Latina Crime and Policy Network) have been an invaluable source
of knowledge, wit, and encouragement: Joao Manoel de Mello and Rodrigo Soares
deserve special thanks.
Nancy Morrison provided superb editorial services and invaluable comments
during the drafting of the overview. We would like to thank Pat Katayama and Susan
Graham for their generous help and patience during the production process. Finally,
the author would like to acknowledge the generous financial support from the gov-
ernment of Spain, under the Spanish Fund for Latin America and the Caribbean
(SFLAC) Trust Fund.
xiv ACKNOWLEDGMENTSAbbreviations
ADHD attention deficit hyperactivity disorder
CCT conditional cash transfer
ECD early childhood development
EM electronic monitoring
IQ intelligence quotient
LAC Latin America and the Caribbean
LAPOP Latin America Public Opinion Project
MTO moving to opportunity
POP problem-oriented policing
PTSD post-traumatic stress disorder
SES socioeconomic status
WHO World Health Organization
xvOverview
Introduction
Crime and violence in the Latin America and Caribbean (LAC) region is pervasive
and costly—particularly violent crime. LAC has the undesirable distinction of being
the world’s most violent region, with 23.9 homicides per 100,000 inhabitants in
2012, compared to 9.7, 4.4, 2.7, and 2.9 for Africa, North America, Asia, and Europe,
respectively.
The magnitude of the problem is staggering and stubbornly persistent. LAC
accounts for only 8 percent of the world’s population, but for 37 percent of the world’s
homicides (map O.1 illustrates the point dramatically by presenting a world map where
country sizes are proportional to their homicide rates). Eight out of the 10 most violent
countries in the world are in LAC. In 2013, of the top 50 most violent cities in the
world, 42 were in the region, including the top 16. The annual growth rate of homicides
(3.7 percent) dramatically outstripped population growth (1.15 percent) from 2005 to
2012. In 2012 alone, 145,759 people in LAC fell victim to homicide, corresponding to
400.44 homicides committed per day and 4.17 homicides every 15 minutes.
Eight countries exceed the level of violence defined by the World Health
Organization (WHO) as “conflict” (30 homicides per 100,000), with Honduras and
República Bolivariana de Venezuela experiencing the staggering rates of 90 and 54,
respectively. These figures are well above the rate of any country in Africa, some of
which were engaged in civil wars. In 2012, only Lesotho and Swaziland recorded
homicide rates above the conflict threshold (38.0 and 33.8 homicides per 100,000
respectively). Unfortunately, the “endemic” level of violence, defined by WHO as
10 homicides per 100,000, appears to be the norm in the LAC region, with only ten
countries below the threshold.1, 2
This is not a recent phenomenon for the region, which has experienced high and
persistent levels of violence for several decades (see figure O.1). Over the last 15 years,
the homicide rate has hovered stubbornly around 24 homicides per 100,000. The
trend started to decline slightly in the first half of the 2000s, but with the deteriorating
situation in Central America, any gain has been reversed.
The region’s history of elevated homicide rates and the latest uptick in violence
are in stark contrast with the most recent decade of significant social progress. Between
2003 and 2011, Latin America and the Caribbean as a whole has made important
1MAP O.1: World cartogram showing country size proportional to
homicide rate
a. Homicide rates, circa 2000
Homicide rate (per 100,000
inhabitants)
[0–1.5]
(1.5–3.5]
(3.5–7.5]
(7.5–10)
[10–30)
[30–35)
> 35 Note: 10 per 100,000 inhabitants is the WHO threshold for endemic violence;
No data 30 per 100,000 inhabitants is the WHO threshold for conflict-level violence.
b. Homicide rates, circa 2012
Homicide rate (per 100,000
inhabitants)
[0–1.5]
(1.5–3.5]
(3.5–7.5]
(7.5–10)
[10–30)
[30–35)
> 35 Note: 10 per 100,000 inhabitants is the WHO threshold for endemic violence;
No data 30 per 100,000 inhabitants is the WHO threshold for conflict-level violence.
Source: World Bank calculations, based on data from UNODC and WHO.
2 STOP THE VIOLENCE IN LATIN AMERICAstrides toward broader social equity, as reflected by sizable reductions in poverty
(from 45 percent to 25 percent) and income inequality, and rising shares of people in
the middle class. This contrast—rising violence versus major improvements in social
equity—highlights the complexity of the relationship between economic development
and crime and violence.
The focus of this study is the prevention of crime and violence. In particular, this
study seeks to identify novel policies whose impacts have been validated by rigor-
ous empirical evidence. It considers a broad range of policy interventions—both in
LAC and elsewhere—that have been shown to reduce antisocial behavior early in
life or patterns of criminal offending in youth and adulthood, whether by design
or by indirect effect. Further, it highlights the mechanisms underlying the success
of such interventions. The study also aims to shed light on the complex landscape
of violence in the region by combining several data sources, utilizing econometric
techniques, and highlighting a number of background studies that were produced
for the report, are centered on the region, and credibly identify causal links between
policy and reductions in or prevention of crime and violence. An exhaustive review
of all existing literature on crime (criminological, psychological, and economic)
would be an overwhelming task and is beyond the scope of this document. Instead,
attention is devoted to a selection of recent and innovative studies for which cred-
ible evidence exists regarding the links between the interventions in question and
outcomes. The emphasis on causality is rooted in policy concerns—policies are best
designed where the underlying causal processes are better understood. The delicate
nature of the crime and violence problem, the high stakes, and the potential risks
from unintended consequences of well-intentioned policies call for this evidence-
based approach.
This study does not address organized crime explicitly, but policies highlighted here
remain relevant. By design, this study does not delve into causes and dynamics of
organized crime in the region (largely drug-related), nor does it explicitly broach the
roles of national institutions and international cooperation in determining the level of
organized crime and violence. A thoughtful treatment of these topics is beyond the
scope of this study. The data requirements and the methodological approach that
would be necessary for this exercise would differ greatly—and would, in all likelihood,
entail the adoption of an industrial organization perspective in the analysis of drug
markets and of interactions among cartels.
Nevertheless, certain aspects of violence, described in this study, overlap with
organized crime. In particular, when presenting data on the evolution of violence over
time, this study does not attempt to distinguish between interpersonal violence that is
unrelated to organized crime and that which is driven by it.3 The rationale is twofold.
First, pursuing that distinction empirically is nearly impossible given that definitions,
methodologies, and data collection systems of drug-related statistics vary enormously
across countries, and data are reported too sporadically to create meaningful long-term
regional comparisons. Second, conceptually, there are no universally accepted—or
OVERVIEW 3FIGURE O.1: The homicide rates in Latin America and the Caribbeana
a. Homicide rate, 2012: Lower than 10 (per 100,000 inhabitants)
50
Homicide rate
40
30
20
10
0
02
03
04
06
08
09
10
11
12
01
05
95
96
97
98
99
00
07
20
20
20
20
20
20
20
20
20
19
19
20
20
20
19
19
19
20
Chile Argentina Barbados Uruguay
Costa Rica Suriname Peru Paraguay
b. Homicide rate, 2012: Between 10 and 20 (per 100,000 inhabitants)
50
Homicide rate
40
30
20
10
0
10
95
96
97
98
99
00
01
02
03
04
05
06
07
08
09
11
12
20
19
19
19
19
20
19
20
20
20
20
20
20
20
20
20
20
20
Haiti Nicaragua Bolivia Ecuador
Grenada Antigua and Barbuda Panama
c. Homicide rate, 2012: Between 20 and 30 (per 100,000 inhabitants)
50
Homicide rate
40
30
20
10
0
95
96
97
98
99
00
01
02
03
04
05
06
07
08
09
10
11
12
19
19
19
19
19
20
20
20
20
20
20
20
20
20
20
20
20
20
Dominican Republic Trinidad and Tobago Brazil
Bahamas, The St. Lucia Mexico
d. Homicide rate, 2012: Greater than 30 (per 100,000 inhabitants)
150
130
Homicide rate
110
90
70
50
30
10
0
5
6
7
98
99
00
01
02
03
04
05
06
07
08
09
10
11
12
9
9
9
19
19
19
19
19
20
20
20
20
20
20
20
20
20
20
20
20
20
Colombia St. Kitts and Nevis Guatemala Jamaica
El Salvador Belize Venezuela, RB Honduras
Source: World Bank calculations, based on data from UNODC.
a. The thresholds of 10 and 30 homicides per 100,000 inhabitants correspond to the WHO-defined “endemic” and “conflict”
levels of violence, respectively.
4 STOP THE VIOLENCE IN LATIN AMERICAmutually exclusive—definitions of violence and organized crime. Hence, a unique map-
ping of crimes into the relevant data categorizations (for example, related or not related
to drug-driven organized crime) is extremely difficult and largely unattainable—even
abstracting from longstanding debates surrounding the separation of drug-related
crimes from other types.
Because the focus is on prevention, the study is only marginally affected by this
regrettable data limitation. Much of the evidence on policy interventions and mech-
anisms discussed in the study has applicability and relevance to many questions
surrounding organized crime. Whether in LAC or elsewhere, an intervention that is
proven to reduce violence (whether homicides, violent crimes, or property crimes)
in neighborhoods where interpersonal violence is intertwined with organized crime
(leading to gang affiliation and drug trafficking) will be deemed to have promising pre-
ventive effects, regardless of the underlying motives of violence. Notably, policies that
prevent youth violence are also frequently effective at reducing gang affiliation.4 Some
of the most promising gang violence prevention programs have been focused on train-
ing children, adolescents, and young adults in pro-social behavior and self-control.
Of course, the overlap is not always perfect.5
The organizing framework of this study. The study reviews and assesses the evi-
dence in the context of an organizing framework that encompasses features of three
different models of criminal and antisocial behavior, each with origins in different
disciplines:
1. Becker’s (1968) economic theory of the supply of criminal offenses
2. The ecological framework, whose origins lie in the medical literature
3. The developmental life course theories, building on Bronfenbrenner’s
(1979) theory of child development and on Loeber and others (1993) and
Farrington (2003), who formalize developmental and life cycle insights for
the criminological literature
The study’s organizing framework builds on the classical Beckerian model, which
posits that the number of crimes in any given period is a function of the probabil-
ity of apprehension and conviction; the severity of punishment; and a residual that
captures all other relevant considerations, such as risk aversion, family background,
peers, human capital characteristics (for example, education and heath), and wages
in the legal labor market (see figure O.2). The residual plays an important role—it is
a placeholder for a set of variables that are key determinants in the specific crime and
violence problem under consideration.
The ecological elements of the organizing framework are adapted from the medi-
cal literature. They organize risk factors (that is, factors that can encourage crime and
violence) and protective factors (that is, factors that dissuade or shield individuals
from crime and violence) according to the hierarchical levels at which they operate,
namely, individual, family, peer, community, or societal levels (WHO 2002).
OVERVIEW 5FIGURE O.2: A model of the supply of criminal offenses, but also a model of
crime and violence prevention
Neighborhood and
Youth economic factors
Childhood Networks,
Education, economic
Biological peers, opportunities,
endowments, school-to-work physical
parenting, transitions, self- environment,
education control justice system
Punishment
Severity Crime and
Probability violence
of
conviction
Certainty
However, the ecological model was originally developed as an organizing
descriptive tool and is, as such, static in nature; that is, it is not designed to cap-
ture the feedbacks between the various factors. As an individual matures and pro-
gresses through adolescence and young adulthood, peers, the quality of schools, and
neighborhood characteristics exert increasing influence on his or her behavior, such
that different sets of proximal risk and protective factors take greater prominence
(Bronfenbrenner 1979 and Plas 1992). In particular, criminal offending is a multifac-
eted phenomenon with roots in both biological and social causes. The developmental
life course theories speak to this complexity, as each stage of one’s life is associated
with an evolving array of risk factors, including biological endowments; smoking,
drug use, or stress during pregnancy; inconsistent and punitive parenting; antisocial
peers; poor schooling; disadvantaged or violent neighborhoods; and poor job oppor-
tunities. Each of these factors can be accommodated via different formulations for the
Beckerian residual.
Prevention can never start too early or too late, or be too comprehensive. The orga-
nizing framework thus adopts a life cycle perspective and argues that, as individu-
als progress through stages of their lives (from birth to old age), different sets of risk
factors arise, their prominence evolves, and interdependencies among them mutate.
These interactions and interdependencies, and the changes in the relative impor-
tance of different risk and protective factors, not only shape behavior but also help
identify relevant margins for policy action—that is, margins that can be targeted by
prevention policies at different stages of the life cycle.6 Indeed prevention can never
start too early, or start too late, or be too comprehensive. Effective prevention starts
even before birth and, contrary to common perceptions, well-designed policies can
also be successful later in life. At-risk individuals and offenders have been shown to
respond to incentives (including those set by labor markets and the criminal justice
system) even if their behavior is only boundedly rational (Cook and Ludwig 2011).
6 STOP THE VIOLENCE IN LATIN AMERICAFurthermore, better understanding of brain functions and development serves to
expand the menu of policy options available for prevention. The success or failure
of a violence prevention strategy rests on the ability to implement an integrated set of
policies that can exploit these interdependencies; in this way, the ultimate outcome in
terms of crime reduction may be larger than the sum of the individual policy outcomes.
The overview is structured as follows. The first part of this overview systematically
describes a set of key stylized facts that characterize the landscape of crime and vio-
lence in the region. These facts are grouped into four broad categories: (a) the nexus
between crime and economic development; (b) the geography of crime; (c) the distri-
bution of crime among individuals and over the life cycle; and (d) the determinants of
victimization, concerns about crime, and well-being. The second part of the overview
focuses on the scope for prevention at different stages of the life cycle (prenatal, early
childhood, and youth) and in different contexts (family, school, neighborhoods, labor
markets, and criminal sanctions). The discussion in the second part of the overview
follows the organizing conceptual framework described above.
Stylized facts: The physiognomy of crime and violence in LAC
Crime and violence and economic development
At first glance, the indicators on the extent of crime and violence seem to suggest that
Latin America and the Caribbean represents an outlier, with an extraordinary level of
violence relative to other regions with comparable levels of economic development, as
proxied by GDP per capita (see figure O.3). However, recent research calls into ques-
tion whether the level of crime and violence in the region has been truly exceptional.
During the 1990s, the incidence of crime in the region was found not to be so differ-
ent from what should be expected given the socioeconomic and policy characteristics
of its constituent countries (Soares and Naritomi 2010; Fajnzylber, Lederman, and
Loayza 2002a).
This conclusion makes the more recent trends all the more puzzling. The “good”
decade of the 2000s witnessed important reductions in poverty (more than 80 million
Latin Americans rose above the moderate poverty line between 2003 and 20127)
and in income inequality (at least 14 countries in the region experienced a significant
decline in their Gini coefficient), and a simultaneous rise in the share of people in
the middle classes (from 20 percent in 2003 to 34 percent in 2012, as measured by
the proportion of people making more than US$10 a day on a purchasing power–
adjusted basis) (see figure O.4). Yet levels of violence have risen or remained constant
in all LAC countries except Argentina, Brazil, Colombia, and Paraguay. The experi-
ence of the 2000s—particularly the second half of the decade, when violence appeared
to accelerate—suggests that there is no one-to-one mapping between (a) crime and
violence and (b) standard indicators of social and economic development and that,
instead, the links, if any, are subject to a high degree of complexity.
OVERVIEW 7FIGURE O.3: LAC’s homicide rate relative to other regions in terms of GDP per
capita, 2012
Intentional homicide rate (per 100,000 inhabitants)
35
30 Latin America and the Caribbean
23.9
25
20
Africa
15 9.7 Asia
10 2.7 North America
Europe
4.4
5 2.9
Oceania
0
1.3
–5
5.5 6.5 7.5 8.5 9.5 10.5 11.5
Log (GDP per capita)
Source: World Bank calculations, based on data from UNODC (2012).
Note: The size of the spheres is proportional to population.
FIGURE O.4: Evolution of poverty, the middle class, economic development,
and violence in Latin America, 1995–2012
40
15,000 GDP per capita (PPP constant 2011 international $)
Homicide rate (per 100,000 inhabitants)
14,000
35 13,000
12,000
Headcount (%) and
30
11,000
25 10,000
23.6
25.0
22.9
24.1 20.4 23.95 9,000
22.8
20 20.7 20.1
21.6
8,000
7,000
15
6,000
10 5,000
96
98
99
00
01
02
03
06
08
09
10
11
12
95
04
05
97
07
19
19
19
20
20
20
20
20
20
20
20
20
20
19
20
20
19
20
Share of middle class ($10–$50 per day) Share of extreme poverty
Homicide rate (per 100,000 inhabitants) GDP per capita PPP (right axis)
Source: Author’s calculations. Homicide rates are calculated with data from UNODC, OAS, and official statistics from various
countries. Data for poverty and the middle class are from Ferreira et al. (2013) and LAC Equity Lab (2015).
Note: PPP = purchasing power parity.
8 STOP THE VIOLENCE IN LATIN AMERICAThe relationship between crime and development is highly nonlinear: crime can
increase as income rises.8 Indeed, the cross-country relationship between homicides
and GDP per capita is well approximated by an inverted U shape; homicide rates first
increase as per capita income rises and then decline at high levels of per capita income.
Empirically, low levels of violence are observed at both low and high levels of economic
development. As countries grow from low levels of income, both the opportunities for
crime and the returns to criminality increase. At least initially, the probability of crime
detection and sanctions declines—as investments in institutions of criminal justice typ-
ically lag behind income—lowering the expected costs of criminality (“crime pays”).
However, as income continues to grow, the opportunity cost of crime also
increases in the form of forgone wages in the legal sector in the event of being appre-
hended; thus crime declines, as reflected in the downward portion of the curve. It
is also possible that, as the level of crime rises, both citizens and the private sector
increase their demands for public goods—including security and safety—forcing insti-
tutions to devote more resources to controlling crime and thus raising the probability
of crime detection and sanctions (being caught and being sentenced to prison). These
processes are analogous to Maslow’s (1943) “hierarchy of needs,” whereby there is a
sequence of individual needs and priorities, starting with basic physiological necessi-
ties such as food and shelter and moving up to needs for safety. As countries progress
through different stages of development, new challenges and needs arise and become
more pressing. In this context, as countries become wealthier and their basic physi-
ological needs for survival are met, their concerns and efforts turn to personal safety
and a more peaceful society.
Economic development per se does not seem sufficient to curb violence: development
must occur at a fast enough pace and be inclusive. A closer look at the role of poverty,
of vulnerability (defined as per capita daily income between $4 and $10 per day),
and of the middle class (defined as per capita daily income between $10 and $50 per
day) delivers more insight into the relationships between income and violence. In the
case of LAC, there is a noteworthy break in the early 2000s for certain economic vari-
ables as they relate to homicide rates. Before 2003, there is no systematic and statisti-
cally significant relation between the size of either the vulnerable class or the upper
class (defined as per capita income above $50 per day) and changes in homicide rates.
After 2003, the size of the vulnerable class emerges as a risk factor (it rises as the rate
of homicides increases), while the size of the upper class emerges as a protective factor
(it is associated with a lower homicide rate). In turn, throughout the 15-year period
(1996 to 2010), the size of the middle class and the level of poverty are not statistically
significant determinants of observed trends in violence. Hence, in the case of LAC,
economic development per se does not seem sufficient to halt violence: it must occur
at a fast enough pace. Indeed, the data reveal a precise and robust protective effect of
real GDP growth on homicide rates: a 1 percentage point increase in the growth rate of
GDP is related to roughly 0.24 fewer homicides per 100,000 (all else equal including
income per capita). Growth acts as a protective factor and can help “outstrip” the need
OVERVIEW 9for crime. In order for these gains to be sustainable, however, the strength and cred-
ibility of institutions (the confidence in the democratic and judicial systems and in law
enforcement) also must improve in lockstep with economic development.
The relationship between crime and development is further complicated when
alternative measures of development (such as unemployment, demographic structure,
or inequality) are considered. Each exerts possibly competing forces on criminality.
The relationship between crime and inequality is confounded by poverty. If inequal-
ity matters for crime, it matters at the local level. The relationship between crime
and the distribution of income has drawn a good deal of scrutiny. Some researchers
have estimated significant effects of the Gini coefficient on homicides (Kelly 2000;
Fajnzylber, Lederman, and Loayza 2002a, 2002b). More recent studies have found
little evidence of a relationship (Brush 2007; Pridemore 2011). The findings in this
study—which are based on Latin America data—are consistent with the latter group,
with the Gini coefficient appearing not to predict changes in homicides.
How can these two sets of results be reconciled? While differences across
countries in the level of the homicide rate are captured by differences in income and
income inequality, changes within a particular country over time are poorly predicted
by these variables (Brush 2007). Furthermore, a growing body of evidence suggests
that the relationship between crime and inequality is confounded by poverty (that is,
it vanishes after controlling for poverty), which is the one most consistent predictor
of homicide rates in the United States (Pridemore 2011). Qualitatively similar results
regarding poverty emerge also for LAC. In particular, proxy measures of extreme
poverty, such as the teen pregnancy rate, indicate positive and precisely estimated
effects of poverty on national homicide rates: an increase in the contemporaneous
teen pregnancy rate is associated with approximately 0.5–0.6 additional homicides
per 100,000 (Chioda 2014a).
As discussed in greater detail below, crime is very local in nature. It is therefore not
surprising that the degree of inequality measured at the national level is at best a weak
predictor of its behavior. What appears to matter is the level of inequality experienced
by the individual. Recent research that considers the impact of neighborhood charac-
teristics on behavior suggests that poor boys living in largely well-to-do neighborhoods
are the most likely to engage in antisocial behavior (lying, misdemeanors, property
crimes, and other problem behaviors), compared to their counterparts in poor areas.
Not all unemployment is created equal: age and quality of employment opportu-
nities matter. Economic development is also associated with improvements in labor
market conditions: more and better employment opportunities and possibly higher
wages. Whether unemployment and crime are related remains an open question, both
theoretically and empirically (Bushway 2011).9 In a panel of LAC countries, the aggre-
gate (lagged) unemployment rate is not related to violence measure (Chioda 2014a).
However, when youth and adult unemployment are treated separately, a stable pattern
emerges: whereas adult unemployment is unrelated to crime, youth unemployment is
consistently positively related to the homicide rate (a 1 percentage point increase in
10 STOP THE VIOLENCE IN LATIN AMERICAyouth unemployment leads to 0.34 additional homicides per 100,000). Not all forms
of unemployment are thus equal; youth unemployment is particularly nocive to citizen
security. Since youth are at particularly high risk of engaging in antisocial and criminal
behavior (see discussion below), the linkages between the labor market and criminal
participation may be particularly important for this group.
However, employment per se is not sufficient to deter criminality. Regardless of
the type of crime (homicides, robberies, violent or property crimes), perpetrators in
Mexico, for instance, are characterized by higher labor market attachment than the
general population (see figure O.5).10 Indeed, crime and work are not perfect sub-
stitutes, but instead “imperfect” complements:11 rather than a dichotomous choice,
for many individuals, economic activity appears to lie along a continuum of legal and
illegal “work.” Micro-level analyses from Brazil and Mexico indicate that the quality of
employment plays a central role in the relationship between labor markets and crimi-
nal offending, rather than employment status per se.
This is especially relevant for youth with low educational attainment (for exam-
ple, incomplete secondary schooling), who are likely to face (legal) employment pros-
pects that offer limited potential for wage growth, skill acquisition, and job stability,
and who may ultimately find employment in the informal sector.
Development has a dark side. What benefits the formal economy may also bene-
fit illegal markets. While this regional study does not focus on organized crime and
illicit drugs markets, it is difficult to avoid acknowledging the spillovers of develop-
ment into these markets, particularly given LAC’s status as a leading producer of
illicit drugs and its unique geographical proximity to one of the world’s largest
FIGURE O.5: Employment profiles of male perpetrators and the male general
population, Mexico, 2010
Employed males as a share of total male
19
population, ages 16 and older (%)
17
15
13
11
9
7
5
3
1
0
−1
+
18
20
9
4
9
4
9
9
4
9
4
9
4
4
4
85
−2
−3
−3
−4
−4
−5
−6
−6
−7
−7
−8
−2
−5
−
−
16
19
25
30
35
40
45
55
60
65
70
75
80
21
50
Age group
Population All crimes Population (age effect) All crimes (age effect)
Source: Chioda 2014c, based on data from INEGI.
OVERVIEW 11consumer markets (the United States). As countries transition through different
stages of economic development, increased tensions can result, with theoretically
ambiguous effects of income on violence and illicit opportunities. In particular, while
improvements in infrastructure, financial markets, transportation, and income may
help economic growth and foster the development of legal markets, they may also
increase the economic returns to transactions in illegal markets (lowering both trans-
action costs and the likelihood of detection by law enforcement12). For instance, in
LAC, exports—an indirect measure of a country’s openness—are positively related to
homicides: all else equal, a 1 percentage point increase in exports as a percent of GDP
is associated with an increase of 0.2 homicides per 100,000 (Chioda 2014a). One
interpretation of this relationship is that increased violence is one of the transitory
“costs” of development: Crime and violence are social ills that arise and evolve along
with the level of a society’s development. In particular, while improvements in infra-
structure, financial markets, and rising incomes may foster economic growth and the
development of legal markets, they can also increase the economic returns to partici-
pating in illegal markets by lowering transaction costs and the likelihood of detection.
That is, transaction costs may fall as a result of improved information technology or
as transportation costs decline from better roads and infrastructures; the likelihood of
detection may similarly decrease if the volume of economic activity from greater trade
is not matched by a proportional effort to monitor it.
Geographically, crime is concentrated, persistent, and contagious
More than 1,560,000 people in LAC fell victim to homicide during the 2000s
(UNODC 2013), though this likely represents an underestimate because official statis-
tics are not available for all countries and all years. To put this figure into perspective,
it is 2.5 times the population of Washington, DC, and close to half of the population of
Panama. Over this ten-year period, homicide victims in LAC far exceeded casualties
of the Iraq War (both civilian and military), which have been estimated in the range of
400,000 and 750,000.
Violence is very local in nature: highly heterogeneous across countries, states, and
municipalities. The aggregate levels of violence mask a great deal of heterogeneity.
As noted earlier, while LAC as a whole is the most violent region in the world, the variance
across countries within LAC is staggering. In 2010, and for most of the decade, Chile—
at 3.2 per 100,000—enjoyed a lower incidence of homicide than the United States
(4.8 per 100,000 in 2010, a historical low). Similarly, in 2008, Uruguay was on par with
North America and was only marginally higher in 2010. These optimistic figures are in
stark contrast with the gloomy picture painted by eight LAC countries whose levels of
violence exceed the WHO-defined “conflict” threshold of 30 per 100,000.
However, national figures can also paint a misleading picture. For instance,
Mexico’s homicide rates of 10.34 per 100,000 in 2000 and 21.85 per 100,000 in 2010
are the result of significant variability at the state and municipal level. Despite the recent
12 STOP THE VIOLENCE IN LATIN AMERICAdramatic deterioration in security in Mexico, several municipalities experienced declines
in violence and homicide (see map O.2). During the 2000s, the state of Chihuahua
had the third-highest state-level homicide rate in Mexico (with 19.2 per 100,000), but
security deteriorated dramatically, with homicides sky-rocketing to 187.6 in 2010.13,14
Within the state, over the course of one year, the homicide rate in the municipality of
Ciudad Juarez soared eightfold, from 14.1 per 100,000 in 2007 to 114.8 in 2008. It
increased to 263.2 in 2010, accounting for approximately 60 percent of homicides in
the state of Chihuahua and 15 percent of all murders in Mexico, respectively.
One of the distinguishing features of the crime and violence phenomenon is the
degree to which it is geographically concentrated, implying that a great deal of hetero-
geneity underlies aggregate figures, especially at the regional and national levels (see
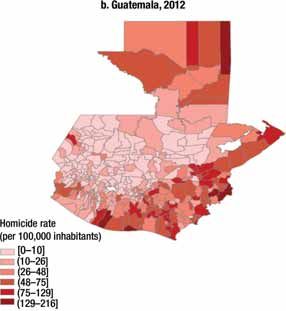
map O.3). Municipality- and state-level data consistently point to handfuls of locations
where the majority of homicides occur. For instance, six of Guatemala’s 22 depart-
ments account for 63.7 percent of its homicides; in 2007, the state of Chihuahua alone
accounted for one-quarter of the homicides in Mexico, 50 percent of which were
accounted for by two of its municipalities. In 2008, not only did violence increase
dramatically in Chihuahua, but so did its concentration: two municipalities accounted
for 76.8 percent of the state’s homicides.
The clustered nature of violence appears at even finer levels of geographical disag-
gregation, manifesting itself at the neighborhood and even the street levels. Is this feature
specific to Latin America and the Caribbean? Here again, the parallel with developed
MAP O.2: U.S. ports of entry, Mexican highways, and homicide rates for the
most violent municipalities in 2012
Source: World Bank calculations, based on data from INEGI.
Note: The 10th decile = the ten percent most violent municipalities.
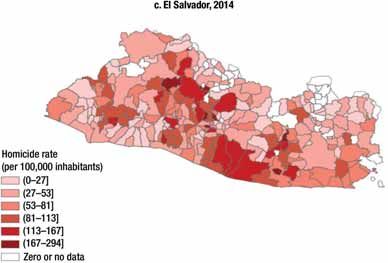
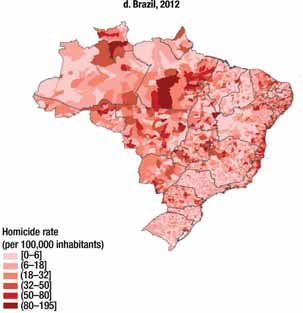
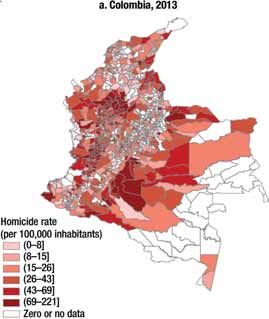
OVERVIEW 13MAP O.3: Homicides rates by municipality in Colombia, Guatemala,
El Salvador, and Brazil
14 STOP THE VIOLENCE IN LATIN AMERICAMAP O.3: Homicides rates by municipality in Colombia, Guatemala,
El Salvador, and Brazil (continued)
Sources: Instituto Colombiano de Medicina Legal, Guatemala’s National Police, El Salvador’s National Police, and DATASUS.
OVERVIEW 15countries persists: In Seattle, between 4.7 percent and 6.1 percent of street segments
accounted for 50 percent of the crimes in 2004; in Minneapolis, Minnesota, 3.5 percent
of addresses produced 50 percent of criminal offenders in 1989; and in Tel Aviv, 50 per-
cent of the criminal incidents were concentrated in 5 percent of the street segments in
2010 (Weisburd, Groff, and Yang 2012). LAC is in this sense no different. In Antioquia,
Colombia, 18 percent of municipalities accounted for 75 percent of department-wide
homicides in 2013. In Medellín, Colombia, approximately 13 and 30 percent of its 317
neighborhoods account for 50 and 75 percent of all the intentional homicides in a given
year, respectively, with little change in the degree of concentrations over the last decade.
The marked geographic concentration of violence highlights the importance of
understanding local-level determinants and networks in crime. It also stresses the criti-
cal need for data that match the nature of the problem, and draws attention to the limits
of analyses with aggregate country-level data. If a few states, a few municipalities, or a
few neighborhoods account for a large fraction of the violence, then the implications
for policy are clear: effective deployment of resources will likely include geographically
targeted interventions.
Most crime and violence occur close to the homes or neighborhoods of both victims and
perpetrators. Another local aspect of the phenomenon is that crime and violence tend to
be extremely proximal to victims: in 2012, 50 percent of victims in the region reported that
the last crime occurred at their home or in their neighborhood, and an additional 32 per-
cent fell victim somewhere within their municipality of residence. Only a small fraction fell
victim outside their municipality or abroad. Similar patterns hold for both property and
violent crimes. The stability of this pattern is noteworthy across countries in the region.
Not only do crimes occur in close proximity to the victims’ homes, but at least
three-quarters of crimes occur within the same municipality in which the perpetrators
live. In Mexico, this has been the case for 71 percent of homicides, 76 percent of prop-
erty crimes, and 85 percent of violent crimes over the last 15 years. Property crimes
tend to be more local in nature than violent crimes and homicides (figure O.6).
Crime is persistent: today’s crime rate is a strong predictor of tomorrow’s. Crime
is also contagious. What is possibly more worrisome from a policy perspective is that
crime in the region is not only concentrated geographically, but also exhibits high
degrees of persistence. Research discussed in the study formalizes and quantifies this
notion for the region as a whole and for a handful of specific countries. All else con-
stant, on average in Latin America and the Caribbean, an additional homicide in a given
year predicts 0.66 additional homicides in the following year. Persistence over time is
not only a feature of homicide statistics at the national level, but it is also observed at
subnational levels and holds true for different types of crime. Persistence is even higher
at the municipal level in Brazil and Mexico, with an additional homicide in one year
predicting 0.64 and 0.80 additional homicides the following year, respectively.
The parallel similarity with developed countries continues. The greatest predictor
of violence in the streets of U.S. cities is a prior violent incident, which mirrors the
behavior typical of epidemic waves (Slutkin 2013). As mentioned, violence in the
16 STOP THE VIOLENCE IN LATIN AMERICAYou can also read