STRATEGIC PRIORITIES - Chart of Accounts - City of Charlotte
←
→
Page content transcription
If your browser does not render page correctly, please read the page content below

Chart of Accounts

             STRATEGIC
             PRIORITIES

        35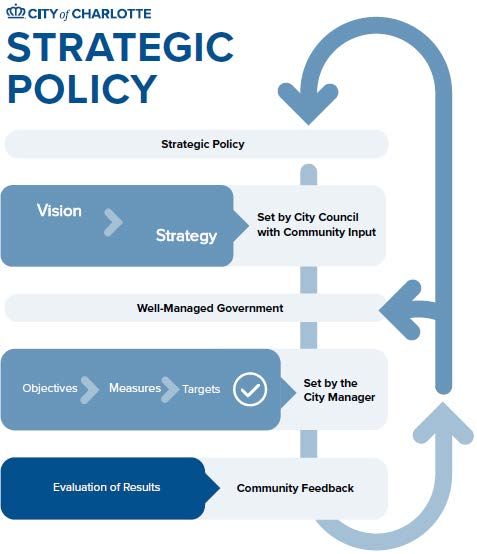
This page intentionally left blank.

                36
STRATEGIC PRIORITIES
At the January 2021 City Council Annual Strategy Meeting, strategic priorities were confirmed, with a continued focus
for FY 2022 on Accessibility, Mobility, and Connectivity. While COVID-19 is necessitating a shift in operations to deal
with the most immediate needs, the strategic priorities serve to set a focus on the higher-level policy framework
needed to guide the city’s recovery and progress forward.
The annual review of the strategic priorities provides updated guidance and focus in achieving the city’s vision. Part
of this year’s review included assessing the progress made toward the current priorities. In FY 2021, several
foundational elements were identified to ensure alignment with the city’s strategic priorities and achieving the city’s
vision. In FY 2022, the city is committed to building on that foundation and continuing the initiatives outlined in the
strategic priorities.
The strategic priorities defined by City Council guide decision making and align resource allocation:
o Economic Development (Economy, Jobs, and Upward Mobility)
Building and maintaining a successful business climate and workforce talent, including the number
of jobs with sustainable wages/benefits; economic opportunity for all residents, and encouraging
business development, innovation, and entrepreneurship.
o Great Neighborhoods (Affordable and Sustainable Neighborhoods)
Focusing on comprehensive initiatives designed to create affordable housing and provide
opportunities that align with creating great neighborhoods.
o Safe Communities (Safe, Healthy, and Inclusive Communities)
Ensuring neighborhoods are safe, healthy, and inclusive, with a focus on policing, fire protection,
and community relations.
o Transportation, Planning, and Environment (Accessibility, Mobility, and Connectivity)
Anticipate and plan for the growth of the community and safeguard the environment. Address
growth with strategic investments, building and maintaining a comprehensive transportation
network, and placemaking strategies that encourage connection between neighborhoods and
employment centers.
o Well-Managed Government (Efficient, Effective, Accountable, Responsive, Inclusive, and
Customer Focused)
Ensuring the city demonstrates leadership in financial stewardship, reviews best practices, and
ensures consistency in approach with an emphasis on effective and efficient services that are
accountable, customer focused, and inclusive.
The development of the FY 2022 Budget was guided by the strategic priorities with funding directed towards programs
and services that support these priorities. The priorities serve as the foundation for funding decisions and
setting objectives.
As part of the budget process, each department identifies and reviews measures to track efforts in achieving the
objectives and established targets. The objectives link the efforts to advancement of the citywide priorities, and the
measures gauge advancement within each of the priority areas. The strategic development process also incorporates
input and feedback from community engagement initiatives and events.
37To follow is an overview of the strategic planning process and a visual depiction of how the work of the
departments is assessed in terms of objectives, measures, and targets in advancing the strategic priorities toward
achieving Council’s vision.
• Objectives: An objective is the driver which describes the desired outcome that if achieved will further
progress in advancing the strategic priorities.
• Measures: Performance measures are metrics or indicators which assess progress towards meeting the
objective.
• Targets: Targets are benchmarks established to evaluate the effectiveness of efforts in meeting the objectives.
The Priority Setting Model below displays how each component builds toward the vision and priorities of the
city.
Department-specific performance measures for each strategic priority are included in individual department
pages. Selected performance measures from department plans are included in the following pages. These
measures highlight an important link in the internal roadmap of progress towards each strategic priority area.
38PRIORITY: Economic Development
(Economy, Jobs, and Upward Mobility)
The strategic priority of Economic Development is measured by creating great places that promote regional economic
growth, expanding the availability of good paying jobs through transformative projects, and attracting, growing, and
retaining new and existing businesses with a focus on increasing opportunities for upward mobility.
The City of Charlotte supports diverse businesses and economic opportunities for all. Building and maintaining a
successful business climate promotes workforce development, increases the number of jobs with sustainable wages
and benefits, provides economic opportunity, and encourages innovation and entrepreneurship.
Highlights of measures for the Economic Development priority area are provided below:
Economic Development
Objective Measure FY 2020 Actual FY 2021 Target FY 2022 Target
Increase business Dollar amount of $300,000,000 $300,000,000 $300,000,000
relocations and private investment in
expansions the city
The number of 7 ≥8 ≥8
company
announcements
Increase economic Number of private 159 220 80
mobility, social capital, sector businesses and
and career opportunities non-profits recruited
for youth to provide youth
internships, pre-
apprenticeships, job
shadowing, and other
work experiences
Partner with our Percentage of land 82% 90% 90%
customers to approve development reviews
development plans in an and inspections
efficient and collaborative completed within
manner that helps build a projected timeframe
safe and thriving and within an average
community of 2.5 review cycles
Support minority small Number of minority 32 ≥30 ≥30
businesses small businesses
participating in AMP
UP CLT cohorts to
prepare owners for
contracting
opportunities with the
Airport and other
anchor institutions
Support the city’s Increase the number Increased by 25% Increase by 20% Increase by 25%
economic development of participants in the
goals through the Apprenticeship
Apprenticeship Program Program
39PRIORITY: Great Neighborhoods
(Affordable and Sustainable Neighborhoods)
This priority area encompasses a holistic approach for neighborhoods. A comprehensive focus on neighborhood
development includes policies for affordable housing, enhancing community relations, and providing opportunities
for residents that sustain great neighborhoods.
Highlights of measures for the Great Neighborhoods priority area are provided below:
Great Neighborhoods
Objective Measure FY 2020 Actual FY 2021 Target FY 2022 Target
Preserve and Number of new affordable 1,349 900 900
increase affordable housing units funded
housing
Number of units acquired 168 265 225
and/or rehabilitated and
restricted for low-to
moderate- income
residents
Number of down payment 285 325 300
assistance loans provided
Preserve and create Percent of nuisance cases 94% 90% 90%
attractive and resolved within 30 days
environmentally
sustainable
neighborhoods
Foster Number of Neighborhood New Measure New Measure 60
neighborhood-driven Matching Grants awarded
revitalization and to economically-
improvement disadvantaged
communities
Maintain clean city Annual Keep Charlotte 1.81 ≤2.0 ≤2.0
for all residents Beautiful Litter Index
Rating assessment
Reduce interpersonal Percent of cases referred 73% 87% 87%
and community to Community Relations
conflicts that are successfully
resolved
40PRIORITY: Safe Communities
(Safe, Healthy, and Inclusive Communities)
The Safe Communities strategic priority emphasizes the city’s commitment to making all communities safe, healthy,
and inclusive. This commitment is emphasized by creating policies and practices for policing, fire protection, and
community relations that promote equity and inclusion. The major emphasis of this priority area is collaborating with
the community with a focus on creating and maintaining safe neighborhoods across all of Charlotte.
Highlights of measures for the Safe Communities priority area are provided below:
Safe Communities
Objective Measure FY 2020 Actual FY 2021 Target FY 2022 Target
Identify barriers to Number of 87 90 90
Americans with improvements made in
Disabilities Act (ADA) implementing ADA
compliance in public transition plan
right-of-way
Provide public Percent of Charlotte- 100% 100% 100%
education instruction Mecklenburg School’s
to increase safety and third graders receiving
health of families fire prevention
education in 111
schools
Number of senior 877 750 750
citizens receiving fall
prevention education
Provide alternative Percent of all CMPD New Measure New Measure 15%
response options for cases responded to
police calls through the Crisis
Intervention Team
(CIT)
Provide alternatives Percent increase in the New Measure New Measure 10%
to incarceration number of diversions
(Adult and Juvenile)
Reduce victimization Percent reduction in 11.5% Decrease >3% >3%
crime rates per
100,000 population
Timely response to Percent of 911 calls 91% 90% 90%
calls for service answered within 10
seconds
Percent of time first- 83% 90% 90%
due fire company
responds within 6
minutes
41Safe Communities
Objective Measure FY 2020 Actual FY 2021 Target FY 2022 Target
Timely response to Percent of priority 1 New Measure New Measure 100%
calls for service emergency calls for
police service
responded to within
seven minutes
42PRIORITY: Transportation, Planning, and
Environment (Accessibility, Mobility and
Connectivity)
The Transportation, Planning, and Environment strategic priority encompasses Charlotte’s current and future land
development, urban design, environmental considerations, and transportation needs to promote connectivity,
accessibility, and mobility for residents and visitors citywide. This priority area centers on developing the future of
Charlotte through proactive land use planning and connecting neighborhoods with places to work and play while
ensuring access to needed services and safeguarding the environment.
Highlights of measures for the Transportation, Planning, and Environment priority area are provided below:
Transportation, Planning, and Environment
Objective Measure FY 2020 Actual FY 2021 Target FY 2022 Target
Advance Number of high injury 2 Corridors 3 Corridors 3 Corridors
transportation network corridors that
projects supporting received street lighting
growth, walkability,
bicycle-friendliness, Miles of new sidewalks 4.83 ≥ 10 ≥ 10
and Vision Zero Action
Plan
Miles of new bikeways 2.12 ≥ 10 ≥ 10
Number of new 87 ≥ 25 ≥ 25
pedestrian safety projects
Number of service New Measure New Measure Report on the
requests completed number of service
within the six Corridors requests
of Opportunity investigated in each
area
Number of new and 35 New New ≥ 2 New ≥ 2
upgraded signals Upgraded ≥ 10 Upgraded ≥ 10
57 Upgraded
Maintain existing Annual Pavement 81.16% ≥ 85% ≥ 85%
infrastructure Condition Rating
Protect the Reduce sanitary sewer 3.4 ≤3.2 ≤3.0
environment overflows per 100 miles
of pipe
Provide Ridership (Light Rail, 18,118,756 22,195,669 15,302,493
transportation choices Bus, Streetcar, Vanpool,
and STS)
On-time performance 85% ≥ 89% ≥ 89%
(Bus)
43FOUNDATIONAL FOCUS:
Well-Managed Government
(Efficient, Effective, Accountable, Responsive,
Inclusive, and Customer Focused)
A foundational component within each of the three strategic priorities is a continued focus on well-managed
government. This focus guides continuous efforts of accountability as we strive to promote efficient, effective, and
quality services to the entire community.
The city's reputation as a financially Well-Managed Government is reflected in continued AAA bond ratings, the
annual receipt of the Government Finance Officer Associations award for budget and financial statements, and
unmodified opinions on external audit reports. Operational efficiencies and innovations are highlighted by the
many external recognitions received by the city and staff. Some highlights include:
• Charlotte Water employees being awarded from the North Carolina American Water Works Association /
Water Environment Association (NCAWWA-WEA):
o The George Warren Fuller Award,
o The Arthur Sidney Bedell Award,
o 2nd place in Division 2; setting a new record score for Process Control in the Virtual Operation
Challenge, and
o Certificate of Appreciation from U.S. Secret Service for work during the Republican National
Convention.
• Charlotte Water’s Pipes Hates Wipes Campaign was nationally recognized and was a Gold Winner in the
HERMES Awards, received a Savvy Award from City-County Communications and Marketing Association,
and the Crown Award from Public Relations Society of America, Queen City Public Relations Awards.
• General Services employee was awarded the North Carolina Sustainable Energy Association Clean Energy
Leader of the Year Award.
• General Services receiving recognition in fleet services by:
o Recognized by the National Association of Fleet Administrators are one of the best 100 fleets in
2020, and
o Government Fleet named the city a “Notable Fleet” for 2020.
• City of Charlotte awarded a Tree City, USA award for the 41st consecutive year
• Human Resources being recognized as the 2nd place winner in the 2020 Healthiest Employers of Greater
Charlotte Awards.
• Storm Water Services being recognized by the Water Environment Federation at the 2020 National
Municipal Stormwater and Green Infrastructure Awards as the Phase 1 Overall Winner and
receiving Gold Level recognition in project management and innovation.
• Housing and Neighborhood Services was nationally recognized by Bloomberg and the North Carolina
Department of Commerce for demonstrating cutting edge enhancements to deliver youth employment
experiences through the Mayor’s Youth Employment Program
In addition to developing further efficiencies and innovative approaches to service delivery, the city strives to
further refine internal service models to ensure the optimal balance of controls and streamlined services is
achieved. An example of this effort includes consolidating technology resources previously allocated across
departments to standardize service delivery, strengthen controls, and leverage knowledge across the city.
Additional continuous improvement efforts include the city’s focus on being an employer of choice. This effort is
demonstrated within the newly implemented compensation plan for employees designed to promote upward
mobility through clear career paths and increase pay equity across similar job classes and functions.
Highlights of measures for the Well-Managed Government priority area are provided in the following table:
44Well-Managed Government
Objective Measure FY 2020 Actual FY 2021 Target FY 2022 Target
Create an enhanced Percentage of 80% 80% 80%
applicant experience responding
through increased applicants satisfied
transparency and with applicant
communication into experience
the recruitment and
selection process
Deliver competitive Number of audits 7 12 13
audit services to issued
facilitate a well-
managed government.
Expand budget Collect and analyze New Measure New Measure Develop at least one
community outreach budget engagement new engagement
and engagement to participants’ initiative
ensure all members of demographic data to
the community have better target and
an opportunity to reach
share their voice underrepresented
community
members
Improve effectiveness Implement citywide New Measure Implement at least Implement at least
and efficiency through technology two processes each two processes each
organizational I&T processes critical fiscal year around fiscal year around
process improvement for I&T efficiency
equity; one equity; one
internally focused internally focused
and one resident- and one resident-
focused focused
Maintain low-cost Curbside collection $153 (FY 2019 < North Carolina < North Carolina
recycling and refuse cost per ton North Carolina statewide average statewide average
collection recyclable materials statewide average
$263)
Curbside collection $92 (FY 2019 < North Carolina < North Carolina
cost per ton refuse North Carolina statewide average statewide average
statewide average
$108)
Minimize the cost of Credit rating from Maintained AAA Maintain AAA credit Maintain AAA credit
incurring debt to external rating rating rating rating
finance capital agencies
projects
Overall customer Overall net 57% ≥ 58% ≥ 58%
satisfaction with promoter score as
Charlotte Area Transit expressed in net
System (CATS) promoter surveys
45Well-Managed Government
Objective Measure FY 2020 Actual FY 2021 Target FY 2022 Target
Promote customer Percentage of 100% Compliance 100% Compliance 100% Compliance
safety through the applicable
delivery of clean requirements met
water for the Safe
Drinking Water Act
and Clean Water Act
Promote Employee Percentage of 90% 80% 85%
Wellness eligible employees
opting for medical
insurance who are
electing the
wellness incentive
premium
Provide services that Percent of 311 calls 60% 70% 70%
efficiently meet the answered within 30
needs of 311 call seconds
center customers Call abandonment 11% ≤5% ≤5%
rate – Percent of all
calls abandoned by
the caller
46You can also read