SUBAREA PLAN & EIS SUMMARY OF ENGAGEMENT: VISIONING PHASE AUGUST 10, 2021 - City of Tacoma
←
→
Page content transcription
If your browser does not render page correctly, please read the page content below
SUBAREA PLAN & EIS SUMMARY OF ENGAGEMENT: VISIONING PHASE AUGUST 10, 2021
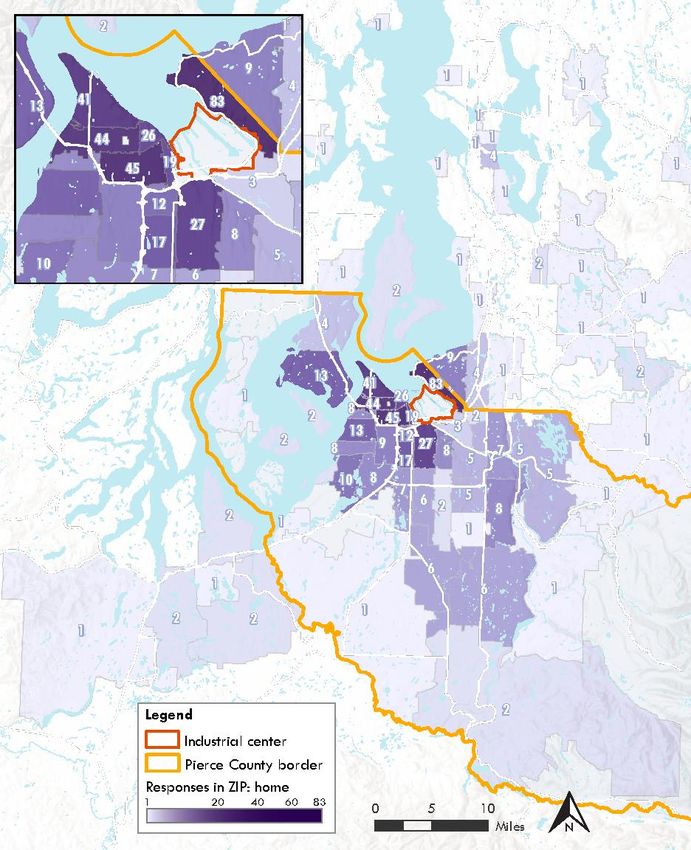
TABLE OF CONTENTS
Subarea Plan & EIS                           1

Summary of Engagement:                       1

  Executive Summary                          4
  Strengths & Challenges                          4
  Opportunities & Barriers                        5
  Features                                        5
  Land Uses                                       5
  Economic Development                            6
  Transportation                                  6
  Natural Resources                               6

  Engagement Process                         7
  Overview                                         7
  Guiding Principles for Engagement                7
  Stakeholders                                     8
  Equity Assessment                                8
  Outreach and Advertising Methods                 9
  Engagement Methods                              10

  Engagement Findings                        15
  Community Input: Methodology of Analysis   15
  Survey: Methodology of Analysis                 15
  Meeting: Methodology of Analysis                16
  Survey Findings                            18
  Respondent Demographics                         18
  Respondent Input                                24
  Meeting Findings                           39
  Vision                                          39
  Favorite Features                               42
3

Strengths, Opportunities, and Challenges                      43
Features to Maintain or Change                                47
General Comments                                              48

              April 2021 Interim Summary        50
Vision                                                        50
Favorite Features                                             51
Features that Should Stay the Same                            52
Features that Should Change                                   52
Strengths                                                     52
Challenges                                                    54
Opportunities                                                 55

              Stakeholders                      58

              Tideflats Advisory Group Meeting 5 Summary 61
Meeting Summary                                               61

              Community Survey                  66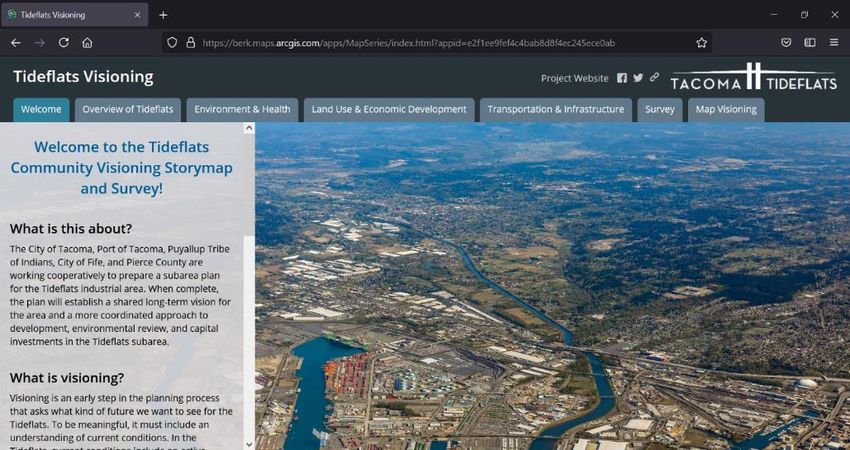
EXECUTIVE SUMMARY
This document summarizes the community engagement during the Visioning phase of the planning
process for the Tideflats Subarea Plan. The visioning phase lasted from January 2021 through the
final public meeting in May 2021. The purpose of this phase was to provide an opportunity to
think broadly about the desired future in the Tideflats Subarea and develop preliminary future
scenarios for further consideration and analysis. Engagement was designed to hear from a broad
group of community members who reflected the many interests and perspectives about the history,
current uses, and future of the Tideflats.

Engagement was promoted via communication materials and outreach methods designed to build
awareness about the project and advertise opportunities to engage. These methods included a
branded project identity, emails to the project listserv, an active project website, social media
posts, press releases, a promotional video, and a FAQ sheet. The five participating governments
actively participated in engagement and promotion of communications.

With the onset of the COVID-19 pandemic shortly after launching the outreach and engagement
efforts, it was necessary to rethink the approach and pivot to virtual interaction rather than the in-
person engagement opportunities originally envisioned. The revised outreach approach included
virtual public meetings, focus groups, expert panel discussions, an online survey, small group
briefings, social media and participation by the Tideflats Advisory Group (TAG).

As was defined in the project Work Plan, the TAG was formed to “provide input and feedback as
a sounding board for the Subarea Planning Process and the City during their respective parts of
the project” and to “serve as liaisons to the broader stakeholder groups they represent.” The first
meeting of the TAG occurred in February 2020 as an in- person working session that offered
both insights towards the vision and guidance on the Public Engagement Plan. The subsequent four
meetings were held virtually and continued to contribute to the visioning process.

The collective feedback that resulted from all engagement provides guidance for developing the
vision. The information in this report provides detail on the outcomes of the visioning process
activities.

Strengths & Challenges
Almost half of survey respondents identified that the Tideflats greatest strength was the Port of
Tacoma’s shipping, trade activity, and jobs. Just under half identified natural habitat as one of
the Tideflats strengths. Meeting participants identified the natural deep-water port, proximity to
on-land transportation and districts, and jobs to be the Tideflats strengths.
5

Challenges identified by meeting participants include complex interests, community
divisiveness, and incohesive uses; followed by environmental contamination or neglect; and
public education.

Opportunities & Barriers
Survey respondents overwhelmingly identified the restoration and cleanup of natural areas as
one of their top three opportunities for the Tideflats, followed by preserving and strengthening
jobs, transitioning away from fossil fuel facilities, and transportation improvements.

Meeting participants identified transitioning away from fossil fuels, increasing clean industry,
addressing climate change, and improving the natural environment as the greatest opportunities
in the Tideflats.

Barriers identified by meeting participants include a lack of community understanding, poor
transportation or infrastructure, and politics.

Features
Meeting participants favorite features of the Tideflats included natural resources and wildlife,
the Port of Tacoma and working waterfront, and recreation.

Meeting participants indicated they would like to see several features maintained, including
environmental protection and clean industry, as well as jobs, business, and economic
development.

Meeting participants would like to change and improve environmental contamination, water
quality, or air quality, as well as reduce fossil fuels, increase renewable energy and jobs.

Land Uses
Survey respondents preferred industrial uses including green industrial uses or industrial uses
that promote a more environmentally sustainable economy, followed by container shipping
and international trade, port maritime uses, and a mix of industrial uses with a wider range of
businesses and activities.

Respondents preferred complementary land uses including cultural, educational, and maritime
heritage facilities; small-scale manufacturing spaces for fabrication or production; and public
shoreline access and recreation facilities.
Economic Development
Respondents top three visions for economic development included environmental remediation,
investments in infrastructure to expand port facilities, and investments in transportation
improvements.

Transportation
More than half of respondents identified traffic congestion and backups as their primary
concern, followed by train and truck safety, limited walking options, and limited bridge access
across the Puyallup River and other waterways. The most common suggested improvements were
adding more biking, transit, and walking options.

More than half of survey respondents indicated that they only travel through the Tideflats as part
of a longer trip. This was followed by 37% of respondents who travel through the area to access
schools and neighborhood services, 34% who work in the Tideflats, and 33% who travel to the
Tideflats for recreation.

Natural Resources
Over half of respondents envision providing more cleanup of contaminated areas, followed by
protection for salmon, shellfish, and marine life. Other popular visions include putting in place
green industrial development standards to promote sustainability and reduce greenhouse gas
emissions and provide more shoreline/habitat restoration and enhancement.

When asked about their level of interest in marine life, 66% of respondents indicated that they
were very interested, followed by 21% who were somewhat interested.

When asked about their values for natural resource areas, respondents were most interested in
protecting natural areas, preserving cultural purposes, providing recreational opportunities, and
providing fisheries industry jobs and traditional subsistence living.
7

       ENGAGEMENT PROCESS
Overview
The community and stakeholder engagement process aligned with guidance laid out in the Public
Engagement Plan and included development of communication materials, facilitation of community
visioning sessions, initiation of meetings supported by meeting-in-a-box materials, visioning open
houses and expert panels, and ongoing online outreach. The Tideflats Advisory Group (TAG) and
Tideflats Subarea Plan Steering Committee, Staff leadership Group, and Project Management
Team also met regularly during this phase to provide guidance and input.
Due to the COVID-19 pandemic and resulting public meeting restrictions, engagement was fully
virtual. To facilitate a robust process despite this challenge, the engagement team – in
collaboration with the five participating governments - offered a wide range of virtual methods
to engage, summarized in the following sections.

Guiding Principles for Engagement
The following principles, based on guidance from One Tacoma, the City of Tacoma’s
Comprehensive Plan, provided guidance for engagement activities:
▪ Communicate early, often, and clearly about purpose and process so the community is well
   informed and engaged in the planning of the project.
▪ Actively solicit information from businesses, residents, property owners, organizations, and
   other governments about their questions, priorities, and concerns.
▪ Apply an equity lens to identify and intentionally engage across different demographic,
   racial, cultural and economic spectrums that make up our community to seek the perspectives
   of those who may have been historically marginalized or excluded and unlikely or unable to
   participate in the process.
▪ Focus engagement around issues that can be molded and influenced by public input to ensure
   it remains relevant and consistent with community needs.
▪ Build project support through outreach and engagement efforts that allow for meaningful input
   throughout the constantly evolving process.
▪ Integrate plan development with environmental review to ensure a seamless experience for
   participants and multiple opportunities to comment.

The pivot to online engagement limited opportunities for community members without access to or
comfort with technology to participate. Conversely, online meetings were more accessible to
individuals with barriers to participation in traditional in-person public meetings, such as childcare,
transportation, or mobility issues. Future engagement should balance in-person and online meeting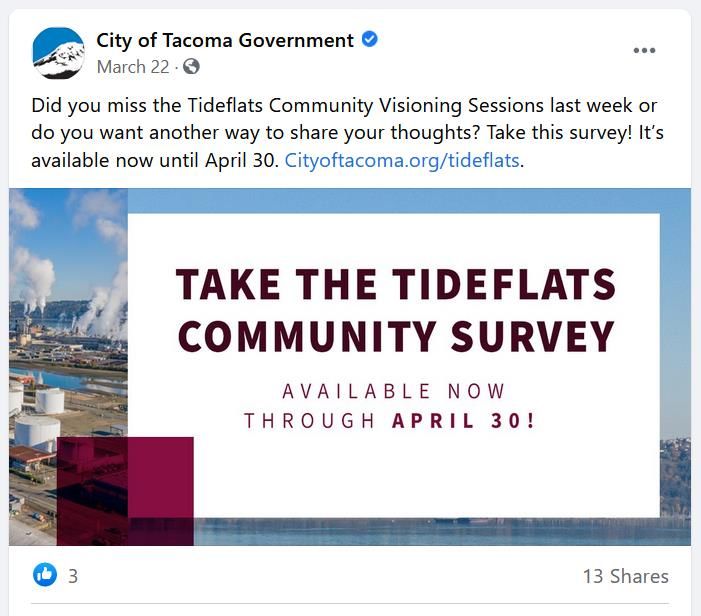
opportunities with a robust notification strategy that includes other low-tech methods of
communicating with the community.

Stakeholders
There are a variety of stakeholders with a range of interests in this plan across the five
participating governments. In addition to the stakeholders identified in the Work Plan, an initial
set of stakeholders by stakeholder group is included in Appendix B. This list will be updated as
the planning process unfolds.

The range of interests represented on the Tideflats Advisory Group (TAG) helped ensure regular
participation in the process from many of the project's stakeholder groups, including port users,
labor, regional economic, adjacent jurisdictions, and environmental groups. Community
organizations, agencies, elected officials, and boards and commissions were well represented in
the Meetings in a Box, Panels, and Focus Groups. This stakeholder group was equipped to
participate in online meetings Future phases of engagement should focus on reaching those less
able to participate virtually.

Equity Assessment
Equity strategies were woven into each of the engagement activities. Given increasingly diverse
demographics, as well as past failures to fully engage all members of the community, these
strategies included the provision of supports such as translation and interpretation, engagement
with trusted community partners, and a diverse range of ways to provide input. The participating
governments adapted public engagement methods to public health guidance for COVID-19.
9

Accommodations
Project advertisements included
the following standard language      Exhibit 1. Sample Spanish Interpretation Support for the
from the City of Tacoma:                         Visioning Report-Out

     The City of Tacoma does not
     discriminate on the basis of
     disability in any of its
     programs, activities, or
     services. To request this
     information in an alternative
     format or to request a
     reasonable accommodation,
     please contact the Planning
     and Development Services
     Department at (253) 591-
                                     Source: BERK, 2021.
     5056 (voice) or (253) 591-
     5820 (TTY).

Interpretation
Spanish language interpretation via Zoom was available at the two largest public meetings, the
Community Kickoff and Visioning Report Out.

Outreach and Advertising Methods
Communication materials and methods were        Exhibit 2. Project Website
designed to build awareness about the
project and advertise opportunities to
engage. These included:
▪ Project identity and templates. The
    project identity created a consistent “look
    and feel” for all project materials to
    increase visibility and overall public
    awareness of the project.
▪ FAQ sheet. The frequently asked
    questions sheet provided overview
    information about the project, key issues,
    and options and was developed based on
                                                  Source: BERK, 2021.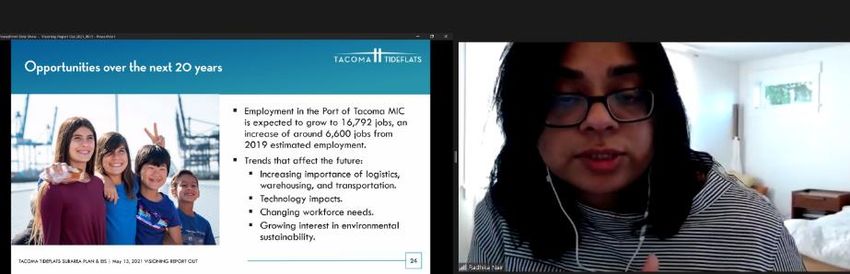
the comments, questions, and issues raised
    throughout the project.                       Exhibit 3. Sample Social Media Post
▪   Emails to project listserv. The project                   Advertising the Visioning Survey
    team emailed a comprehensive list of all
    project participants, including public
    meeting attendees, advisory group
    members, elected officials, media
    representatives, and any other groups
    that may be interested in the project.
▪   Project website. The website offered an
    up-to-date, accessible source of
    information for all aspects of the project.
▪   Social media. The project team used
    Facebook, Twitter, and Instagram to
    announce project news and promote and
    document events and solicit feedback
    from a broader audience, including those
    who may not typically participate in       Source: BERK, 2021.
    planning initiatives.
▪   Press releases. Press releases were drafted and distributed by all five participating
    governments in advance of the two large public meetings during the visioning process.
▪   Promotional video. A 30-second promotional video provided a visually engaging overview
    of the Tideflats Subarea and why the community should be invested in the subarea planning
    process.

Communications staff at the five participating governments conducted a significant portion of the
outreach. Their efforts were coordinated using a detailed Communications Plan that ensured staff
at each participating government would share the same information with their respective
audiences on the same timeline.

Engagement Methods
Engagement activities included a range of meeting types and an online survey.

Survey
An online survey was the primary method for stakeholders and the public to provide visioning
input on their own schedules and in an open-ended format. The story map and visioning survey
went live on March 15, 2021 and the survey remained open through April 30, 2021. During this
time, 602 individuals provided input via the survey, including 1,172 open-ended comments.
11
The survey was integrated into an online interactive story map that allowed interested individuals
to learn more about the Tacoma Tideflats while responding to the survey. The survey blended
multiple choice and open-ended questions, including an option to respond with an open-ended
“other” response to any multiple-choice question. This offered respondents a fully open-ended
opportunity to provide input to the visioning process. All quantitative survey findings, along with
qualitative themes from
Exhibit 4. Story Map
the open-ended survey
comments, are provided
in the Engagement
Findings section.
Source: BERK, 2021.Meeting Types
Stakeholder and public meetings were the primary way of providing real-time feedback on the
project. There were four input-focused meeting types:
Tideflats Advisory Group (TAG) regular meetings. The TAG provided input and feedback
as a “sounding board” for the Subarea Planning Process and the City during their respective
parts of the process. TAG members also served as liaisons to the broader stakeholder groups
they represent, and some served as
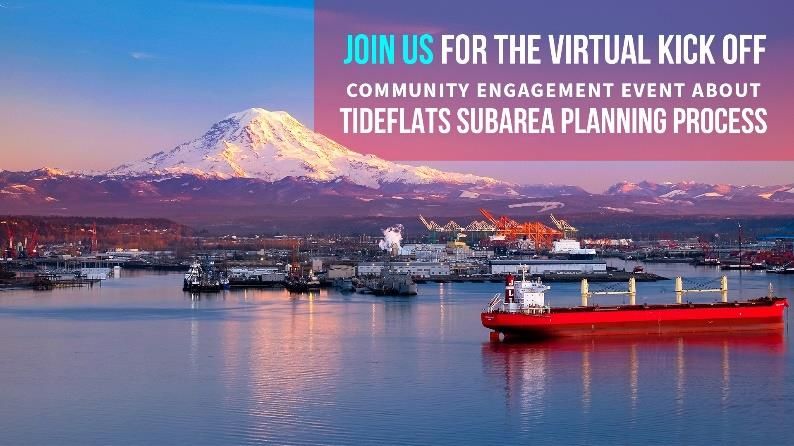
panelists at topic focused meetings. Exhibit 5. Advertisement for the Community Kickoff
Community Kickoff. The Tideflats
Subarea Plan project team hosted a
virtual community kickoff meeting on
Thursday, February 4, 2021 to
initiate the public engagement period
of the project. The meeting occurred
via Zoom and included Spanish
interpretation and English closed
captioning. A recording of the
meeting is available on Facebook,
where the meeting also streamed
Source: City of Tacoma, 2021.
live. Participants provided input via
online real-time polling through
Mentimeter, an online platform that allows virtual meeting participants to provide feedback
through a variety of question types.
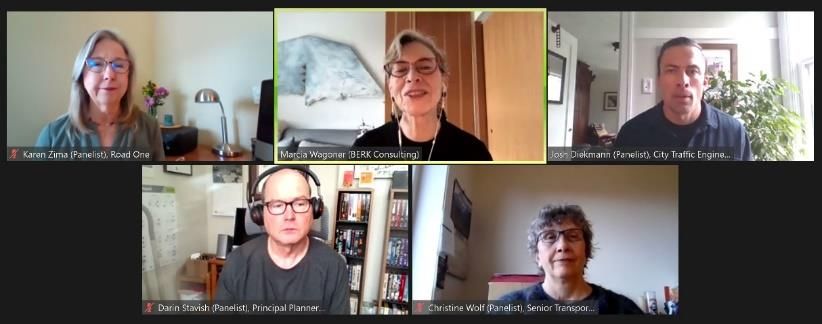
Visioning focus groups. Two focus groups meetings were conducted. Participants were
invited to ensure a balanced mix of interests in economic development, natural environment,
transportation, and
capital facilities
Exhibit 6. Focus Group Participants
planning. The
meetings were
designed to gather
visions from a wide
range of
perspectives and
allow for an in-
depth discussion of
issues through a
facilitated focus
group discussion. Source: BERK, 2021.13
“Meetings-in-a-Box.” Members of Exhibit 7. Sample Meeting in a Box Slides
the Project Management (PM)
Team, Staff Leadership Team, and
TAG hosted informational
discussions at existing community
meetings to share information
about the process and seek input.
Meeting hosts were all provided a
set of materials that described the
project and provided a discussion
guide with questions that allowed
a consistent set of responses.
Source: BERK, 2021.
In addition, there were two additional meeting types that were primarily intended to share
information with participants, rather than gathering input. As a result, we do not include the
minimal input gathered at these meetings in this summary document.
Visioning panels. Panelists with an Exhibit 8. Transportation and Infrastructure Panel
interest in the Tideflats area
participated in a panel discussion
of three visioning themes: (1) land
use and economic development, (2)
natural environment and health, or
(3) transportation and
infrastructure. Panels occurred in a
public meeting setting and focused
on panelists’ perspectives on Source: BERK, 2021.
opportunities, challenges, and their
20-year visions in the Tideflats. These discussions were intended to provide background
information in support of the online survey. Panel discussions were followed by a question-
and-answer session for attendees.
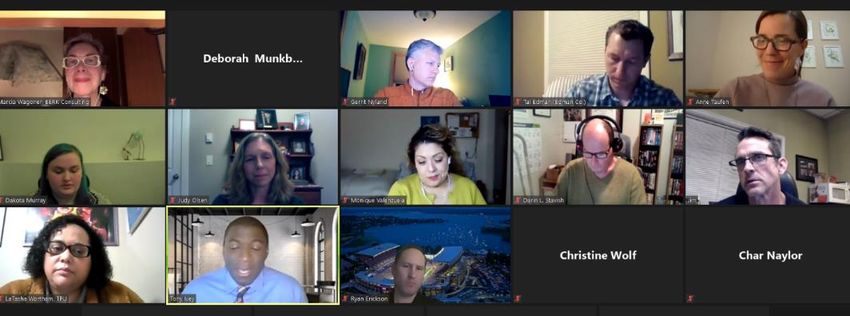
Visioning Report Out. Exhibit 9. Visioning Report Out
Project staff presented key
themes and takeaways from
the visioning meetings
outlined above. Panelists
participated by answering a
series of informal Zoom
polls.
Source: BERK, 2021.The following table lists the meetings summarized in this document. The Engagement Findings
section summarizes the feedback provided at these meetings.
Exhibit 10. Visioning Meetings
Meeting Type Participant Type Meeting Date Attendees
TAG TAG Meeting 3 1/21/21 18
Tideflats Advisory
TAG TAG Meeting 4 2/18/21 14
Group
TAG TAG Meeting 5 4/15/21 16
Community Kickoff Public Kickoff 2/4/21 56+
Visioning Focus Key Stakeholders (by Visioning Focus Group 1 3/2/21 14
Group invite) Visioning Focus Group 2 3/4/21 13
Community group Tacoma Transportation Club 3/8/21 85
Puyallup Tribe of Indians Planning 3/9/21 3
Puyallup Tribe of Indians
Commission
Puyallup Tribe of Indians Fishing 3/12/21 4
Puyallup Tribe of Indians
Commission
Community group Propellor Club of Tacoma 3/16/21 25
City of Tacoma Sustainable Tacoma Commission 3/18/21 13
Pierce County Pierce County Council* 12
Fife/Milton/Edgewood Chamber of 3/30/21 12
Chambers of Commerce
Commerce*
Community Group Pierce County Green Drinks 4/1/21 11
Meetings in a Box Community Group Citizens for a Healthy Bay Pt. 1 of 2 4/1/21 4
Chambers of Commerce Puyallup/Sumner Chamber of Commerce* 4/6/21 34
Community Group Citizens for a Healthy Bay Pt. 2 of 2 4/6/21 1
Chambers of Commerce Lakewood Chamber of Commerce 4/8/21 n/a
Citizens for a Healthy Bay Policy and 4/15/21 8
Community Group
Technical Advisory Committee
Community Group Northeast Tacoma Neighborhood Council 4/15/21 20
City of Tacoma Tacoma Transportation Commission 4/21/21 26
City of Tacoma Puyallup River Watershed Council 4/22/21 20
City of Fife Fife Planning Commission* 4/5/21 14
City of Fife Fife City Council* 3/23/21 18
Panel 1: Land Use and Economic 3/17/21 45
Visioning Panels Development
Public
Panel 2: Environment and Health 3/18/21 32
Panel 3: Transportation and Infrastructure 3/20/21 10
*Informational. Engagement not conducted.
Source: BERK, 2021.15
ENGAGEMENT FINDINGS
Community Input: Methodology of Analysis
The following sections summarize themes of input gathered through visioning activities. We present
findings in two sections based on whether the input was gathered through the survey or at
meetings, due to differences in each type of input as noted in Exhibit 11.
Exhibit 11. Differences in Input Gathered via Meetings and the Survey
Attribute Survey Meetings
Proportionate There is a one-to-one relationship between Some individuals may have attended more than
representation individuals and survey responses: each survey one visioning meeting, so their opinions may be
of respondents response represents a single individual. represented more than once in the Meeting
summary.
Questions All survey respondents provided input based Meeting design was intended to provide for
posed on the same survey prompts. Survey questions consistent feedback across all outreach methods,
were developed by the project team and though some questions evolved over time based
then vetted with the communications on feedback on what was successful. Meeting-in-
departments of each government. The a-box materials provided consistent discussion
questions were intended to tease out areas questions and materials, though individual
of conflict, values, and preferences of the meeting hosts selected specific questions based on
responder. audience, time, and context.
Level of detail Detail is consistent across all survey Meeting notetakers provided notes of varying
responses, with the exception of responses to detail based on level of involvement in the
the open-ended questions. project. Volunteer meeting hosts were guided to
provided summary bullets that simply synthesized
discussion takeaways from entire meetings, to
minimize reporting effort. Staff and consultant
meeting notetakers provided full meeting
transcripts.
Direct quotes All free-response input provided in the survey Input gathered from meetings have been
is a direct quote from the respondent. summarized/paraphrased at times by notetakers.
Source: BERK, 2021.
Survey: Methodology of Analysis
The online survey gathered feedback from 602 respondents. We present charts of multiple-choice
responses in dark blue in the following sections. Many respondents added open-ended responsesas “other” responses to questions. To synthesize and concisely present this open-ended feedback, we coded each open-ended comment with one or more themes based on the content of the comment, then created charts presented in light blue in the following sections. Charts of open- ended responses are presented as counts of respondents rather than as percentages because the total number of open-ended responses is lower than the number of multiple choice responses. Meeting: Methodology of Analysis The project consultants gathered input from meetings in a range of formats, including: ▪ Transcripts of meetings. ▪ Thematic summaries of key takeaways from meetings. ▪ Direct open-ended comments from participants via online engagement tools like Mentimeter. To best synthesize and concisely present this open-ended feedback, we coded each open-ended comment with one or more themes based on the content of the comment, then created charts presented in yellow in the following sections. Please note that due to the varying formats of the open-ended feedback, meeting input is less precisely quantifiable than survey input. For example, each survey response represents a single responding individual, but some thematic summaries from meetings may represent multiple individuals, or a single person may have provided input at multiple meetings. Therefore, while the following charts show the frequency of themes that arose in meeting input, these counts should be interpreted only as approximations of stakeholder levels of interest in any given topic. Charts show all themes that appeared at least twice, but if a theme appeared only once in the meeting input, we categorized it as an “other” comment. Exhibit 12 shows the categories of input gathered at each meeting, which are the same categories we use to organize the Meeting Findings section. This table can be used to trace the sources of the findings presented in this document.
17

Exhibit 12. Categories of Input Gathered at Meetings
                                                                                            Categories of Input

                                                                                                                       Challenges and Barriers

                                                                                                                                                 Features to Maintain

                                                                                                                                                                        Features to Change

                                                                                                                                                                                             General Comments
                                                                       Favorite Features
  Meeting Type                         Meeting

                                                                                                       Opportunities
                                                                                           Strengths
                                                              Vision
Tideflats Advisory TAG Meeting 3
Group              TAG Meeting 4
Community Kickoff Kickoff

Visioning Focus       Visioning Focus Group 1
Group                 Visioning Focus Group 2
                      Tacoma Transportation Club
                      Puyallup Tribe Planning Commission
                      Puyallup Tribe Fishing Commission
                      Propellor Club of Tacoma
                      Sustainable Tacoma Commission
                      Pierce County Green Drinks
Meetings in a Box Citizens for a Healthy Bay

                      Lakewood Chamber of Commerce
                      Citizens for a Healthy Bay Policy and
                      Technical Advisory Committee
                      Northeast Tacoma Neighborhood Council
                      Tacoma Transportation Commission
                      Puyallup River Watershed Council

Source: BERK, 2021.
Survey Findings
Respondent Demographics
Respondents represented a range of age groups with the largest number of individuals falling
between the ages of 35 – 44 (25%) and 45 – 54 (24%). Approximately 79% of respondents
fall between the ages of 25 and 64, compared to about 66% Pierce County residents who are
between 20 to 64 years old.
Individuals with a range of household incomes took the survey, though the majority have household
incomes between $50,000 and $99,999 (27%) and $100,000 and $149,999 (25%).
73% of respondents identified as White/Caucasian, followed by 8% Native American/Alaska
Native, 5% Latino/Latinx/Hispanic, and 4% Black/African. It is not possible to directly compare
these proportions to the racial or ethnic demographics of the full community’s population: Survey
respondents could indicate multiple races or ethnicities with which they identify, but the US Census
(the source of race and ethnic data) requires individuals to select only a single race or ethnicity, or
to general indicate they identify with “two or more races.” However, 67% of Pierce County
residents identify as White, 11% identify as Hispanic of any race, and 22% identify as non-
Hispanic people of color, which includes people who identify as Asian, Black/African American,
Native Hawaiian/Other Pacific Islander, two or more races, or another race.
The largest number of respondents – 83 respondents, or approximately 15% – indicated their
home zip code was 98422, followed by roughly 8% living in each 98405 and 98406. The
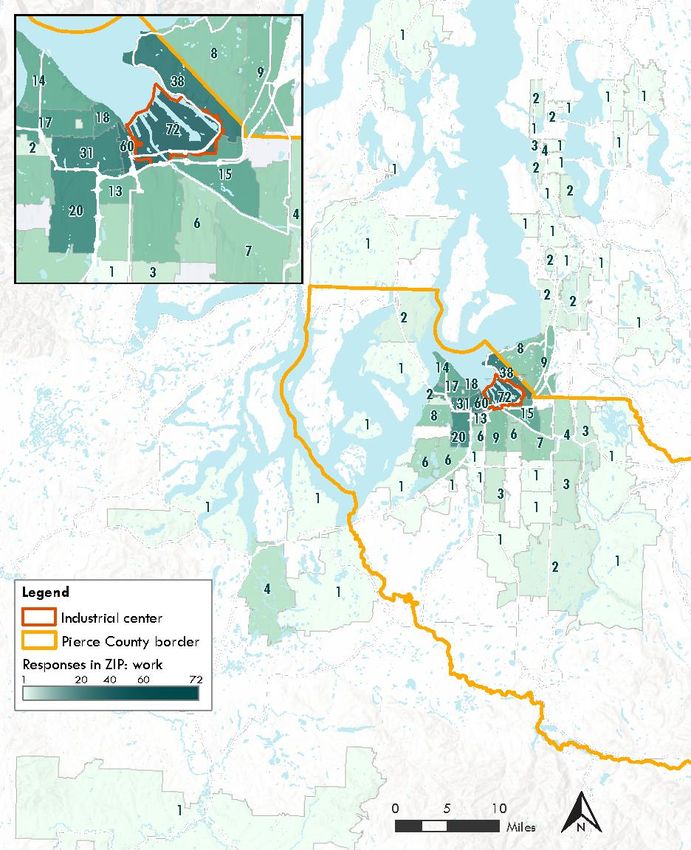
largest number of respondents – 70 respondents, or approximately15% – indicated their work
zip code was 98421, followed by nearly 13% working in 98402 and 8% in 98422.
Exhibit 13. Age of Survey Respondents (575 responses)
Survey Prompt: “Age.”
30%
25%
25% 24%
20%
15% 15%
15% 11%
10%
5%
5% 3% 2%
0%
0%
17 and 18 – 24 25 - 34 35 - 44 45 – 54 55 – 64 65 – 74 75 and Rather
under over Not Say
Source: BERK, 2021.19
Exhibit 14. Household Income of Survey Respondents (569 responses)
Survey Prompt: “Household Income.”
30% 27%
25%
25% 21%
20% 16%
15%
10% 8%
5% 2%
0%
Less than $25,000 to $50,000 to $100,000 to $150,000 or Rather Not Say
$25,000 $49,999 $99,999 $149,999 more
Source: BERK, 2021.
Exhibit 15. Race or Ethnicity of Survey Respondents (561 responses)
Survey Prompt: “Race/Ethnicity (check all that apply).”
0% 10% 20% 30% 40% 50% 60% 70% 80%
Asian 3%
Black/African 4%
Latino/Latinx/Hispanic 5%
Middle Eastern/North African 1%
Native American/Alaska Native 8%
Pacific Islander/Native Hawaiian 2%
White/Caucasian 73%
Other 3%
Rather Not Say 14%
Note: Percentages do not sum to 100 because respondents could select multiple options.
Source: BERK, 2021.Exhibit 16. Home Zip Codes of Survey Respondents (539 responses)
Survey Prompt: “Home Zip Code.”
Source: BERK, 202121
Exhibit 17. Home Zip Codes of Survey Respondents - Table Format (539 responses)
Survey Prompt: “Home Zip Code.”
Number of Proportion of Number of Proportion of
Zip Code Zip Code
Respondents Respondents Respondents Respondents
98422 83 15.4% 97407 1 0.2%
98405 45 8.3% 98001 1 0.2%
98406 44 8.2% 98013 1 0.2%
98407 41 7.6% 98020 1 0.2%
98404 27 5.0% 98022 1 0.2%
98403 26 4.8% 98024 1 0.2%
98402 19 3.5% 98026 1 0.2%
98408 17 3.2% 98038 1 0.2%
98335 13 2.4% 98042 1 0.2%
98466 13 2.4% 98052 1 0.2%
98418 12 2.2% 98058 1 0.2%
98498 10 1.9% 98059 1 0.2%
98023 9 1.7% 98102 1 0.2%
98409 9 1.7% 98104 1 0.2%
98374 8 1.5% 98116 1 0.2%
98443 8 1.5% 98117 1 0.2%
98465 8 1.5% 98118 1 0.2%
98467 8 1.5% 98122 1 0.2%
98499 8 1.5% 98166 1 0.2%
98372 7 1.3% 98198 1 0.2%
98444 7 1.3% 98208 1 0.2%
98338 6 1.1% 98247 1 0.2%
98387 6 1.1% 98310 1 0.2%
98445 6 1.1% 98321 1 0.2%
98371 5 0.9% 98327 1 0.2%
98373 5 0.9% 98342 1 0.2%
98390 5 0.9% 98349 1 0.2%
98391 5 0.9% 98359 1 0.2%
98003 4 0.7% 98360 1 0.2%
98144 4 0.7% 98362 1 0.2%
98332 4 0.7% 98375 1 0.2%
98424 3 0.6% 98412 1 0.2%
98010 2 0.4% 98432 1 0.2%
98055 2 0.4% 98476 1 0.2%
98070 2 0.4% 98503 1 0.2%
98328 2 0.4% 98504 1 0.2%
98333 2 0.4% 98507 1 0.2%
98354 2 0.4% 98512 1 0.2%
98388 2 0.4% 98541 1 0.2%
98446 2 0.4% 98580 1 0.2%
98501 2 0.4% 98611 1 0.2%
98513 2 0.4% 98902 1 0.2%
98516 2 0.4%
Source: BERK, 2021Exhibit 18. Work Zip Codes of Survey Respondents (467 responses)
Survey Prompt: “Work Zip Code.”
Source: BERK, 202123
Exhibit 19. Work Zip Codes of Survey Respondents – Table Format (467 responses)
Survey Prompt: “Work Zip Code.”
Number of Proportion of Number of Proportion of
Zip Code Zip Code
Respondents Respondents Respondents Respondents
98421 72 15.4% 98000 1 0.2%
98402 60 12.8% 98005 1 0.2%
98422 38 8.1% 98015 1 0.2%
98405 31 6.6% 98020 1 0.2%
98409 20 4.3% 98033 1 0.2%
98403 18 3.9% 98042 1 0.2%
98406 17 3.6% 98052 1 0.2%
98424 15 3.2% 98055 1 0.2%
98407 14 3.0% 98105 1 0.2%
98418 13 2.8% 98108 1 0.2%
98003 9 1.9% 98109 1 0.2%
98404 9 1.9% 98122 1 0.2%
98023 8 1.7% 98144 1 0.2%
98401 8 1.7% 98146 1 0.2%
98466 8 1.7% 98164 1 0.2%
98371 7 1.5% 98168 1 0.2%
98408 6 1.3% 98188 1 0.2%
98443 6 1.3% 98247 1 0.2%
98498 6 1.3% 98335 1 0.2%
98499 6 1.3% 98337 1 0.2%
98104 4 0.9% 98360 1 0.2%
98372 4 0.9% 98362 1 0.2%
98501 4 0.9% 98367 1 0.2%
98101 3 0.6% 98370 1 0.2%
98374 3 0.6% 98373 1 0.2%
98390 3 0.6% 98375 1 0.2%
98445 3 0.6% 98387 1 0.2%
00000 2 0.4% 98388 1 0.2%
98032 2 0.4% 98391 1 0.2%
98103 2 0.4% 98419 1 0.2%
98118 2 0.4% 98426 1 0.2%
98134 2 0.4% 98433 1 0.2%
98158 2 0.4% 98438 1 0.2%
98195 2 0.4% 98444 1 0.2%
98198 2 0.4% 98447 1 0.2%
98332 2 0.4% 98448 1 0.2%
98338 2 0.4% 98493 1 0.2%
98416 2 0.4% 98502 1 0.2%
98465 2 0.4% 98504 1 0.2%
09400 1 0.2% 98513 1 0.2%
90246 1 0.2% 98516 1 0.2%
91320 1 0.2% 98532 1 0.2%
94107 1 0.2% 98902 1 0.2%
97374 1 0.2%
Source: BERK, 2021Respondent Input The following sections are presented in the order the questions were asked in the survey. The full survey is available in the appendix. We present charts of multiple-choice responses in dark blue in the following sections. Many respondents added open-ended responses as “other” responses to questions. To synthesize and concisely present this open-ended feedback, we coded each open-ended comment with one or more themes based on the content of the comment, then created charts presented in light blue in the following sections. Charts of open-ended responses are presented as counts of respondents rather than as percentages because the total number of open-ended responses is lower than the number of multiple-choice responses.
25

Strengths and Opportunities
Exhibit 20 summarizes survey respondents’ opinions on the Tideflats’ most important strengths.
Almost half of respondents selected Port of Tacoma shipping, trade activity, and jobs as one of
their top three strengths, and 46% of respondents selected natural habitat. Following these two
top choices were Puyallup Tribe of Indians, living wage jobs, shoreline access and recreation, the
economic engine, and job-creating companies and industries on private land in the Tideflats.

Exhibit 20. Survey Responses about the Tideflats’ Most Important Strengths (602 responses)
            Survey Question: “What are the most important strengths of the Tideflats? Not sure?
            Try this question instead: What is your favorite part about the Tideflats? Please select
            your top three.”

 Port of Tacoma shipping, trade activity, and jobs                                                  48%

                                    Natural habitat                                                46%

                          Puyallup Tribe of Indians                                         36%

                                  Living-wage jobs                                  29%

                  Shoreline access and recreation                                   28%

                                   Economic engine                            24%
 Job-creating companies and industries on private
                                                                            20%
               land in the Tideflats
                                  Industrial activity              13%

                                 Maritime heritage                12%

                                   Regional impact               10%

                                Global connections           6%

                                 Diverse businesses         6%

                  Other strengths (please specify)           3%

                                None of the above           1%

                                                        0%         10%        20%         30%     40%     50%

       Themes of open-ended responses to “Other strengths (please specify)”:
                                                        0                             2                         4

         Potential for conversion to safe, green jobs                                                       4
        Nearby on-land transportation and districts                     1
                                              Other                                                         4
Source: BERK, 2021.
Exhibit 21 summarizes survey respondents’ opinions on the Tideflats biggest opportunities. 51% of
respondents, the largest share for any option, selected restoration and cleanup of natural areas
as one of their top three. This was followed by preserving and strengthening jobs, transitioning
away from fossil fuel facilities, and transportation improvements.
Exhibit 21. Survey Respondents’ Opinions on the Tideflats’ Biggest Opportunities (602
responses)
Survey question: “What are the biggest opportunities in the Tideflats? Not sure? Try
this question instead: What would you like to see added or improved through the
Tideflats subarea plan? Please select your top three.”
Restoration and cleanup of natural areas 51%
Preserving and strengthening jobs 38%
Transitioning away from fossil fuel facilities 36%
Improvements to transportation (reducing congestion,
36%
improving freight access etc.)
Increase employment in the Tideflats for Tacomans
30%
specifically
Improvements and redevelopment based on climate
28%
change
Enhancing shoreline public access and water-based
26%
recreation
Resolve land use conflicts 16%
Infrastructure projects for water and sewer 13%
Reducing vehicle miles traveled 5%
Other opportunities (please specify) 5%
None of the above 0%
0% 10% 20% 30% 40% 50%
Themes of open-ended responses to “Other opportunities (please specify)”:27
0 2 4
Coexistence of working port and community 4
Leadership: modern manufacturing industrial center 4
Global connections 3
Other 1
Source: BERK, 2021.Land Uses Exhibit 22 summarizes respondents’ preferred industrial land uses in the Tideflats. The most commonly selected response was green industrial uses or industrial uses that promote a more environmentally sustainable economy, followed by container shipping and international trade, port maritime uses, and a mix of industrial uses with a wider range of businesses and activities. Exhibit 23 summarizes respondents’ preferred complementary land uses in the Tideflats. The options most frequently selected on their top three options were cultural, educational, and maritime heritage facilities (36%); small-scale manufacturing spaces for fabrication or production (35%); and shoreline public access and recreation facilities (35%).
29

Exhibit 22. Survey Respondents’ Preferred Industrial Tideflats Land Uses (602 responses)
            Survey Question: “What kinds of industrial land uses should be emphasized in the
            Tideflats study area over the next 20 years? Please select your top three. Note: The
            options below are for visioning purposes only and have not been evaluated for
            feasibility.”
 Green industrial uses or industrial uses that promote
 a more environmentally sustainable economy such as
                                                                                                                  59%
   green-energy production, manufacture of wind
                     turbines, etc.

      Container shipping and international trade uses                                                  45%

                                            Port maritime uses                                   39%

     A mix of industrial uses with a wider range of
 businesses and activities including businesses that are
                                                                                                 39%
 tied to industrial processes, such as design, research,
               and development activities

          Fishing fleet, boatyards, marine trades uses                                          37%

      Heavy industrial uses including high-impact
     businesses, such as metal fabrication, smelters,                       18%
   quarries, chemical and petroleum product facilities

      Industrial service and repair uses, such as metal
                                                                       12%
               fabricators and machine shops

                       Other land uses (please specify)               12%

                                        None of the above             2%

                                                                 0%        10%    20%       30%        40%      50%    60%

         Themes of open-ended responses to “Other land uses (please specify)”:
                                        0                   5                    10                   15              20

                 Recreation, tourism                                                       13
                         Tribal use                                                   12
           Environmental restoration                                                  12
                            Housing                    4
                      Water access                 3
            Retail, bars, restaurants              3
          Transportation connections           2
                              Other                                                                        17
Source: BERK, 2021.
Exhibit 23. Survey Respondents’ Preferred Complementary Land Uses in the Tideflats (602
responses)
Survey Question: “While the Tideflats will continue to be a regional center for
manufacturing and industrial uses, there may be opportunities for new uses in a few
limited locations. What types of complementary uses do you think would be
appropriate? Please select your top three. Note: The options below are for visioning
purposes only and have not been evaluated for feasibility.”
Cultural, educational, and maritime heritage
36%
facilities
Small-scale manufacturing spaces for fabrication or
35%
production
Shoreline public access and recreation facilities 35%
Active transportation uses such as biking or walking
31%
trails
Marina uses 26%
Incubator spaces for production-related startups 23%
Small amount of affordable workforce housing,
targeted to employees in industrial sectors and tribal 19%
members
Office uses, like governmental facilities, nonprofits,
18%
or university research facilities
Small, affordable space for creative businesses and
17%
arts
Live/work spaces which combine smaller production
13%
activities with housing
Small retail spaces 9%
Other uses (please specify) 6%
None of the above 3%
0% 10% 20% 30% 40%
Themes of open-ended responses to “Other uses (please specify)”:
0 2 4 6 8
Habitat and restoration uses 7
Tribal history and culture 5
Lack of fossil fuels or production of green energy 5
International trade/port-related 3
Direct transportation connections to nearby areas 2
Other 4
Source: BERK, 2021.31
Economic Development
Exhibit 24 summarizes respondents’ preferred economic development supports in the Tideflats.
With respondents selecting their top three options, environmental remediation was the most
frequently selected response (58%), followed by investments in infrastructure to expand port
facilities (45%) and investments in transportation improvements (37%).
Exhibit 24. Survey Respondents’ Preferred Economic Development Supports in the Tideflats
(602 responses)
Survey Question: “What support for future economic development would you like to
see for the Tideflats? Please select your top three. Note: The options below are for
visioning purposes only and have not been evaluated for feasibility.”
Environmental remediation 58%
Investments in infrastructure to expand port activities 45%
Investments in transportation improvements 37%
Education and training for industrial jobs 32%
Better transit access to Tacoma and the rest of the
32%
region
Support for small businesses 27%
Utility improvements to meet development capacity 27%
Other strategies (please specify) 7%
None of the above 0%
0% 10% 20% 30% 40% 50% 60%
Themes of open-ended responses to “Other strategies (please specify)”:
0 2 4 6 8
Environmentally sustainable industries 7
Uses that respond to Tribal history and needs 6
Recreation 5
Shifting away from fossil fuels 5
Recreation and housing 2
Investments in green infrastructure 2
Other 3
Source: BERK, 2021.Transportation
Exhibit 25 summarizes respondents’ primary travel purpose in the Tideflats. The majority of
respondents (61%) indicated that they only travel through the Tideflats as part of a longer trip.
This was followed by 37% of respondents who travel through the area to access schools and
neighborhood services, 34% who work in the Tideflats, and 33% who travel to the Tideflats for
recreation.
Exhibit 26. Survey Respondents’ Primary Travel Purposes in the Tideflats (602 responses)
Survey Question: “When you travel to, from, or through the Tideflats, what are the
most common purposes for your trips? Please select your top three.”
Traveling through area as part of a longer trip 61%
Traveling through the area to access schools, or other
37%
neighborhood services
Working in the Tideflats 34%
Recreation 33%
Delivering or picking up goods at a business or
27%
terminal in the Tideflats
Other trip purpose (please specify) 14%
None of the above 4%
0% 10% 20% 30% 40% 50% 60%
Themes of open-ended responses to “Other trip purposes (please specify)”:
0 5 10 15
Shortcut, alternative route 13
Volunteering, protesting, environmental
8
remediation
Accessing businesses and services in the Tideflats 7
Participating in Tribal activities 5
I do not travel in the Tideflats 4
Accessing the marina 3
Source: BERK, 2021.33
Exhibit 27 summarizes respondents’ primary transportation concerns. More than half of
respondents identified traffic congestion and backups as their primary concern, followed by train
and truck safety, limited walking options, and limited bridge access across the Puyallup River and
other waterways.
Exhibit 28. Survey Respondents’ Transportation Concerns in the Tideflats (602 responses)
Survey Question: “What are your biggest transportation concerns when traveling to,
from, or through the Tideflats? Please select your top three.”
Traffic congestion or backups 52%
Safety concerns with trains and trucks 32%
Limited options for walking 26%
Limited bridges across Puyallup River or other
26%
waterways
Lack of truck staging or queuing areas 22%
Vehicle access to Interstate 5 22%
Limited options for biking 20%
Rail crossings that add unexpected delay 17%
Travel through the Tideflats 14%
Emergency access to the Tideflats 12%
Posted speed of certain roads 3%
Other challenges (please specify) 10%
No challenges: the system works great. 4%
0% 10% 20% 30% 40% 50%
Themes of open-ended responses to “Other challenges (please specify)”:
0 5 10 15 20
Climate change, emissions, greenhouse gases 17
Road conditions 9
Homelessness, homeless supports 4
Transit options 3
Land slides, flooding 2
Pedestrian safety 2
Personal safety 2
Emergency egress 2
Other 10
Source: BERK, 2021.Exhibit 29 summarizes respondents’ suggested transportation improvements in the Tideflats. The
most common selected responses were adding more biking, transit, and walking options. This was
followed by a desire to separate car and truck traffic (whether by adding dedicated truck lanes,
truck routes, or overpasses), improving the road conditions throughout the Tideflats, and increasing
vehicle and truck access to I-5. Other popular suggestions included increasing bridge access—
especially the 11th St Bridge—and reducing congestion.
Exhibit 30. Survey Respondents’ Suggested Transportation Improvements (499 responses)
Survey Question: “If you were a transportation planner, what revisions would you
make to the transportation system in the Tideflats?”
0 20 40 60 80 100
Add biking options 70
Add transit options 65
Add walking options 65
Separate truck and car traffic 57
Road improvements, maintenance 45
Increase I-5 access 41
Increase 11th St Bridge access 35
Improve rail crossings 34
Address traffic congestion 31
Increase bridge access 31
Address climate change, emissions, GHG 20
Increase 167 access 19
Improve travel through Tideflats 19
Add recreation, signage for existing areas 19
Safety for pedestrians, cyclists 18
Additional or improved signage 18
Increase 509 access 17
Add truck staging, queuing areas 17
Construct overpasses 17
Prioritize moving cargo (truck and rail) 14
Employee access to transit, roadways 13
Widen roads 12
Improve signalization 11
Restore natural habitat 11
Increase driver safety 10
Minimize truck traffic 10
Improve emergency egress 8
Improve emergency access 5
Reduce speed limits 5
Other 92
Source: BERK, 2021.35
Natural Resources
Exhibit 31 summarizes respondents’ preferred environmental mitigation in the Tideflats. In order
to protect the natural environment and reduce potential impacts, providing more cleanup of
contaminated areas and providing more protection for salmon, shellfish, and marine life were the
most frequently selected responses.
Exhibit 31. Survey Respondents’ Preferred Environmental Mitigation (602 responses)
Survey Question: “What actions do you think should be prioritized to protect the natural
environment and reduce potential impacts? Please select your top three. Note: The options
below are for visioning purposes only and have not been evaluated for feasibility.”
Provide more cleanup of contaminated areas 52%
Provide more protection and enhancement of
39%
salmon, shellfish, and marine life
Put in place green industrial development standards
to promote sustainability and reduce greenhouse 31%
gas emissions
Provide more shoreline/habitat restoration and
31%
enhancement
Provide structural improvements (e.g., a sea wall or
raised streets) to protect the Tideflats from flooding 20%
due to sea level rise
Create healthier near-shore habitat by promoting
19%
soft shore armoring*
Stormwater management 19%
Provide more recreational opportunities (e.g.,
16%
fishing, clamming, walking, birding)
Expand tree canopy in the right of way 14%
Proactive relocation due to sea level rise** 10%
Provide more connection between existing
9%
restoration sites/open space/and recreation sites
Other actions (please specify) 5%
No additional actions needed*** 7%
0% 10% 20% 30% 40% 50%
Themes of open-ended responses to “Other actions (please specify)”:
0 2 4 6 8
Shift away from fossil fuels 6
All survey options 5
Relocate people experiencing homelessness from the area 3
Other 7
* Original survey text (shortened in chart): “Create healthier near-shore habitat by promoting soft shore armoring (the creation or restoration
of a natural shoreline system using nature-based shoreline management techniques instead of harder armoring like bulkheads).”
** Original survey text: “Conduct a coordinated process of voluntarily and equitably relocating people, structures, and
infrastructure away from vulnerable areas to protect the Tideflats from flooding due to sea level rise.”
*** Original survey text: "No additional actions needed: existing local, state and federal programs and regulations are adequate
to protect the environment and public health."
Source: BERK, 2021.Exhibit 32 summarizes survey respondents’ level of interest in marine life in the Tideflats. Overall,
there is a high level of interest: 66% of respondents indicated that they were very interested,
21% were somewhat interested, 9% were neutral, 3% were somewhat not interested, and only
1% were not interested at all.
Exhibit 32. Survey Respondents’ Level of Interest in Tideflats Marine Life (602 responses)
Survey Question: “What is your level of interest in protecting salmon, shellfish, and
other marine life in the Tideflats?”
Not interested at all, 1%
Somewhat not interested, 3% Very interested, 66%
Neutral, 9%
Somewhat interested, 21%
Source: BERK, 2021.
Exhibit 33 summarizes survey respondents’ values about natural resources. With respondents
selecting their top three values, 64% of respondents selected the fact that the Tideflats protects
natural resources as what they valued most; this was the highest response by a notable margin.37
Exhibit 33. Survey Respondents’ Values about Natural Resources in the Tideflats (602
responses)
Survey Question: “What do you value about the natural resource areas in the
Tideflats? Please select your top three.”
Protects natural resources 64%
Serves cultural purposes 39%
Provides recreational opportunities (e.g., fishing,
38%
clamming, walking, birding)
Provides fisheries industry jobs and traditional
38%
subsistence living
Provides public water access 35%
Provides open space 28%
Other aspects (please specify) 6%
None of the above 5%
0% 10% 20% 30% 40% 50% 60% 70%
Themes of open-ended responses to “Other aspects (please specify)”
0 5 10 15
Provides economic opportunity 11
Improves human health 3
Provides habitat for plants and local wildlife 3
Don't Know 3
Restore area, improve watershed health 2
Other 8
Source: BERK, 2021.
Concluding Comments
Exhibit 34 summarizes additional comments survey respondents provided about the Tideflats
Subarea Plan. 47 people mentioned balancing living wage jobs with environmental health. 46
people noted improving the health and sustainability of the area. 45 people said that port and
industrial jobs are very important.Exhibit 34. Survey Respondents’ General Suggestions (235 responses)
Survey Question: “Please share any additional comments you have on the Tideflats
Subarea Plan. You may also share comments about specific locations or features of
the Tideflats on the map tab.”
0 10 20 30 40 50
Balance living wage jobs and environmental health 47
Improve health and sustainability of the area 46
Port and industrial jobs are very important 45
Shift away from fossil fuels 25
Address tribal needs and priorities 23
Plan for climate change 13
Improve marine, rail, and truck transportation 11
Clean up contaminated areas 11
Make shoreline areas more accessible and lively 9
Improve air quality 6
Improvements to green infrastructure like shore power 6
Collaborate for mutual benefit 5
Address homelessness 4
Increase access to transit 4
Process concern 3
Support existing businesses 2
Other 22
Source: BERK, 2021.39
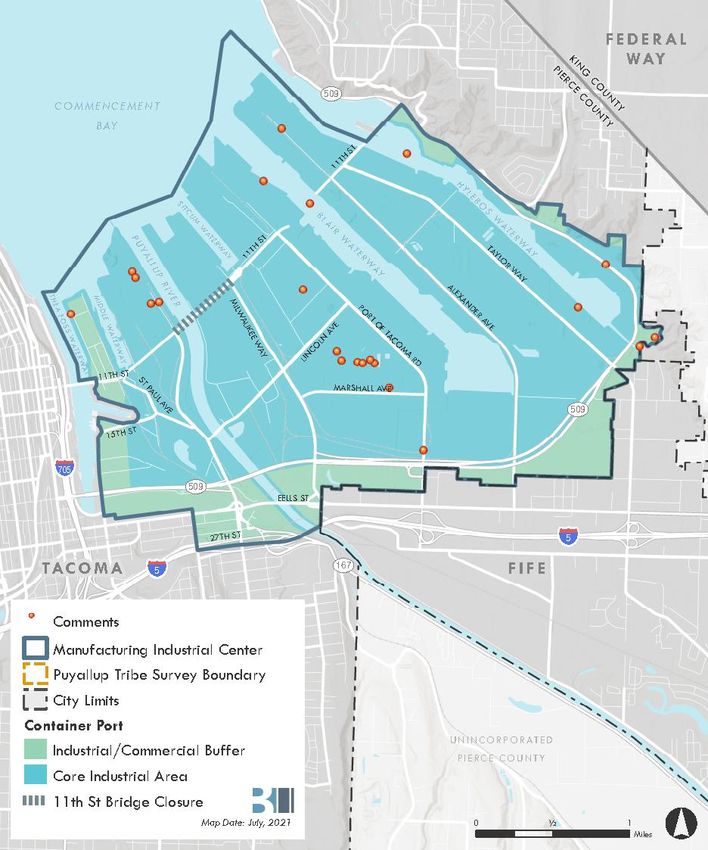
Exhibit 35. Location and Theme of Comments on the Story Map (21 responses)
Prompt: “What other comments do you want to share with the project team? Drop a
pin on this map and give us your thoughts and visions for Tideflats.”
Themes of map comments:
0 5 10
Continue industrial and maritime zoning and activities 9
Encourage environmentally sustainable activities 8
Continue environmental cleanup 3
Improve transportation 2
Other 3
Source: BERK, 2021.Meeting Findings
Vision
Respondents at several meetings were asked to provide input on their vision for the Tideflats. As
Exhibit 36 shows, the most common responses focused on sustainable business, green energy, and
climate change, and the environment, water quality, and natural resources. Respondents also
noted an interest in improved transportation, transit, and infrastructure, cooperation among
businesses and governments, and increased recreation opportunities, public access, and ease of
use for pedestrians.
Exhibit 36. Themes of Input: Vision for the Tideflats (93 responses)
0 5 10 15 20 25 30 35
Sustainable business, green energy, climate change 35
Environment, water quality, natural resources 25
Transportation, transit, infrastructure 15
Cooperation 14
Recreation, public access, pedestrians 14
Port of Tacoma, industry, working waterfront 13
Natural resources 12
Community, people, human-scale 11
Jobs, workers 10
Improved public perception 6
Puyallup Tribe of Indians 5
Art, culture 2
Other 16
Source: BERK, 2021.
Example comments for the themes in Exhibit 36, many of which are also reflected throughout the
remainder of this section, are shown in Exhibit 37.
40Exhibit 37.
Theme Sample Comments
Sustainable “Primary change has to do with climate change. That’s the challenge – industrial symbiosis,
business, green public access or green power. It needs to be apparent in part to connect with the public
energy, climate perception. It needs to be visible. If it is not apparent it can reflect poorly on the port and
change cause political problems.”
“Tacoma is the first port in the World to successfully navigate the transition from fossil fuels to
renewable energy and still have a strong economic base.”
Environment, “a lot of restoration has happened. there is habitat for species like salmon can thirive, where
water quality, people can thrive and where the tribe can continue to live. Where Tacoma is the place where
natural resources the innovative industry of the future can be.”
“Waters have never been cleaner because of foresight of prior generations. Shoreline is
walkable, fewer cars, more people on foot and transit.”
Transportation, “Transportation infrastructure needs to change. Might need partnership with state and federal
transit, resources.”
infrastructure “20 years from now we have infrastructure that leans into restoration with jobs to better
connect community around being stewards to this land.”
“Improving the efficiency of the infrastructure and improve the environment. Port has a major
role to play as one of the largest investors in cleaning up contaminated areas.”
Cooperation “Port coexists with residential and urban area surrounding.”
“there is an impression that there is a challenge in all coexisting. I absolutely believe that they
all can. I see complementary and consistency in the vision statement presented.”
Recreation, “Recreational areas and bike paths should have educational components too, and should be
public access, accessible and enjoyable for port workers”
pedestrians “more habitat and water access”
“Still thriving area of opportunity and jobs, with more transit and more park/open space
areas”
Port of Tacoma, “Port is the premier port on the West Coast. A place of technological innovators. People
industry, working choose Tacoma over Vancouver, Los Angeles.”
waterfront “Affirm place. Permanently protect industrial uses which are inextricably linked to
environmental uses. Acknowledge and respect the Tideflats first and foremost as a place for
economic prosperity and environmental stewardship.”
Natural “Hopefully in 20 years it will be cleaner water, more fish upstream, enjoy what is down there.
resources Nothing could be better being on the water in the Fall and do some fishing. Drop a pot or two
for crab. I would like to do that again and actually catch something. I’m dreaming a lot here
but I am hoping we can strive for that.”
“I see lots of eagles coming back though that is positive. They keep greeting us so that means
things are getting better maybe.”
“Protections for Salmon”
AUGUST 10, 2021| TIDEFLATS SUBAREA PLAN 41Theme Sample Comments
Community, “A lot more activity at the human scale, can support a lot more industrial strength.”
people, human- “Larger restoration efforts that is beyond tree planting and gives people the real scientific
scale knowledge to allow them to better be stewards and understand where they are in the larger
narrative.”
Jobs, workers “Vision is for the creation of equitable jobs for people with high-school degrees. Pierce County
has a large need for these types of jobs.”
“Prioritize and employment and manufacturing jobs, which is one of the most racially and
ethnically diverse fields.”
“We need to plan for jobs, just like how the military prepares people for civilian life, we need
to mobilize in a similar manner. Prep folks to finish their schooling or go into Environmental
work.”
Improved public “An area we can be proud of”
perception “All of our cargo handling and cranes are electrified using green power, beautification so
Milwaukee Way doesn’t look like a homeless encampment,we have integrated the Saltchuck
habitat site, embedded the most innovative tech to manage runoff, trucks move smoothly with
fuels that don’t have particulate matter that disturb lungs. We will still see some things, some
of the port infrasturture, we would still see vessels sliding in and out. From another lens, we
have changed the public’s perception and we make Tacoma, Fife and south end great places
to live. So people say it’s my port.”
Puyallup Tribe of “a lot of restoration has happened. there is habitat for species like salmon can thirive, where
Indians people can thrive and where the tribe can continue to live. Where Tacoma is the place where
the innovative industry of the future can be.”
Art, culture “Tidelfats is a continued hub of commerce, with an eye on bridges to continued sustainability,
fewer dilapidated properties, cultural/educational center to highlight collaboration and
history – could be a core piece of the Tideflats”
“Blending the lines between industry and community, trails and green areas, more blatant
cultural representation through art work, cultural center.”
Source: BERK, 2021.
42You can also read