Supervised sequential pattern mining of event sequences in sport to identify important patterns of play: an application to rugby union
←
→
Page content transcription
If your browser does not render page correctly, please read the page content below
Supervised sequential pattern mining of event sequences in
                                                         sport to identify important patterns of play: an application
                                                         to rugby union
                                                         Rory Bunker1* , Keisuke Fujii1,2 , Hiroyuki Hanada1 , Ichiro Takeuchi1,3

                                                         1 RIKEN Center for Advanced Intelligence Project, Tokyo, Japan
                                                         2 Graduate School of Informatics, Nagoya University, Nagoya, Aichi, Japan
                                                         3 Department of Computer Science, Nagoya Institute of Technology, Nagoya, Aichi,
arXiv:2010.15377v2 [cs.LG] 25 Feb 2021

                                                         Japan

                                                         * Corresponding author
                                                         Email: rorybunker@gmail.com

                                                         Abstract
                                                         Given a set of sequences comprised of time-ordered events, sequential pattern mining is
                                                         useful to identify frequent subsequences from different sequences or within the same
                                                         sequence. However, in sport, these techniques cannot determine the importance of
                                                         particular patterns of play to good or bad outcomes, which is often of greater interest to
                                                         coaches and performance analysts. In this study, we apply a recently proposed
                                                         supervised sequential pattern mining algorithm called safe pattern pruning (SPP) to 490
                                                         labelled event sequences representing passages of play from one rugby team’s matches
                                                         from the 2018 Japan Top League. We compare the SPP-obtained patterns that are the
                                                         most discriminative between scoring and non-scoring outcomes from both the team’s
                                                         and opposition teams’ perspectives, with the most frequent patterns obtained with
                                                         well-known unsupervised sequential pattern mining algorithms when applied to subsets
                                                         of the original dataset, split on the label. Our obtained results found that linebreaks,
                                                         successful lineouts, regained kicks in play, repeated phase-breakdown play, and failed
                                                         exit plays by the opposition team were identified as as the patterns that discriminated
                                                         most between the team scoring and not scoring. Opposition team linebreaks, errors
                                                         made by the team, opposition team lineouts, and repeated phase-breakdown play by the
                                                         opposition team were identified as the patterns that discriminated most between the
                                                         opposition team scoring and not scoring. It was also found that, by virtue of its
                                                         supervised nature as well as its pruning and safe-screening properties, SPP obtained a
                                                         greater variety of generally more sophisticated patterns than the unsupervised models
                                                         that are likely to be of more utility to coaches and performance analysts.

                                                         Introduction
                                                         Large amounts of data are now being captured in sport as a result of the increased use
                                                         of GPS tracking and video analysis systems, as well as enhancements in computing
                                                         power and storage, and there is great interest in making use of this data for
                                                         performance analysis purposes. A wide variety of methods have been used in the
                                                         analysis of sports data, ranging from statistical methods to, more recently, machine
                                                         learning and data mining techniques.
                                                             Among the various analytical frameworks available in sports analytics, in this paper,
                                                         we adopt an approach to extract events from sports matches and analyze sequences of

                                     February 26, 2021                                                                                        1/18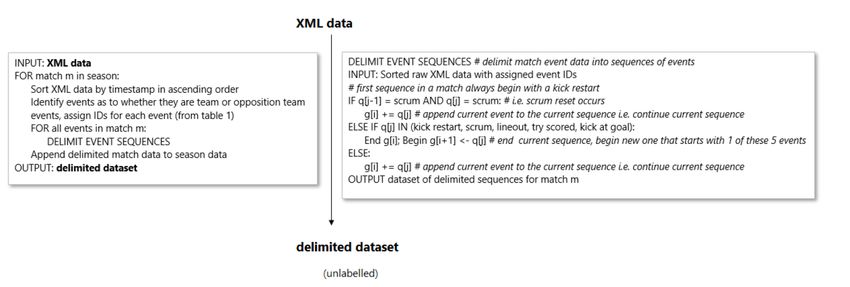
events. The most basic events-based approach is based on the analysis of the frequencies
                    of events. These frequencies can be used as performance indicators [1] by comparing the
                    frequency of each event in positive outcomes (winning, scoring points, etc.) and
                    negative outcomes (losing, conceding points, etc.) in order to investigate which events
                    are commonly associated with these outcomes. However, frequency-based analyses have
                    drawbacks in that the information contained in the order of events cannot be exploited.
                        In this study, we consider a sequence of events, and refer to a partial sequence of
                    events a sequential pattern or simply a pattern (of play). In sports, the occurrence of
                    certain events in a particular order often has a strong influence on outcomes, so it is
                    useful to use patterns as a basic analytical unit. Invasion sports such as rugby (as well
                    as soccer and basketball, for example) have many events and patterns that occur very
                    frequently while having a paucity of events that are important for scoring. For instance,
                    in soccer, a pattern consisting of an accurate cross followed by a header that is on target
                    will occur much less frequently than a pattern consisting of repeated passes between
                    players, but the former pattern is likely to be of much greater interest to coaches and
                    performance analysts because there is a good chance that the pattern may lead to a
                    goal being scored.
                        The computational framework for finding patterns from sequential data that have
                    specific characteristics is known as sequential mining in the field of data mining. The
                    most basic problem setup in sequential mining is to enumerate frequent patterns, which
                    is called frequent sequential mining. Although the total number of patterns (i.e., the
                    number of ordered sequences of all possible events) is generally very large, it is possible
                    to efficiently enumerate patterns that appear more than a certain frequency by making
                    effective use of branch-and-bound techniques. Frequent sequential mining is categorised
                    as an unsupervised learning technique in the terminology of machine learning.
                        When applying frequent sequential mining to data from sport, there are several
                    options. The first option is to simply extract the frequent patterns from the entire
                    dataset. The drawback of this approach is that it is not possible to distinguish whether
                    a pattern leads to good or bad outcomes. The second option is to split the dataset into
                    a “good-outcome” dataset and a “bad-outcome” dataset, and perform frequent
                    sequential mining on each dataset. The third option is to perform frequent sequential
                    mining on the entire dataset to identify frequent patterns, and then create a machine
                    learning model that uses the patterns as features to predict whether the outcomes are
                    good or bad. The disadvantage of the second and third options is that the process of
                    pattern extraction and the process of relating the patterns to the “goodness” of the
                    outcomes are conducted separately.
                        Unlike unsupervised mining, a mining method that directly extracts patterns that
                    are associated with good or bad outcomes is called supervised mining. Roughly
                    speaking, by using supervised mining, we can directly find patterns that have different
                    frequencies depending on the outcomes, thus we can find more direct effects on the
                    outcomes than by simply combining unsupervised mining, as described above.

                    Related Work
                    Sequential pattern mining
                    Sequential pattern mining [2] involves discovering frequent subsequences as patterns
                    from a database that consists of ordered event sequences, with or without strict notions
                    of time [3]. Originally applied for the analysis of biological sequences [4–7], sequential
                    pattern mining techniques have also been applied to various other domains including
                    XML document classification [8], keyword and key-phrase extraction [9–11], as well as
                    next item/activity prediction and recommendation systems [12–17]. For an overview of
                    the field of sequential pattern mining, we refer the reader to [18].

February 26, 2021                                                                                        2/18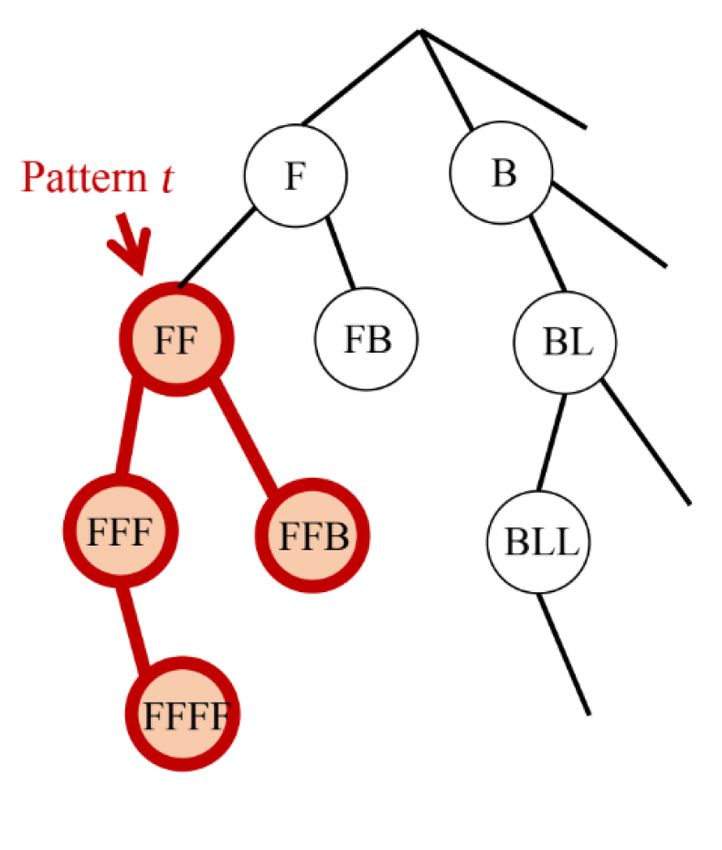
One of the first sequential pattern mining algorithms was GSP [19], which was based
                    on earlier work in which the A-priori algorithm was proposed by the same authors [20].
                    SPADE [21], SPAM [22], and the pattern-growth algorithm PrefixSpan [23] were
                    proposed to address some limitations that were identified with the GSP algorithm.
                    PrefixSpan is known as a pattern-growth algorithm, since its grows a tree which extends
                    from a singleton (set with a single event) and adds more events in descendent nodes.
                    More recently, CM-SPAM and CM-SPADE [24] as well as Fast [25] have been proposed
                    to provide further improvements in computational efficiency and therefore speed. It
                    should be noted that these frequently applied sequential mining algorithms listed above
                    are unsupervised, i.e., are applied to unlabelled sequence data.
                       Safe pattern pruning (SPP) was proposed by [26, 27], and combines a convex
                    optimisation technique called safe screening [28] with sequential pattern mining. SPP is
                    supervised and is applied to labelled data, i.e., to datasets consisting of labelled
                    sequences. SPP uses PrefixSpan as a building block to grow the initial pattern tree,
                    which is then pruned according to a particular criterion, which prunes the tree structure
                    among all possible patterns in a database, grown by PrefixSpan, in such a way that if a
                    node corresponding to a particular pattern is pruned, it is guaranteed that all patterns
                    corresponding to its descendant nodes are not required for the predictive model (Fig 1).

                    Fig 1. SPP pruning. One of the mechanisms within SPP identifies and deletes
                    patterns that do not contribute to the model before performing the optimization. For
                    example, if pattern t does not satisfy the SPP pruning criterion specified in [27], the
                    sub-tree below pattern pattern t is deleted.

                       All of the possible pruned patterns in the database are then multiplied by weights in
                    the form of a linear model, and these weights are solved for by solving an optimization
                    problem, however, prior to solving, safe screening is used to eliminate weights that will
                    not be discriminative (i.e., will have values of zero) at the optimal solution. SPP has
                    been applied to datasets consisting of animal trajectories [27]; however, compared with
                    animal trajectories, sports data often contains a greater diversity of events.

                    Application of sequential pattern mining techniques in sport
                    Unsupervised sequential pattern mining techniques have been applied to data from
                    sport, focusing primarily on the identification, interpretation and visualization of
                    sequential patterns. Table 1 summarizes previous studies that have applied sequential
                    pattern mining techniques to datasets in sport. CM-SPAM has been applied in order to
                    conduct technical tactical analysis in judo [29]. Sequential data, obtained using trackers,

February 26, 2021                                                                                        3/18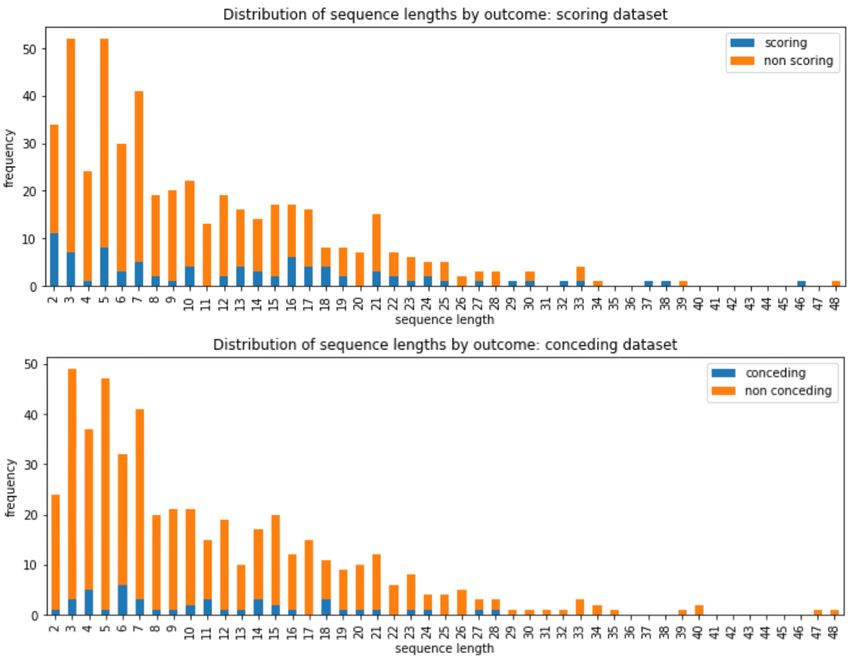
has been used to test for significant trends and interesting sequential patterns in the
                                  context of the training of a single cyclist over an extended period of time [30]. Decroos
                                  et al. [31] combined clustering and CM-SPADE to data from soccer, using a five-step
                                  approach, which is presented in Table 1. Their ranking function allowed the user, e.g., a
                                  coach, to assign higher weights to events that are of higher relevance, such as shots and
                                  crosses, compared to normal passes, which are very frequent but not necessarily relevant.

Table 1. Prior studies that have applied sequential pattern mining techniques in sport.
  Study       Sport     Model       Model Type        Summary of Approach                        Evaluation Metrics
                        Used
  Hrovat      Cycling   SPADE       Unsupervised      Applied the sequential pattern min-        Support, permutation
  (2015)                                              ing algorithm SPADE to identify fre-       test p-values
                                                      quent sequential patterns, calculated
                                                      interestingness measures (p-values)
                                                      for these frequent patterns, and vi-
                                                      sualized these patterns for increas-
                                                      ing/decreasing daily and duration
                                                      trends
  La Puma     Judo      CM-SPAM     Unsupervised      Identified patterns using sequential       Support
  & Giorno                                            pattern mining for the tactical analy-
  (2017)                                              sis of judo techniques
  Decroos     Soccer    CM-         Unsupervised      clustered phases based on spatio-          Support (weighted by
  (2018)                SPADE                         temporal components, ranked these          user’s judgement weight-
                                                      clusters, mined the clusters to identify   ing of the relevance of
                                                      frequent sequential patterns, used a       events), and identified
                                                      ranking function (a weighted support       the top-ranked frequent
                                                      function) - in which a coach can as-       sequences in the clusters
                                                      sign higher weights to more relevant
                                                      events - to score obtained patterns,
                                                      interpreted the obtained patterns

                                  Analysis of sequences in rugby union
                                  In the sport of rugby union (hereafter referred to simply as rugby) specifically, some
                                  previous studies have analyzed matches at the sequence level by analyzing the duration
                                  of sequences. For example, the duration of the sequences of plays leading to tries at the
                                  1995 Rugby World Cup (RWC) were studied by [32]. In a study of the 2003 RWC, [33]
                                  found that teams that were able to create movements that lasted longer than 80 seconds
                                  were more successful. More recently, [34] applied K-modes cluster analysis using
                                  sequences of play in rugby, and found that scrums, line-outs and kick receipts were
                                  common approaches that led to tries being scored in the 2018 Super Rugby season.
                                  Recently, [35] used convolutional and recurrent neural networks to predict the outcomes
                                  (territory gain, retaining possession, scoring a try, and conceding/being awarded a
                                  penalty) of sequences of play, based on event order and their on-field locations.

                                  Motivation and Contributions
                                  In this study, we apply SPP, a supervised sequential pattern mining model, to data
                                  consisting of event sequences from all of the matches played by a professional rugby
                                  union team in their 2018 Japan Top League season. The present study is motivated by
                                  the fact that, although sequential pattern mining techniques have been applied to sport,

February 26, 2021                                                                                                      4/18
only unsupervised models appear to have been used to date. In addition, no form of
sequential pattern mining technique, unsupervised or supervised, appears to have been
applied to the analysis of sequences of play in the sport of rugby union.
As a basis for comparison, we also compare the SPP-obtained subsequences with
those obtained by well-known unsupervised sequential pattern mining algorithms
(PrefixSpan, GSP, Fast, CM-SPADE and CM-SPAM) when they are applied to subsets
of the original labelled data, split on the label.
The main contributions of this study are in the comparison of the usefulness of
supervised and unsupervised sequential pattern mining models that are applied to event
sequence data in sport, the application of a supervised sequential pattern mining model
to event sequence data in sport, and the application of an sequential pattern mining
model for the analysis of sequences of play in rugby.
Notation
The number of unique event symbols is denoted as m and the set of those event symbols
is denoted as S := {s1 , . . . , sm }. In this paper, we refer to sequences and subsequences
as passages of play and patterns of play (or simply patterns), respectively. Let n denote
the number of sequences in the dataset (n=490 in our dataset). Sequences with the
labels 1 and -1 are denoted as G+ , G− ⊆ [n] and are of size n+ := |G+ |, n− := |G− |,
respectively. The dataset for building the SPP model is
{(gi , yi )}i∈[n] ,
where gi represents the i-th sequence/passage of play. Each sequence gi takes a label
from yi ∈ {±1} and can be written as
gi = hgi1 , gi2 , . . . , giT (i) i, i ∈ [n],
where git is the t-th symbol of the i-th sequence, which takes one of the event symbols
in S, and T (i) indicates the length of the i-th sequence, i.e., the number of events in
this particular sequence. Patterns of play are denoted as q1 , q2 , . . ., each of which is also
a sequence of event symbols:
qj = hqj1 , qj2 , . . . , qjL(j) i, j = 1, 2, . . . ,
where L(j) is the length of pattern qj for j = 1, 2, . . .. The relationship whereby
sequence gi contains subsequence qj is represented as qj v gi . The set of all possible
patterns contained in any sequence {gi }i∈[n] is denoted as Q = {qi }i∈[d] , where d is the
number of possible patterns (large in general).
Materials and Methods
Data
We obtained XML data generated from video tagged in Hudl Sportscode
(https://www.hudl.com/products/sportscode) by the performance analyst of one of
the teams in the Japan Top League competition (not named for reasons of
confidentiality). Written consent was obtained to use the data for research purposes.
Seasons are comprised of a number of matches, matches are made up of sequences of
play, which are, in turn, comprised of events. Our dataset consisted of all of this
particular team’s matches in their 2018 season against each of the opposition teams they
faced. These matches consist of passages of play (i.e., sequences of events), however,
each match in the original dataset were each one long sequence. One approach is to
February 26, 2021 5/18label as sequences with win/loss outcomes, however, in our initial trials, this did not
produce interesting results since it is obvious that sequences containing a greater
number of scoring events will be within match-sequences labelled with wins. Therefore,
we generated a dataset that is of greater granularity by defining rules that delimit
matches into sequences representing passages of play (we outline these in the following
subsection). The 24 unique events (12 unique events for the team and opposition
teams), in our data are listed in Table 2. The XML data also contained a more granular
level of data than these 24 events represent (i.e., with more detailed events—in other
words, a larger number of events); however, in order to reduce computational
complexity, the higher level of the data was considered.
Table 2. Unique events in the original XML data. Events prefixed by ”O-” are performed by the opposition team,
while those that are not a performed by the team.
event ID event event description
1 Restart Receptions Team receives a kick restart made by the opposition team
2 Phase Period between breakdowns (team in possession of the ball)
3 Breakdown Team player is tackled, resulting in a ruck
4 Kick in Play Kick within the field of play (rather than to touch) made by the team
5 Penalty Conceded Team gives away a penalty, opposition may re-gain possession
6 Kick at Goal Team attempts kick at goal
7 Quick Tap Quick restart of play by the team following a free kick awarded to them
8 Lineout Ball is thrown in by the team
9 Error Mistake made by the team, e.g., lost possession, forward pass, etc.
10 Scrum Set piece in which the forwards attempt to push the opposing team off the ball
11 Try Scored Team places the ball down over opposition team’s line (five points)
12 Line Breaks Team breaches the opposition team’s defensive line
13 O-Restart Receptions Opposition team receives a kick restart made by the team
14 O-Phase Period between breakdowns (opposition team in possession of the ball)
15 O-Breakdown Opposition player is tackled, resulting in a ruck
16 O-Kick in Play Kick within the field of play (rather than to touch) made by the opposition team
17 O-Penalty Conceded Opposition team gives away a penalty, team may re-gain possession
18 O-Kick at Goal Opposition team attempts kick at goal
19 O-Quick Tap Quick restart of play by the opposition team following a free kick awarded to them
20 O-Lineout Ball is thrown in by the opposition team
21 O-Error Mistake made by the opposition team, e.g., lost possession, forward pass, etc.
22 O-Scrum Set piece in which the forwards attempt to push the team off the ball
23 O-Try Scored Opposition team places the ball down over the team’s line (five points)
24 O-Line Breaks Opposition team breaches the team’s defensive line
Methods
Delimiting matches into sequences
Our dataset was converted into labelled event sequences by delimiting each match into
passages of play (Fig 2) The rules to delimit matches into sequences of events (passages
of play), should ideally begin and end at logical points in the match, e.g., when certain
events occur, when play stops or when possession changes (e.g., [36]), and should result
in sequences which are neither overly long nor overly short. In this study, a passage of
play was defined to start with either a kick restart, scrum, or lineout, which are events
that result in play temporarily stopping and therefore represent natural delimiters for
our dataset. When there is a kick restart, scrum (except for a scrum reset where a
February 26, 2021 6/18scrum follows another scrum), or lineout, this event becomes the first event in a new
event sequence; otherwise, if a try is scored or a kick at goal occurs, a new passage of
play also begins. Applying these rules (also shown in Fig 2) resulted in delimited
dataset consisted of 490 sequences. Each of these sequences were made up of events
from Table 2. At this stage, the delimited dataset is unlabelled, with the scoring events
(try scored, kick at goal) for the team and opposition teams contained in the sequences.
Fig 2. Illustration of the procedure to delimit the raw XML data into labelled sequences of events.
Experimental dataset creation and comparative approach
The delimited dataset described was then divided into two datasets. In the first, which
we call the scoring dataset, we consider the case where the sequences are from the team’s
scoring perspective. In this dataset, the label yi = +1 represents points being scored or
attempted. Note that while a try scored was certain in terms of points being scored, a
kick at goal is not always successful. In our data, only the kick at goal being attempted
(event id 6) was available—not whether the goal was actually successful or not. However,
since it is more important to be able to identify points-scoring opportunities than
whether or not the kick was ultimately successful (which is determined by the accuracy
of the goal kicker), we assume that 100% of kicks at goal resulted in points being scored.
In the scoring dataset, the label yi = +1 was assigned assigned to the sequences from
the original delimited dataset if a try was scored or a kick at goal was made by the
team in sequence i. If there was no try scored and no kick at goal made by the team in
sequence i, the label yi = −1 was assigned. Then, since the label now identifies
scoring/not scoring, the events that relate to the team scoring—Try scored (event ID =
11) and Kick at goal (event ID = 6)—were removed from the event sequences.
In the second, which we call the conceding dataset, we consider the case where the
sequences are from the team’s conceding perspective, or equivalently, from the
opposition teams’ scoring perspective. In the conceding dataset, the label yi = +1 was
assigned to the sequences from the original delimited dataset if a try was scored or a
kick at goal was made by the opposition team in sequence i. If there was no try scored
and no kick at goal made by the opposition team in sequence i, the label yi = −1 was
assigned. The list of events for the original delimited, scoring and conceding datasets
are presented in Table 3. Then, since the label now identifies scoring/not scoring, the
February 26, 2021 7/18events that relate to the opposition team scoring—Try scored (event ID = 11) and Kick
at goal (event ID = 6)—were removed from the event sequences.
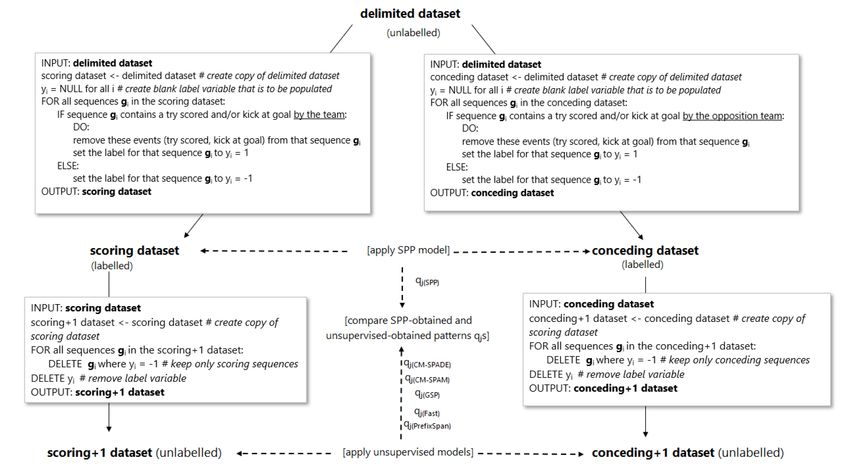
The process applied to create the scoring and conceding datasets from the original
delimited dataset is shown in the upper half of Fig 3.
Table 3. Event lists for the original, scoring and conceding datasets.
event ID original scoring conceding
1 Restart Receptions Restart Receptions Restart Receptions
2 Phase Phase Phase
3 Breakdown Breakdown Breakdown
4 Kick in Play Kick in Play Kick in Play
5 Penalty Conceded Penalty Conceded Penalty Conceded
6 Kick at Goal Kick at Goal
7 Quick Tap Quick Tap Quick Tap
8 Lineout Lineout Lineout
9 Error Error Error
10 Scrum Scrum Scrum
11 Try Scored Try Scored
12 Line Breaks Line Breaks Line Breaks
13 O-Restart Receptions O-Restart Receptions O-Restart Receptions
14 O-Phase O-Phase O-Phase
15 O-Breakdown O-Breakdown O-Breakdown
16 O-Kick in Play O-Kick in Play O-Kick in Play
17 O-Penalty Conceded O-Penalty Conceded O-Penalty Conceded
18 O-Kick at Goal O-Kick at Goal
19 O-Quick Tap O-Quick Tap O-Quick Tap
20 O-Lineout O-Lineout O-Lineout
21 O-Error O-Error O-Error
22 O-Scrum O-Scrum O-Scrum
23 O-Try Scored O-Try Scored
24 O-Line Breaks O-Line Breaks O-Line Breaks
label - Points Scored O-Points Scored
n=490 n+ =86, n− =404 n+ =44, n− =446
The SPP algorithm (software is available at
https://github.com/takeuchi-lab/SafePatternPruning) was applied to the
scoring and conceding datasets.
As a basis for comparison, we compare the obtained subsequences (qj s) from SPP
with those obtained by the unsupervised algorithms: PrefixSpan, CM-SPAM,
CM-SPADE, GSP and Fast. The SPMF pattern mining package [37] (v2.42c) was used
for the application of the five unsupervised sequential pattern mining algorithms to our
dataset. Since the unsupervised models use unlabelled data, while support values of the
patterns of play can be obtained, we cannot obtain weights for the patterns. For a more
fair comparison between the unsupervised models and the supervised model, SPP, we
assume prior knowledge of the sequence labels to apply the unsupervised models. Thus,
the unsupervised models were applied to the dataset, which we call “scoring+1,”
containing the sequences where the team actually scored, and to the “conceding+1”
dataset, containing the sequences where the team actually conceded points (i.e., the
opposition team scored points).
The dataset creation process and comparative approach is presented in Fig 3.
February 26, 2021 8/18Fig 3. Illustration of dataset creation and experimental approach. Illustration of the procedures to create the
datasets from the original delimited dataset to be used in the experiments and to compare the unsupervised and supervised
sequential pattern mining models.
Obtaining pattern weights with safe pattern pruning
As mentioned, our data consists of sequences comprised of events from Table 2, which
are labelled with an outcome: either +1 or -1, e.g.
-1 22 22 17
1 8 11 2 6
-1 1 2 3 2 9
-1 20 21
-1 10 10 2 3 2 3 2 3 2 3 2 17
1 8 11 2 6
-1 1 2 3 2 3 9
-1 22 16 2
-1 13 14 16
...
We are interested in using SPP to identify subsequences of events that discriminate
between outcome +1 and outcome -1. For instance, in the dataset above, it would seem
that subsequence [2,3,2] is potentially a discriminative pattern, since it appears in three
sequences that are labeled with -1 and none that are labeled with 1, while [11,2,6] is
also potentially a discriminative pattern since it appears in two sequences with label 1
and none with -1. SPP involves taking linear combinations of the subsequences with
weights, e.g., w1 [2,3,2] + w2 [11,2,6]..., for each sequence, and then to use an
February 26, 2021 9/18optimization model to calculate these weights. Discriminative patterns have positive
absolute values at the optimal solution.
A classifier based on a sparse linear combinations of patterns can be written as
X
f (gi ; Q) = wj I(qj v gi ) + b, (1)
qj ∈Q
where I(·) is an indicator function that takes the value 1 if sequence gi contains
subsequence gi and 0 other otherwise; and wj ∈ R and b ∈ R are parameters of the
linear model, which are estimated by solving the following minimisation problem (as
well as its dual maximization problem; see [27] for details of the pruning criterion):
X
min `(yi , f (gi ; Q)) + λkwk1 , (2)
w,b
i∈[n]
where w = [w1 , . . . , wd ]> is a vector of weights, ` is a loss function and λ > 0 is a
regularization parameter that can be tuned by cross-validation. Note that, due to the
permutations in terms of the number of potential patterns of play, the size of Q is quite
large in general. The goal of SPP is to reduce the size of Q by removing unnecessary
patterns from the entire pattern-tree that was grown by PrefixSpan according to the
SPP pruning criterion [27]. The minimization problem (1) was, in the present study,
solved with an L1-regularised L2-Support Vector Machine (the default option -u 1 in
the S3P classifier command line options
https://github.com/takeuchi-lab/S3P-classifier), with 10-times-10
cross-validation used to tune the regularization parameter lambda (options -c 1 -M 1 in
the S3P classifier command line options). The maximum pattern length parameter
(option -L in the S3P classifier command line options) was set to 20. The feature vector
xi = [xi1 , xi2 , . . . , xid ] is defined for the ith sequence gi as
xij = I(qj v gi ), j = 1, . . . , |Q|. (3)
In other words, the feature vectors xi = [I(q1 v gi ), I(q2 v gi ), . . . , I(qd v gi )] are
binary variables that take the respective values 1 or 0 based on whether or not
subsequence qj is contained within sequence gi . The squared hinge-loss function
`(y, f (xi )) = max{0, 1 − yf (xi )}2 is used for a two-class problem like ours, in which
case the optimization problem (2) becomes:
X 2
max 0, 1 − yi (w> xi + b) + λkwk1 ,
min (4)
w,b
i∈[n]
Discriminative patterns are those that have positive weights (in absolute terms) in the
optimal solution to (4) (in SPP, some weights are removed prior to solving the
optimization problem by using safe screening—see S2 Appendix for more details).
In this study, in order to exclude patterns that may have occurred merely by chance,
the obtained patterns (qj s) for all datasets with support of less than five were removed.
In the case of the patterns obtained by the unsupervised model, the top five patterns
with the largest support values were recorded. In the case of the SPP-obtained patterns,
the top five patterns with the largest positive wj values were recorded. In addition, we
restricted our analysis to patterns of play that had the highest positive weights. For the
scoring dataset, this means the patterns that had a positive contribution to the team
scoring. For the conceding dataset, this means the patterns that had a positive
contribution to opposition teams scoring. In other words, for the sake of brevity, we did
not consider the patterns that had the highest contribution to “not scoring” and “not
conceding.” The obtained results are presented in the following section.
February 26, 2021 10/18Results
Analysis of sequence lengths
There were an average of 10.6 events in each sequence in the scoring dataset, and 10.8
events in the conceding dataset. The shortest sequence contained two events, and the
longest contained 48 events (Table 4). The slight differences in mean sequence lengths
between the scoring and conceding datasets is a result of the removal of the try and kick
at goal events from the sequences in order to create the sequence outcome label (as
mentioned in the Materials and Methods section above). The sequence length
distributions are positively skewed and non-normal (Fig 4), which was confirmed by
Shapiro-Wilk tests. By comparing these distributions, it is clear that the number of
sequences in which points were scored was higher in the scoring dataset than the
conceding dataset, which is reflective of the strength of the team in the 2018 season.
From the team’s scoring perspective, 86 out of the 490 passages of play (18%) resulted
in points being scored by the team, while from the team’s conceding perspective, 44 out
of the 490 passages of play (9%) resulted in points conceded. The sequences in which
the team scored points were slightly longer, containing 12.8 events on average compared
to those where the team didn’t score, which contained 10.2 events, on average. The
sequences in which the team conceded points contained 11.2 events on average, while
those where the team didn’t concede points contained 10.8 events, on average.
Fig 4. Sequence length distributions. Distribution of sequence lengths by
points-scoring outcome for the scoring and conceding datasets. Sequence length is
defined as the number of events in each sequence (excluding the outcome label).
February 26, 2021 11/18Table 4. Descriptive statistics for the scoring and conceding datasets
scoring conceding
Mean 10.6 10.8
Standard deviation 7.8 7.9
Minimum 2 2
25th percentile 5 5
Median 8 8
75th percentile 15 15
Maximum 48 48
Skewness 1.3 1.4
Identification of important patterns of play using SPP
SPP initially obtained 93 patterns when applied to the scoring dataset, of which 75 had
support of 5 or higher. Out of these 75 patterns of play, 38 had a positive weight
(wj > 0). The 75 patterns with minimum support of 5 contained an average of 4.5
events, and the 38 patterns with positive weights contained an average of 5.4 events.
The longest obtained pattern in the scoring dataset contained 16 events.
Applying SPP to the conceding dataset resulted in a total of 72 patterns, of which 51
had support of 5 or higher. Out of these 51 patterns of play, 31 had a positive weight
(wj > 0). The 51 patterns with minimum support of 5 contained an average of 3.8
events, and the 31 patterns with positive weights contained an average of 4.4 events.
The longest obtained pattern in the conceding dataset contained 15 events.
The five most discriminative patterns between scoring and non-scoring outcomes
(i.e., patterns with the highest positive weight contributions) were obtained by applying
SPP to the scoring dataset, and are listed along with their weight values and odds ratios
in Table 5. In the results tables, the notation [p] x n, denotes that pattern p is repeated
n times. We include the odds ratio (OR) for these patterns (simply the exponential of
the weight), which aids in interpretation by providing a value that compares the cases
where a sequence contains a particular pattern, and when it does not.
The pattern in the scoring dataset with the highest weight value (0.919), which
discriminated the most between scoring and non-scoring sequences, was a pattern with a
single line break event (event id 12). The OR for the linebreak pattern is
exp(0.919)=2.506, meaning that the team is 2.5 times more likely to score when a line
break occurs in a sequence of play than if a line break is not made in a sequence of play.
Line breaks, which involve breaking through an opposition team’s line of defense,
advance the attacking team forward and are thus expected to create possible scoring
opportunities. A lineout followed by phase play (8 2) was the second most
discriminative pattern between scoring and not scoring, with a weight of 0.808 and an
OR of 2.242, indicating that the team is 2.2 times more likely to score when a lineout
followed by a phase occurs in a sequence of play than if it does not. The third most
discriminative pattern, 2 3 4 2 3 (w=0.796, OR=2.217), can be interpreted as a kick in
play being made by the team and being re-gathered by the team, thus resulting in
retained possession. This indicates that the team is 2.2 times more likely to score when
this pattern occurs in a sequence of play than if it does not. The fourth most
discriminative pattern, 2 3 2 3 2 3 2 3 4 (w=0.732, OR=2.079), represents four repeated
phase-breakdown plays by the team, followed by the team making a kick in play, which
indicates repeated retaining of possession before presumably gaining territory in the
form of a kick. This indicates that the team is 2.1 times more likely to score when this
pattern occurs in a sequence of play than if it does not. The fifth most discriminative
February 26, 2021 12/18pattern, 13 14 15 14 15 16 14 2 3 (w=0.710, OR=2.033), can be interpreted as the
opposition team receiving a kick restart made by the team, attempting to exit their own
territory via a kick but not finding touch, thus giving the ball back to the team from
which they can potentially build phases and launch an attack. This indicates that the
team is twice as likely to score when this pattern occurs in a sequence of play than if it
does not.
Table 5. Top five most discriminative SPP-obtained patterns between scoring and non-scoring outcomes.
pattern (qj ) pattern description support weight OR
12 linebreak 77 0.919 2.506
82 lineout, phase 71 0.808 2.242
23423 phase, breakdown, kick in play, phase, breakdown 9 0.796 2.217
232323234 [phase, breakdown]x4, kick in play 9 0.732 2.079
13 14 15 14 15 16 14 2 3 O-restart received, [O-phase, O-breakdown]x2, O-kick in play, 6 0.710 2.033
phase, breakdown
The five most discriminative patterns between conceding and non-conceding
outcomes (i.e., patterns with the highest positive weights) were obtained by applying
SPP to the conceding dataset, and are listed along with their weight values and odds
ratios in Table 6. A linebreak (event ID 24) (w=0.613, OR=1.846) being made by the
opposition team was the most discriminative pattern between sequences in which the
team conceded and did not concede, or in other words, a linebreak by the opposition
team was the pattern that discriminated the most between the group of sequences in
which the opposition team scored and the group of sequences in which the opposition
team did not score. The weight magnitude was not as large as for the team scoring from
a linebreak against the opposition team (w=0.919 vs. w=0.613), suggesting that the
team has strong defence since linebreaks by the opposition team were less likely to
result in the opposition team scoring compared to the likelihood of linebreaks made by
the team through the opposition defensive line resulting in them scoring. The OR of 1.8
indicated that the opposition team is 1.8 times more likely to score when they make a
linebreak in a sequence of play than if they do not. The second most discriminative
pattern 14 9 15 (w=0.392, OR=1.479) between conceding and non-conceding outcomes
can be interpreted as the opposition team being in possession of the ball, the team
making some form of error, and the opposition team regaining possession. The
opposition team is 1.5 times more likely to score when this pattern occurs in a sequence
of play than if it does not. The third most discriminative pattern (20) between
conceding and non-conceding outcomes was an opposition team lineout (w=0.357,
OR=1.428). The opposition team is 1.4 times more likely to score if they have a lineout
in a sequence of play than if they do not. The fourth (w=0.339, OR=1.403) and fifth
(w=0.261, 1.299) most discriminative patterns for the conceding dataset represent
repeated phase and breakdown play, with the fifth subsequence, for example, indicating
the opposition team making over six repeated consecutive phases and breakdowns,
suggesting the retaining of possession and building of pressure by the opposition team.
Comparison of SPP-obtained patterns to those obtained by
unsupervised models
Tables 7 and 8 show the top five subsequences in terms of their support from the
scoring+1 and conceding+1 datasets.
The obtained results show that common events and patterns were detected with the
unsupervised models, i.e., breakdowns and phases. Repeated breakdown and phase play
is a means retaining possession of the ball and building pressure. Longer repeated
February 26, 2021 13/18Table 6. Top five most discriminative SPP-obtained patterns between conceding and non-conceding
outcomes.
event id pattern (qj ) pattern description support weight OR
24 O-Linebreak 32 0.613 1.846
14 9 15 O-phase, error, O-breakdown 10 0.392 1.479
20 O-lineout 86 0.357 1.428
15 15 14 15 O-breakdown, O-breakdown, O-phase, O- 5 0.339 1.403
breakdown
15 14 15 14 15 14 15 14 15 14 15 14 15 [O-breakdown, O-phase]x6, O-breakdown 16 0.261 1.299
Table 7. Top five PrefixSpan-obtained patterns of play with the largest
support: scoring+1 dataset.
PrefixSpan CM-SPAM CM-SPADE GSP Fast support
2 2 2 2 2 84
23 3 3 3 3 60
3 23 23 23 23 60
22 22 32 22 22 59
232 232 22 32 32 59
Table 8. Top five PrefixSpan-obtained patterns of play with the largest
support: conceding+1 dataset.
PrefixSpan CM-SPAM CM-SPADE GSP Fast support
14 14 14 14 14 39
14 15 15 15 15 15 33
15 14 15 14 15 14 15 14 15 33
14 14 14 14 15 14 14 14 14 14 29
14 15 14 14 15 14 14 14 15 14 15 14 29
breakdown and phases plays were also identified by SPP. However, in the case of the
unsupervised model-obtained results, these patterns are not particularly useful for
coaches or performance analysts since they merely reflect common, repeated patterns
rather than interesting patterns. The supervised approach with SPP, by using sequences
representing passages of play labelled with points scoring outcomes, by virtue of the
computed weights, is able to provide a measure of the importance of patterns of plays to
these outcomes. In addition, compared to the unsupervised models, the supervised SPP
model obtained a greater variety of patterns of play, i.e., not only those containing
breakdowns and or phases, and also discovered more sophisticated patterns.
Discussion
In this study, a supervised sequential pattern mining model called safe pattern pruning
(SPP) was applied to data from professional rugby union in Japan, consisting of
sequences in the form of passages of play that are labelled with points scoring outcomes.
The obtained results suggest that the SPP model was useful in detecting complex
patterns (patterns of play) that are important to scoring outcomes. SPP was able to
identify relatively sophisticated, discriminative patterns of play, which make sense in
terms of their interpretation, and which are potentially useful for coaches and
performance analysts for own- and opposition-team analysis in order to identify
vulnerabilities and tactical opportunities.
February 26, 2021 14/18By considering both the scoring and conceding perspectives of the team, insight was
able to be obtained that would be useful to both the team as well as opposition teams
that are due to play the team. For both the team and their opposition teams during the
2018 season, linebreaks were found to be most associated with scoring. For both the
team and their opposition teams, lineouts were found to be more beneficial to generate
scoring opportunities than scrums. These results are consistent with [34], who found
that lineouts followed by a driving maul are common approaches to scoring tries (albeit
in a different competition, Super Rugby), and with [38], who found that around
one-third of tries came from lineouts in the Japan Top League in 2003 to 2005—the
highest of any try source. As well as creating lineouts or perhaps prioritising them over
scrums, for opposition teams playing the team, effective strategies may include
maintaining possession with repeated phase-breakdown play (by aiming for over six
repetitions), shutting down the team’s ability to regain kicks, and making sure to find
touch on exit plays from kick restarts made by the team.
As mentioned, compared to the unsupervised models, the supervised SPP model
obtained a greater variety of patterns that were also more complex. This is likely due to
the advantage of the supervised (i.e., labelled) nature of SPP as well as the safe
screening and pattern pruning mechanisms of SPP, which prune out irrelevant
sequential patterns and model weights in advance.
The approach highlighted the potential utility of supervised sequential pattern
mining as an analytical framework for performance analysis in sport, and more
specifically, the potential usefulness of sequential pattern mining techniques for
performance analysis in rugby. Although the results obtained are encouraging, a limited
amount of data from one sport was used. Also, spatial information such as field position
was not available in the data, which may have improved the analysis. Although the
team that performed a particular event was used in our analysis, which player
performed particular events was not considered. This may be interesting to investigate
in future work. A limitation of SPP is that, although we considered the order of events
within the sequences and their label, the method does not consider the order of
sequences within matches, which could also be of informative value (e.g., a particular
pattern occurring in the second half of a match may be more important than if it occurs
in the first half). Furthermore, although SPP was useful for the specific dataset in this
study, its usefulness is to some degree dependent on the structure of the input data and
the specific definition of the sequences and labels. For instance, applying the approach
to a dataset that consists of entire matches as sequences and win/loss outcomes as the
labels does not tend to produce interesting results since it is self-evident that sequences
that contain more scoring events will be more associated with wins, thus, SPP would
pick up the scoring events on such datasets. In future work, it would be interesting to
apply the approach to a larger amount of data from rugby, as well as to similarly
structured datasets in other sports in order to confirm its efficacy.
S1 Dataset. The delimited sequence data that is described in the paper is available
on GitHub: https://github.com/rbun013/Rugby-Sequence-Data.
S2 Appendix. Safe Screening and Regularization Path Initialization. Some
weights are removed prior to solving (4) using safe screening, which corresponds to
finding j such that wj = 0 in the optimal solution w∗ := [w1∗ , . . . , wd∗ ]> in the
optimization problem (4). Such wj do not affect the optimal solution even if they are
removed prior. In the optimal solution, the w∗ of the optimization problem (2), a set of
j such that |wj∗ | > 0 is called the active set, and is denoted as A ⊆ Q. In this case, even
if only the subsequence patterns included in A are used, the same optimal solution as
February 26, 2021 15/18when using all the subsequence patterns can be obtained. Thus, if one solves
X
0∗ 0∗
(wA , b ) := argmin `(yi , f (gi ; {q}i∈A )) + λkwk1 , (5)
w,b
i∈[n]
then it is guaranteed that w∗ = wA 0∗
and b∗ = b0∗ .
In practice, the λ parameter is found based on a model selection technique such as
cross-validation. In model selection, a sequence of solutions, a so-called regularization
path, with various penalty parameters must be trained. The regularization path of the
problem (2), {λ0 , λ1 , . . . , λK }, is usually computed with decreasing λ because sparser
solutions are obtained for larger λ.
The initial values for computing the regularization path are set to w∗ ← − 0, b∗ ←− ȳ
(where ȳ is the sample mean of {yi }i∈[n] ) and λ0 ← − λmax (see [27] for how λmax is
calculated and for further details of the safe pattern pruning model and its
safe-screening mechanism).
References
1. Hughes MD, Bartlett RM. The use of performance indicators in performance
analysis. Journal of sports sciences. 2002;20(10): 739–754.
2. Agrawal R, Srikant R. Mining sequential patterns. In: Proceedings of the
eleventh international conference on data engineering. IEEE; 1995. p. 3–14.
3. Mabroukeh NR, Ezeife CI. A taxonomy of sequential pattern mining algorithms.
ACM Computing Surveys (CSUR). 2010 Dec 3;43(1): 1-41.
4. Wang K, Xu Y, Yu JX. Scalable sequential pattern mining for biological
sequences Proceedings of the thirteenth ACM international conference on
Information and knowledge management. 2004;178–187
5. Ho J, Lukov L, Chawla S. sequential pattern mining with constraints on large
protein databases. In Proceedings of the 12th international conference on
management of data (COMAD). 2005, p. 89-100
6. Exarchos, TP, Papaloukas, C, Lampros, C, & Fotiadis, DI. Mining sequential
patterns for protein fold recognition Journal of Biomedical Informatics.
2008;41(1):165–179
7. Hsu CM, Chen CY, Liu BJ, Huang CC, Laio MH, Lin CC, Wu TL. Identification
of hot regions in protein-protein interactions by sequential pattern mining BMC
bioinformatics. 2007 May;8(5):1-5.
8. Garboni C, Masseglia F, Trousse B. sequential pattern mining for structure-based
XML document classification. In International Workshop of the Initiative for the
Evaluation of XML Retrieval. 2005 Nov 28 (pp. 458-468).
9. Feng J, Xie F, Hu X, Li P, Cao J, Wu X. Keyword extraction based on sequential
pattern mining. In proceedings of the third international conference on internet
multimedia computing and service. 2011 Aug 5 (pp. 34-38).
10. Xie F, Wu X, Zhu X. Document-specific keyphrase extraction using sequential
patterns with wildcards. In 2014 IEEE International Conference on Data Mining
2014 Dec 14 (pp. 1055-1060). IEEE.
February 26, 2021 16/1811. Xie F, Wu X, Zhu X. Efficient sequential pattern mining with wildcards for
keyphrase extraction. Knowledge-Based Systems. 2017 Jan 1;115:27-39.
12. Yap GE, Li XL, Philip SY. Effective next-items recommendation via personalized
sequential pattern mining. In International conference on database systems for
advanced applications 2012 Apr 15 (pp. 48-64). Springer, Berlin, Heidelberg.
13. Salehi M, Kamalabadi IN, Ghoushchi MB. Personalized recommendation of
learning material using sequential pattern mining and attribute based
collaborative filtering. Education and Information Technologies. 2014
Dec;19(4):713-35.
14. Ceci M, Lanotte PF, Fumarola F, Cavallo DP, Malerba D. Completion time and
next activity prediction of processes using sequential pattern mining. In
International Conference on Discovery Science 2014 Oct 8 (pp. 49-61). Springer,
Cham.
15. Wright AP, Wright AT, McCoy AB, Sittig DF. The use of sequential pattern
mining to predict next prescribed medications. Journal of biomedical informatics.
2015 Feb 1;53:73-80.
16. Tsai CY, Lai BH. A location-item-time sequential pattern mining algorithm for
route recommendation. Knowledge-Based Systems. 2015 Jan 1;73:97-110.
17. Tarus JK, Niu Z, Kalui D. A hybrid recommender system for e-learning based on
context awareness and sequential pattern mining. Soft Computing. 2018
Apr;22(8):2449-61.
18. Fournier-Viger P, Lin JCW, Kiran RU, Koh YS, Thomas R. A survey of
sequential pattern mining. Data Science and Pattern Recognition.
2017;1(1):54–77.
19. Srikant R, Agrawal R. Mining sequential patterns: Generalizations and
performance improvements. In International Conference on Extending Database
Technology 1996 Mar 25 (pp. 1-17). Springer, Berlin, Heidelberg.
20. Agarwal R, Srikant R. Fast algorithms for mining association rules. In Proc. of
the 20th VLDB Conference 1994 Sep 12 (Vol. 487, p. 499).
21. Zaki, MJ SPADE: An efficient algorithm for mining frequent sequences Machine
learning. 2001;42(1-2):31-60.
22. Ayres J, Flannick J, Gehrke J, Yiu T. sequential pattern mining using a bitmap
representation. In Proceedings of the eighth ACM SIGKDD international
conference on Knowledge discovery and data mining 2002;429-435.
23. Pei J, Han J, Mortazavi-Asl B, Wang J, Pinto H, Chen Q, et al. Mining
sequential patterns by pattern-growth: The prefixspan approach. IEEE
Transactions on knowledge and data engineering. 2004;16(11):1424–1440.
24. Fournier-Viger P, Gomariz A, Campos M, Thomas R. Fast vertical mining of
sequential patterns using co-occurrence information. In Pacific-Asia Conference
on Knowledge Discovery and Data Mining 2014;40-52.
25. Salvemini E, Fumarola F, Malerba D, Han J. Fast sequence mining based on
sparse id-lists. In International Symposium on Methodologies for Intelligent
Systems. 2011;316-325.
February 26, 2021 17/1826. Nakagawa K, Suzumura S, Karasuyama M, Tsuda K, Takeuchi I. Safe pattern
pruning: An efficient approach for predictive pattern mining. In: Proceedings of
the 22nd acm sigkdd international conference on knowledge discovery and data
mining; 2016. p. 1785–1794.
27. Sakuma T, Nishi K, Kishimoto K, Nakagawa K, Karasuyama M, Umezu Y, et al.
Efficient learning algorithm for sparse subsequence pattern-based classification
and applications to comparative animal trajectory data analysis. Advanced
Robotics. 2019;33(3-4): 134–152.
28. Ghaoui LE, Viallon V, Rabbani T. Safe feature elimination for the lasso and
sparse supervised learning problems. arXiv preprint arXiv:10094219. 2010;.
29. La Puma I, de Castro Giorno FA. Ontology-Based Data Mining Approach for
Judo Technical Tactical Analysis. In: The Third International Conference on
Computing Technology and Information Management (ICCTIM2017); 2017. p. 90.
30. Hrovat G, Fister Jr I, Yermak K, Stiglic G, Fister I. Interestingness measure for
mining sequential patterns in sports. Journal of Intelligent & Fuzzy Systems.
2015;29(5): 1981–1994.
31. Decroos T, Van Haaren J, Davis J. Automatic discovery of tactics in
spatio-temporal soccer match data. In: Proceedings of the 24th ACM SIGKDD
International Conference on Knowledge Discovery & Data Mining; 2018. p.
223–232.
32. Carter A, Potter G. The 1995 rugby world cup finals. 187 tries. 2001) Notational
Analysis of Sport III University of Wales Institute Cardiff Cardiff, Wales UWIC.
2001; p. 224–229.
33. van Rooyen KM, Noakes DT. Movement time as a predictor of success in the
2003 Rugby World Cup Tournament. International journal of Performance
analysis in Sport. 2006;6(1):30–39.
34. Coughlan M, Mountifield C, Sharpe S, Mara JK. How they scored the tries:
applying cluster analysis to identify playing patterns that lead to tries in super
rugby. International Journal of Performance Analysis in Sport.
2019;19(3):435–451.
35. Watson N, Hendricks S, Stewart T, Durbach I. Integrating machine learning and
decision support in tactical decision-making in rugby union. Journal of the
Operational Research Society. 2020; p. 1–12.
36. Liu T, Fournier-Viger P, Hohmann A. Using diagnostic analysis to discover
offensive patterns in a football game. In: Recent Developments in Data Science
and Business Analytics. Springer; 2018. p. 381–386.
37. Fournier-Viger P, Gomariz A, Gueniche T, Soltani A, Wu CW, Tseng VS
sequential pattern miningF: a Java open-source pattern mining library. The
Journal of Machine Learning Research. 2014 Jan 1;15(1): 3389-93.
38. Sasaki K, Furukawa T, Murakami J, Shimozono H, Nagamatsu M, Miyao M,
Yamamoto T, Watanabe I, Yasugahira H, Saito T, Ueno Y. Scoring profiles and
defense performance analysis in Rugby Union. International Journal of
Performance Analysis in Sport. 2007 Oct 1;7(3): 46-53.
February 26, 2021 18/18You can also read