Supplemental Information Allosteric Effects of the Oncogenic RasQ61L Mutant on Raf-RBD - Susan K. Fetics, Hugo Guterres, Bradley M. Kearney, Greg ...
←
→
Page content transcription
If your browser does not render page correctly, please read the page content below
Structure, Volume 23

Supplemental Information

Allosteric Effects of the Oncogenic

RasQ61L Mutant on Raf-RBD
Susan K. Fetics, Hugo Guterres, Bradley M. Kearney, Greg Buhrman,
Buyong Ma, Ruth Nussinov, and Carla Mattos
Supplemental Data

Comparison between Ras/Raf-RBD and Raps/Raf-RBD

       Although a good model for the Ras-GppNHp/Raf-RBD interface, the Raps-GppNHp/Raf-RBD

structure is not a good representative for the long-range effects of Ras on Raf-RBD. Superposition of the

Raf-RBD complexes with Ras (PDB code 4G0N) and with Raps (PDB code 1GUA) (Figure S1) shows

very similar interfaces at switch I, with K84 interacting simultaneously with E31 and D33 and Ras Y32

interacting with the γ-phosphate of GppNHp through the bridging water molecule, as we also observed

in our model of uncomplexed Ras-GppNHp in the presence of calcium acetate (PDB code 3K8Y).

Although the crystal structures show K84 interacting with both E31 and D33, NMR work has shown

that the primary interaction involving Raf-RBD residue K84 is with D33 on Ras, with E31 playing a less

important role (Terada et al., 1999). Switch II has a very different sequence in Raps, including residue

61 that is a threonine, and is found in a conformation different from those seen in the Ras structures.

Interestingly, with the exception of switch II, the two structures superimpose very well in the effector

lobe (residues 1-85 in both Ras and Raps), but show significant shifts in the allosteric lobe (residues 86-

166, Ras numbering), particularly in helices 4 and 5, where there are two insertions in Rap relative to

Ras at residues 122 and 140. It is interesting to note that Ras and Rap are 67% identical in their effector

lobes but only 52% identical when comparing their allosteric lobes, consistent with the better effector

lobe superposition. In spite of a good match at the interface, there are some significant differences. For

example, the salt bridge between Raf-RBD R67 and Ras D37 is not present in the complex with Raps,

where Raf-RBD R67 is rotated toward F61. Other than this interaction, the pathway of communication

to K109 near L4 is preserved in the Raps/Raf-RBD complex, with K109 interacting with both Q127 and

D129 as in the wild type Ras/Raf-RBD complex. Even so, there are differences in the details of the loop

L4 conformation. This could be due to the presence of a calcium ion coordinated by Raf-RBD residues
near L4 in the complex with Raps or to crystal contacts that may be present near this loop in this complex. Alternatively, the observed differences could be a result of indirect effects of switch II in Raps, which as exemplified by the switch II mutant RasQ61L, plays a significant role in the long-range effects leading to the behavior of L4 in Raf-RBD. Molecular dynamics simulations comparing the Raps/Raf-RBD complex with a computational model of the Ras/Raf-RBD complex has been previously published (Zeng et al., 1999) and show trends consistent with those observed in present comparison, including the shift in Raf-RBD L4 toward Ras in the Ras/Raf-RBD complex. More recently, structures of Ras and Rap bound to a mutated Raf-RBD have also been solved (Filchtinski et al., 2010). Raf-RBD residue A85 has been mutated to lysine to increase the affinity to the GDP-bound form of the GTPases. The A85K mutation is at the interface with the active site of Ras, perturbing the view of an intact complex in this region.
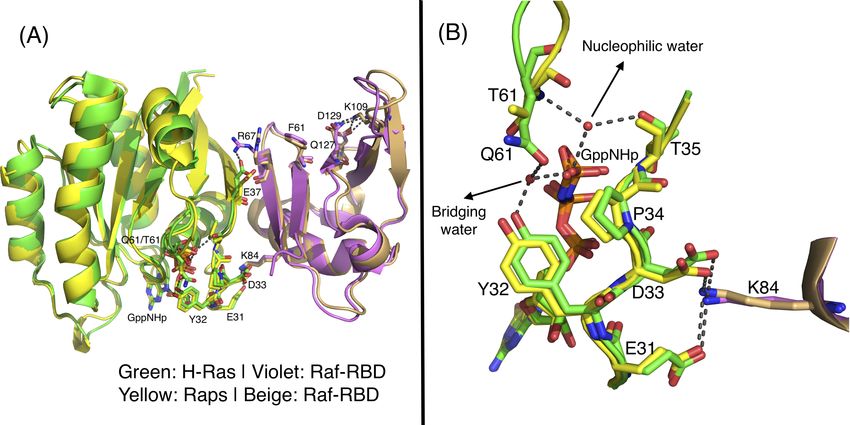
Figure S1 related to Figure 3. Comparison of wild type Ras/Raf-RBD and Raps/Raf-RBD complexes.

Color-coding for Ras/Raf-RBD is as in Figure 5 of the main text. Raps is yellow and Raf-RBD is beige

in the Raps/Raf-RBD complex. (A) The two complexes superimposed. Active site residues as well as

those leading from the interface to K109 are shown in stick. (B) Active site superimposed in the two

complexes. The nucleophilic and bridging water molecules present in both complexes are shown in red

spheres and H-bonding interactions are in black dashed lines.
Supplemental Experimental Procedures
Cloning, Protein Purification and Crystallization
The GB1_Raf-RBD-CRD DNA construct containing an N-terminal B1 immunoglobulin-binding
domain of streptococcal protein G (GB1 domain), a thrombin cleavage site and Ras residues 52 to 184,
was inserted into the Champion pET302/NT-His vector (Invitrogen) as described in the main text. The
plasmid was transformed using BL21 (DE3) expression cells (Novagen). After overnight inoculation of
Luria Broth (LB), cells were induced at 37 °C with 120 mg IPTG per liter LB when OD= 0.8-1.0. ZnCl2
(200-300 µM) was added to each liter of LB at the time of induction. Cell paste was resuspended at 4 °C
in Buffer A (20 mM HEPES, pH 7.0, 20 mM NaCl, 20 µM ZnCl2, 5 mM MgCl2 5% glycerol 10mM
DTT) containing a cocktail of protease inhibitors. Nucleic acids were precipitated with benzonase
nucleases (EM Industries). Elution Buffer B was identical to Buffer A with 1.0 M NaCl. The protein was
run over HiPrep SPFF 16/10 column (GE Healthcare) and eluted with gradient of 0-60% buffer B.
GB1_Raf-RBD-CRD purity was assessed with SDS-PAGE gel. Fractions were immediately pooled and
1 molar equivalent of H-Ras-GppNHp was promptly added to the solution containing Raf. The
Ras/GB1_Raf-RBD-CRD complex was concentrated to 2mg/mL and then dialyzed against Thrombin
cleavage buffer containing 20 mM Tris (pH 8.1), 100 mM NaCl, 25 mM CaCl2, 5 mM MgCl2, 20 µM
ZnCl2, 1 mM DTE for 4 hours at 4 °C, after which complex was dialyzed into fresh Thrombin cleavage
buffer at 18 °C. Thrombin (1U/µL) was added at 20 Units Thrombin per mg of Raf and left to react for
18 h at 18 °C. Proteolysis was arrested by dropping the temperature to 4 °C for 4h. The protein was
concentrated to 1 mL for size exclusion column purification (50 mM HEPES, pH 7.2, 50 mM NaCl, 10
mM MgCl2 , 5% Glycerol, 1 mM DTE, 10 µM ZnCl2). Ras/Raf-RBD-CRD fractions were checked for
purity with SDS-PAGE gel. Fractions were pooled and concentrated for final concentration of 10-16
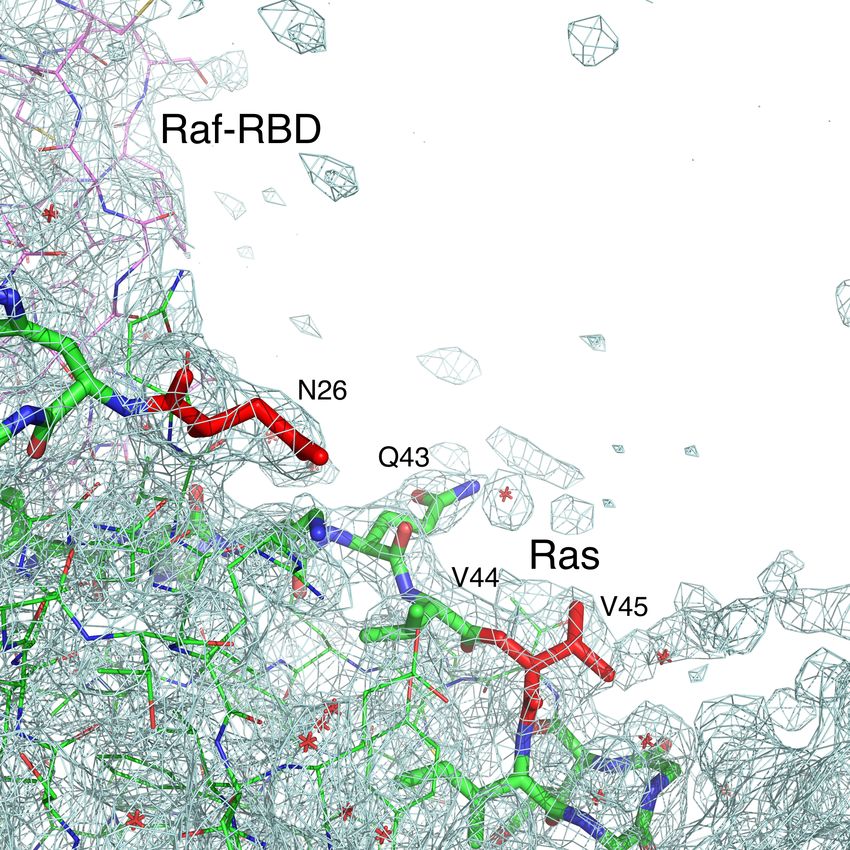
mg/mL of complex.Data Collection and structure refinement Both wild type and mutant complexes crystallized with symmetry of the space group P321 with the twin law -h, -k, l. For the wild type Ras/Raf-RBD-CRD crystal, an X-ray diffraction data set was collected at the Argonne National Laboratory, Advanced Photon Source (APS) GM/CA-CAT beamline 23ID-B, at a temperature of 100K. HKL2000 was used for processing and SCALEPACK used for scaling the data (Otwinowski and Minor, 1997). Wild type Ras/Raf-RBD complex was solved to 2.45 Å resolution, iteratively using the programs PHENIX and COOT (Adams et al., 2010; Emsley and Cowtan, 2004) to final crystallographic R-factors R/Rfree of 18.1%/23.0%. Our previously published model with PDB code 3K8Y was used for molecular replacement of Ras and the Raf-RBD domain was phased with the structure of Raf-RBD taken from the Raps/Raf-RBD complex (PDB code 1GUA). Unsuccessful attempts were made using the average NMR structure of Raf-CRD (PDB code 1FAR) to fit the CRD with PHENIX AutoMR where the Ras and RBD were held fixed and CRD was the searchable component. Given that the CRD domain was present in the construct set up for crystallization, it was surprising that we could not position the CRD in spite of trying to phase by molecular replacement with the available NMR structure of this Raf domain (PDB code 1FAR) (Mott et al., 1996) and several available structures of CRD’s from other proteins. Consistently, refinement of the structure in the absence of the CRD yielded good R and Rfree values and a large area in the electron density maps with no electron density, indicating that the CRD is present, but disordered in this structure (Figure S2). The Raf-CRD binding site on Ras-GppNHp has been mapped by NMR (Thapar et al., 2004) and involves a continuous surface consisting of residues 23-30 (just before switch I), with additional contributions from V45 and neighboring residues, as determined by site directed mutagenesis (Hu et al., 1995). The area with no electron density shown in Figure S2 is adjacent to this region, further validating our conclusion that the CRD is present, albeit disordered under our crystallization conditions.
Figure S2 related to Experimental Procedures. Expected interface between Ras and Raf-CRD shown in

the Ras/Raf-RBD complex. The 2Fo-Fc electron density map is shown contoured at the 1.0σ level. The

maximul-likelyhood weights for structure factors using sigma A formulation were used in the

calculation of the electron density map. There is no electron density in the location where the CRD

domain is expected to reside. Ras residues are shown in green or red and Raf-RBD residues are in violet.
N atoms are shown in blue and O atoms in red. Water molecules are shown as red crosses. Ras residues

with changed chemical shifts observed by NMR upon binding the CRD of Raf are shown in thick green

or red sticks. Mutations at residues N26 and V45, shown in thick red sticks, significantly decrease

affinity to Raf-CRD.

       For RasQ61L/Raf-RBD-CRD, X-ray diffraction data were collected at APS, SER-CAT beamline

ID-22. Analysis of this data set by the UCLA diffraction anisotropy server indicated that the diffraction

along the c* axis was superior than in the other directions (http://services.mbi.ucla.edu/anisoscale/)

(Strong et al., 2006). On the basis of an F/σ(F) cutoff of 3 along each reciprocal space axis, reflections

were subjected to an anisotropic truncation with resolution limits of 3.3 Å, 3.3 Å and 3.2  Å along a*, b*

and c* axis, respectively. In deciding on the overall resolution to report for this structure, we tried

various resolution cutoff values and found that the maps were improved by including the data to 3.3 Å

compared to 3.4 Å. This is due to the anisotropy of the data, resulting in better reflections in one of the

three directions. Although the completeness and I/σ(I) in the high-resolution shell as shown in Table 1

for this structure are poorer than normally reported, we found that 3.3 Å is a good compromise between

throwing out good data in the c* axis and the poor statistics at the highest resolution shell associated

with the a* and b* directions that contribute to the overall poor statistics in this shell. We therefore

report this structure to an overall resolution of 3.3  Å. Coordinates from our wild type Ras/Raf-RBD

complex were used for molecular replacement of RasQ61L/Raf-RBD in PHENIX with a final R/Rfree of

25.1%/27.1%. The Raf-CRD is disordered in the mutant complex as it is in the wild type complex as

described above.
Molecular dynamics simulations protocol
The five model systems described in the main text’s Experimental Procedures section were
subjected to the same MD simulation protocol. Each was solvated in a box of TIP3P water molecules
extending 10 Å from the solute atoms. This resulted in simulation boxes for Ras-GTP, RasQ61L-GTP,
Ras-GTP/Raf-RBD, and RasQ61L-GTP/Raf-RBD and Raf-RBD with volumes of 219,051 Å3, 212,400
Å3, 315,208 Å3, 314,340 and 138,985 Å3 respectively. Each system was neutralized with sodium and
chloride ions to reach a concentration of 0.15M. The simulation systems were minimized for 5000 steps
of conjugate gradient minimization and then heated gradually from 50 K to 250 K prior to the
production runs. Periodic boundary conditions were applied in the x, y, and z directions during
isothermal-isobaric simulations at 300 K and 1 atm. The first 30 ns of the production run were done with
a time step of 1 fs, followed by 60 ns with a time step of 2fs, for a total of 90 ns simulation of each of
the five systems. The long-range non-bonded interactions were calculated using the switch function
between 10 and 11 Å. Particle Mesh Ewald was activated to evaluate the electrostatic interactions.
Dynamical network analysis
Dynamical network analysis is a general method used to obtain an accurate picture of network topology
and long-range signaling in protein complexes derived from molecular dynamics simulations (Sethi et
al., 2009). Each amino acid residue in the complex is assigned a node centered on its Cα atom and used
as a base to construct significant regions of amino acid interactions and pathways of allosteric
modulation that connect them. Edges are placed to connect the nodes between residues that remain
within a distance of 4.5 Å for at least 75% of the simulation time. The edges are weighted using pairwise
correlation data calculated by the program Carma (Glykos, 2006). This information can then be mined to
define community networks using the Girvan-Newman algorithm (Girvan and Newman, 2002) and thediversity of paths that connect sites of functional significance in the complex (Sethi et al., 2009). Nodes in the same community network can communicate with each other easily through multiple paths, whereas those in distinct community networks either do not communicate well or communicate through one or a small number of nodes essential for allosteric modulation. The community networks in the wild type Ras and RasQ61L complexes with Raf-RBD are shown in Figure 8 and discussed in the main text of the present paper. Optimal and suboptimal pathways of communication between nodes in distinct communities are determined by defining one of the nodes as a source and the other as a sink. These are possible paths through which allosteric modulation can occur (Sethi et al., 2009). In our Ras/Raf-RBD simulation systems (wild type and mutant) the source was R97 in the allosteric site in Ras and the sink was K109 at the end of the Raf-RBD loop L4. Optimal and suboptimal paths are shown in Figure 10 of the main text. The optimal path is defined as the shortest distance between the source and sink nodes, while suboptimal paths are calculated within a tolerance value equal to the average edge weight in the protein (Sethi et al., 2009). The number of suboptimal paths between source and sink is a measure of the strength of communication between them, with key residues in the allosteric pathway identified as nodes that are present in multiple paths (Sethi et al., 2009). Supplemental References Adams, P.D., Afonine, P.V., Bunkoczi, G., Chen, V.B., Davis, I.W., Echols, N., Headd, J.J., Hung, L.W., Kapral, G.J., Grosse-Kunstleve, R.W., et al. (2010). PHENIX: a comprehensive Python-based system for macromolecular structure solution. Acta Crystallogr D 66, 213-221. Emsley, P., and Cowtan, K. (2004). Coot: model-building tools for molecular graphics. Acta Crystallogr D 60, 2126-2132.
Filchtinski, D., Sharabi, O., Ruppel, A., Vetter, I.R., Herrmann, C., and Shifman, J.M. (2010).

What makes Ras an efficient molecular switch: a computational, biophysical, and structural

study of Ras-GDP interactions with mutants of Raf. Journal of Molecular Biology 399, 422-435.

Girvan, M., and Newman, M.E. (2002). Community structure in social and biological networks.

Proceedings of the National Academy of Sciences of the United States of America 99, 7821-

7826.

Glykos, N.M. (2006). Software news and updates. Carma: a molecular dynamics analysis

program. Journal of Computational Chemistry 27, 1765-1768.

Hu, C.D., Kariya, K., Tamada, M., Akasaka, K., Shirouzu, M., Yokoyama, S., and Kataoka, T.

(1995). Cysteine-rich region of Raf-1 interacts with activator domain of post-translationally

modified Ha-Ras. The Journal of Biological Chemistry 270, 30274-30277.

Mott, H.R., Carpenter, J.W., Zhong, S., Ghosh, S., Bell, R.M., and Campbell, S.L. (1996). The

solution structure of the Raf-1 cysteine-rich domain: a novel ras and phospholipid binding site.

Proceedings of the National Academy of Sciences of the United States of America 93, 8312-

8317.

Otwinowski, Z., and Minor, W. (1997). Processing of X-ray diffraction data collected in

oscillation mode. Method Enzymol 276, 307-326.

Sethi, A., Eargle, J., Black, A.A., and Luthey-Schulten, Z. (2009). Dynamical networks in

tRNA:protein complexes. Proceedings of the National Academy of Sciences of the United States

of America 106, 6620-6625.

Strong, M., Sawaya, M.R., Wang, S., Phillips, M., Cascio, D., and Eisenberg, D. (2006). Toward

the structural genomics of complexes: crystal structure of a PE/PPE protein complex from
Mycobacterium tuberculosis. Proceedings of the National Academy of Sciences of the United

States of America 103, 8060-8065.

Terada, T., Ito, Y., Shirouzu, M., Tateno, M., Hashimoto, K., Kigawa, T., Ebisuzaki, T., Takio,

K., Shibata, T., Yokoyama, S., et al. (1999). Nuclear magnetic resonance and molecular

dynamics studies on the interactions of the Ras-binding domain of Raf-1 with wild-type and

mutant Ras proteins. Journal of Molecular Biology 286, 219-232.

Thapar, R., Williams, J.G., and Campbell, S.L. (2004). NMR characterization of full-length

farnesylated and non-farnesylated H-Ras and its implications for Raf activation. Journal of

Molecular Biology 343, 1391-1408.

Zeng, J., Treutlein, H.R., and Simonson, T. (1999). Molecular dynamics simulations of the

Ras:Raf and Rap:Raf complexes. Proteins 35, 89-100.
You can also read