Survey of Environment: A Step towards sustainability - cerc ...
←
→
Page content transcription
If your browser does not render page correctly, please read the page content below
ISSN 2349-5596

   Newsletter on Eco-labelling and Eco-friendly Products
   Volume 14, No. 3 October-December 2019

      Survey of Environment:
   A Step towards sustainability

                                      Sponsored by:
Ministry of Environment, Forests and Climate Change, Government of India
                               ENVIS Resource Partner on:
      Environment Literacy - Eco-labelling and Eco-friendly Products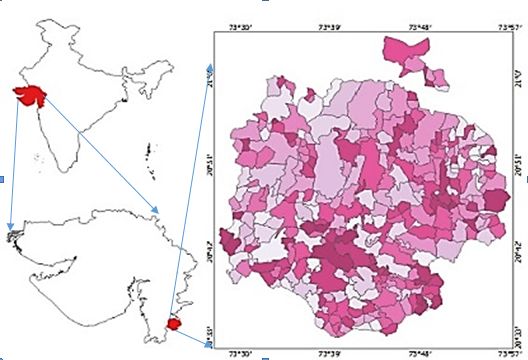
Sri Praful Amin
CERC, Chairman
July-September 2019
Editorial (ENVIS) Team
Uday Mawani
Chief Executive Officer and Project
Contents Coordinator
Dr. Ashoka Ghosh
Ms. Divya Namboothiri
Foreword
Ms. Apeksha Sharma
Environmental Survey and its importance
Manoj Bhavsar
Environmental Survey: Indian Scenario Design & Graphics
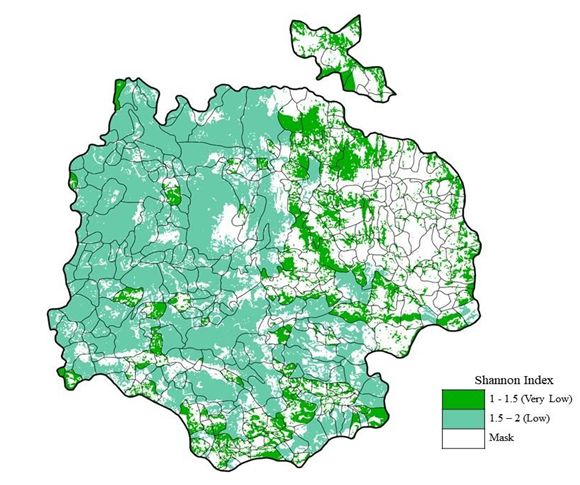
The Dangs
Districts allotted to CERC-ENVIS RP
F
O
In 1983, the UN World Commission on Environment and relationships involved in maintaining human health and
R Development was created in 1983 and its landmark report, environmental wellbeing. Environmental indicators reflect
E "Our Common Future", in 1987, focused the world's the current state of the environment. There is a need to
attention on the links between environmental problems, effectively manage the environment if development is to
W patterns of economic development and social and political be at all sustainable.
factors. The chairman of the commission said, ‘with the
O "environment" is where we all live, and "development" is Survey of the environment and systematic collection of
R what we all do in attempting to improve our lot within that environmental data has significant importance. These are
abode. The two are inseparable.’ With The global economy now widely used in reporting, planning, clarifying policy
D had to meet people's needs and legitimate desires, but objectives and priorities, budgeting, and assessing
growth had to fit within the planet's ecological limits. performance.
Sustainability involves interacting economic, social, and The present issue covers the importance of environmental
environmental factors. Progress toward sustainability thus indicators, how they are powerful tools for tracking
requires directing policy attention to all three. environmental progress, providing policy feedback and
Environment and development are not separate measuring environmental performance. It discusses
challenges. They are closely linked. Development cannot India's first-ever National Environment Survey (NES). It will
continue if the environment and natural resources map environment data of all districts and rank all districts
deteriorate and the environment cannot be protected if on their environmental performance and document their
economic growth ignores the costs of environmental best green practices based on various environmental
destruction. parameters. The Survey will be carried out by the Ministry
of Environment, Forests and Climate Change through
Environmental issues are many and varied. Deforestation, Environmental Information System (ENVIS) and its Hubs
desertification, change in biodiversity, energy use and Resource Partners across the country. This issue also
urbanization, managing wastes, transport are indicators covers the details of work that CERC-ENVIS RP will be
that help to understand the integrated and complex undertaking in six districts of Gujarat under the NES.
2 October-December 2019
Environmental Survey and its importance

 “While the overall policy focus should be on meeting basic needs and expanding opportunities for growth,
             they should not be at the expense of unsustainable environmental degradation.”
                                                                                        Muthukumara Mani
                                                                            Senior Environmental Economist

Since the United Nations Conference on Environment     indicators disseminate global environment statistics.
and Development in 1992, sustainability has become     It helps to determine the appropriate level of effort or
a widely shared goal and an important topic. The       depth of such an assessment for surveying the
World Resources Institute, attempting to produce       environment.
environmental indicators for 'sustainable
                                                       Indicators are measurement, statistic, or value that
development' argue that “sustainability involves—at
                                                       identifies the presence or level of the factor
a minimum—interacting economic, social, and
                                                       affecting the environment. A set of such indicators
environmental factors” arguing that inadequate
                                                       and their trend points to the overall condition or
attention has been given to the latter. Growing
                                                       quality of the environment.
concern over environmental issues drives the need
for more comprehensive and reliable environmental      The Organisation for Economic Development and
information. It has also generated “State of the       Co-Operation (OECD) has worked on such indicators
Environment” efforts in many countries and             in close cooperation with OECD Member countries.
international organisations like the UN Environment    Its environmental indicators are regularly used in
Programme (UNEP) to provide, analyse and report        environmental performance reviews to monitor the
on scientifically-based environmental information.     integration of economic and environmental decision
                                                       making, to analyse environmental policies and to
For tracking environmental progress and supporting     gauge the results. Beyond their application in OECD
policy evaluation, environmental indicators are        environmental performance reviews, these
essential tools. These are the first line of warning   indicators also contribute to follow-up work on the
against hazards caused by humans or nature             OECD environmental strategy and to the broader
catastrophes to prevent diseases and death of living   objective of reporting on sustainable development.
organisms. There is a large range of environmental
indicators. These are generally air quality,           The United Nations Statistics Division (UNSD)
biodiversity, climate change, energy resources,        developed and published its first “A Framework for
forest resources, waste generation, water quality,     the Development of Environment Statistics” (FDES)
water resources and many more. Environmental           in 1984. The FDES sets out the scope of environment

                                                                                      October-December 2019   3
statistics by relating the components of the             (Brazil, Russian Federation, India, Indonesia, China
environment to information categories that are           and South Africa) and G20 countries.
based on the recognition that environmental
problems are the result of human activities and          The Environment and Climate Change Canada with
natural events reflecting a sequence of action,          the support of other federal government depart-
impact, and reaction. Relevant information,              ments prepare environmental indicators. Its
therefore, refers to social and economic activities      Canadian Environmental Sustainability Indicators
and natural events, their effects on the environment     (CESI) programme provides data and information to
and the responses to these effects by the society. The   track the performance on key environmental
revised FDES 2013 is a multipurpose conceptual and       sustainability issues including climate change and air
statistical frame work that is comprehensive and         quality, water quality and availability and protecting
integrative in nature. It provides an organizing         nature. The environmental indicators are based on
structure to guide the collection and compilation of     objective and comprehensive information and
environment statistics and to synthesize data from       convey environmental trends in a straightforward
various subject areas and sources.                       and transparent manner.

With an ever increasing demand for high quality          The European Environment Agency (EEA) of the
environment statistics especially bearing in mind the    European Union also develops indicators to answer
Sustainable Development Goal Agenda, the UNSD            key policy questions and to support all phases of
shares publicly environment-related censuses and         environmental policy making, from designing policy
surveys. The Environment Statistics Section of UNSD      frameworks to setting targets, and from policy
has undertaken this initiative in collaboration with     monitoring and evaluation to communicating to
the Expert Group on Environment Statistics and has       policy-makers and the public.
received contributions of censuses and surveys from
experts in the field of environment statistics from      The censuses and surveys are being made available
various countries around the world. The UNSD             for information and to help improve environment
continues to develop the Environment Statistics          statistics collection, and analysis of environment
Database that contains data received through the         statistics. Censuses and surveys available cover a
Questionnaire on Environment Statistics. UNSD            variety of themes all relevant to environment
cooperates closely with the OECD, the Statistical        statistics including agriculture, air and climate,
Office of the European Communities (Eurostat),           energy, environment expenditure, fisheries, waste
UNEP, the UN Division of Sustainable Development         and water.
(DSD) and the regional commissions, as well as with
specialized agencies, secretariats of international      Source:
conventions, NGOs and others, in order to build up       https://unstats.un.org/unsd/ENVIRONMENT/census
synergies, and to avoid duplication of efforts in data   esandsurveys.html
collection.                                              https://www.worldbank.org/en/news/feature/2014
                                                         /03/06/green-growth-overcoming-india-
Green growth policies need to be founded on a good       environment-challenges-promote-development,
understanding of the determinants of green growth        http://pdf.wri.org/environmentalindicators_bw.pdf,
and need to be supported with appropriate                http://www.oecd.org/environment/indicators-
indicators to monitor progress. Several countries are    modelling-
at the forefront of the transition towards green         outlooks/Highlights_Green_Growth_Indicators_201
growth, but no country leads in all areas. The OECD      7.pdf, https://www.canada.ca/en/environment-
countries release selected indicators for monitoring     climate-change/services/environmental-
progress towards green growth to support policy          indicators/about-sustainability.html,
making and inform the public at large. Their dataset     http://www.indiaenvironmentportal.org.in/files/file
covers OECD countries as well as BRIICS economies        /compendium%20environment%20statistics%20indi
                                                         a%202013.pdf

4   October-December 2019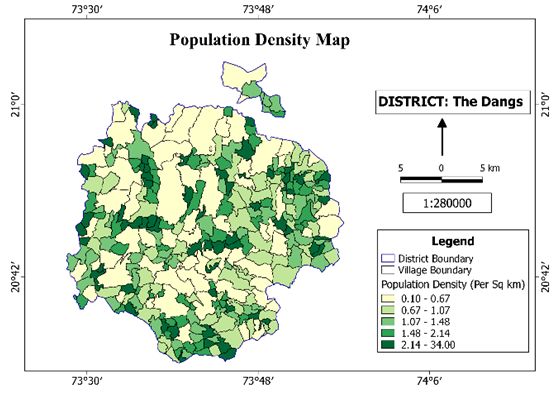
Environment Survey: Indian Scenario
Expansion of the human population, industrializa-         capability, GIS reveals deeper insights into data, such
tion, urbanization and many more anthropogenic            as patterns, relationships, and situations—helping
activities have caused an adverse impact on our           users make smarter decisions. GIS is a powerful tool
environment. The developmental activities being           that helps to monitor and supervise various aspects of
haphazard and erratic are leading to overuse of           environment degradation like decreasing glacier area,
natural resources and leading to environmental            growth in glacial lake size, unprecedented rainfall,
pollution. If this scenario continues, it is going to     changes in land use and land cover, forest
cause an irreparable damage to our mother earth.          degradation, floods and glacial lake outburst floods,
Realizing the damage caused, it has become an             landslides and shortfalls in agricultural crop
ardent requirement for us to adopt and adapt to a         production etc. The GIS based software applications
sustainable way of living so as to secure the future of   have been used widely for environment management
our progeny. Hence, today's main concern is to            and analysis studies.
safeguard and protect the environment that we
breathe and live in.                                      The usage of GIS in environmental risk management
                                                          ranges from simple development of databases
People all around the world have geared up to make        /inventory systems, to advanced GIS layers overlay,
corrective measures. Initiatives have been taken up       then to complex spatial decision-making systems for
to revive our nature back; old traditions that bring us   study of the impact of air, water and soil pollutions,
to close proximity to nature are being followed.          ecological imbalance and natural disasters on the
However, the efforts said and done are not enough,        environmental and human receptors. Effective
a lot more has to be done and GIS (Geographical           monitoring of the environment and an improved
Information System) can help us achieve our goal to       understanding of the same requires valuable
preserve and conserve our environment. It is              information and data that can be extracted through
valuable tool for effectively managing conservation       application of geospatial technologies such as remote
planning.                                                 sensing and GIS. It can also display and analyze aerial
GIS technology offers a radically different way to        photographs. Digital information can be overlaid on
produce and use the maps required to manage our           photographs to provide environmental data analysts
communities and industries. It creates intelligent        with more familiar views of landscapes and associated
super maps through which sophisticated planning           data. GIS can provide a quick, comparative view of
and analysis can be performed at the touch of a           hazards (highly prone areas) and risks (areas of high
button.                                                   risk which may occur) and areas to be safeguarded. In
                                                          order to plan and monitor the environmental
                                                          problems, the assessment of hazards and risks
GIS Solutions for Surveying                               becomes the foundation for planning decisions and
A geographic information system is a system
                                                          for mitigation activities. GIS supports activities in
designed to capture, store, manipulate, analyze,
                                                          environmental assessment, monitoring, and
manage, and present spatial or geographic data.
                                                          mitigation and can also be used for generating
Rooted in the science of geography, GIS integrates
                                                          environmental models.
many types of data. It analyses spatial location and
organises layers of information into visualisations       Surveys and Mapping
using maps and 3D scenes. With this unique                Surveys provide baselines for ground truth data that

                                                                                        October-December 2019   5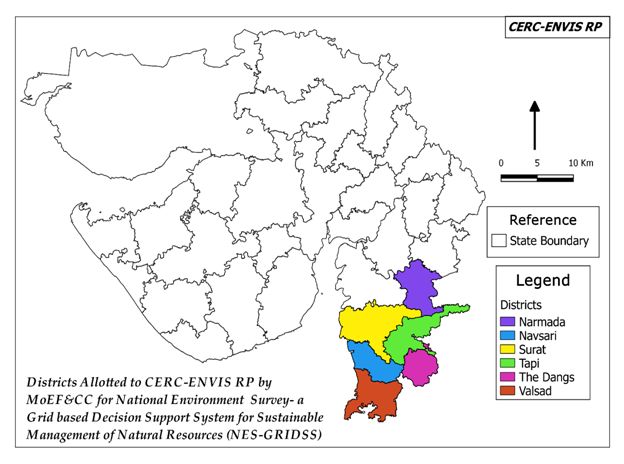
helps in preparing the attributes to create a map.         data of 55 districts across 24 States and 3 Union
Without knowing what is there and in what                  Territories. The NES will rank all districts on their
numbers, one cannot go forward with conservation           environmental performance and document their
plans. To know whether a species needs protection,         best green practices based on various environmental
one needs to know their population status, which is        parameters. The earliest first set of complete green
exactly what a survey provides. Surveys also indicate      data from this survey will be available in 2020. The
potential areas to be protected and help to identify       first NES will be carried out by Ministry of
potential threats to a species. The GIS based maps         Environment, Forests and Climate Change (MoEF&
and models have to be validated with the ground            CC) through Environmental Information System
truth data. Surveys need to be repeated at regular         (ENVIS) and its Hubs and Resource Partners across
intervals (e.g the tiger census is done once in 4 years)   the country. It will be done through grid-based
and the same methodology has to be followed each           approach, using grids measuring 5×5 km (grid size is
time. With the help of satellite images, ground truth      subject to change) to collect comprehensive data on
data and various algorithms, GIS based maps are            va r i o u s e nv i ro n m e nta l p a ra m ete rs . T h e s e
created.                                                   parameters will include air, water, soil quality, solid,
                                                           hazardous and e-waste, emission inventory; forest &
A report “India: Green Growth-Overcoming                   wildlife; flora & fauna; wetlands, lakes, rivers and
Environment Challenges to Promote Develop-                 other water bodies. It will also assess carbon
ment” by the World Bank in 2014 finds that                 sequestration potential of all the districts across the
environmental degradation costs India $80 billion          country.
per year or 5.7% of its economy. According to the
survey of World Health Organisation (WHO) in 2016,         The green data from this survey will provide
14 of the world's 20 most polluted cities are in India.    important tool in hands of policy-makers for decision
The WHO data also said that nine out of 10 people in       making at all levels – district, state and national. The
the world breathe air containing high levels of            survey will fully map and create emission inventory,
pollutants. It's no wonder that environmental              provide valuation of ecosystem services and collate
sustainability is considered to become the next            research data in the field of environment. Initially the
major challenge as India surges along its growth           survey will be focusing on 55 districts and later will be
trajectory. India is among the bottom five countries       scaled up to all districts in the country. The first set of
on the Environmental Performance Index (EPI) 2018,         data will be compiled in one year because it needs to
plummeting 36 places from 141 in 2016, according           cover seasonal cycles in terms of air pollution and
to a biennial report by Yale and Columbia                  flora & fauna. Presently the survey is planned for 55
Universities along with the World Economic Forum.          districts across the country. All 723 districts in the
While India is at the bottom of the list in the            country are expected to be surveyed in a period of
environmental health category, it ranks 178 out of         three to four years. ENVIS will include 18 modules,
180 as far as air quality is concerned. Its overall low    110 sub modules covering 617 parameters (numbers
ranking - 177 among 180 countries - was linked to          subject to change). ENVIS Hubs/RPs will periodically
poor performance in the environmental health.              update data obtained from state departme-
                                                           nts/bodies and maintain the NEG (National
Survey of Environment                                      Environmental Geodatabase).
To bring out the entire data of different
environmental aspects onto a single platform,              Below are the centers with their website links,
India's first ever National Environment Survey (NES)       wherein data source of different environmental
was kicked off in January, 2019 to map environment         aspects could be gathered.

6   October-December 2019
Sr. No. Data                                                     Source

1      Ministry of Forests, Environment and Climate Change       http://envfor.nic.in/
2      National remote sensing centre - Bhuvan                   http://bhuvan.nrsc.gov.in/bhuvan_links.php
3      Google earth (to be installed)                            earth.google.com
4      Western Ghats biodiversity portal                         https://thewesternghats.indiabiodiversity.org/
5      India biodiversity portal                                 https://indiabiodiversity.org/
6      Biodiversity information system                           https://www.cbd.int/gti/infosys/default.shtml
                                                                 https://indianbiodiversity.org/
7      Geological Survey of India                                https://www.gsi.gov.in/
8      Census of India                                           http://censusindia.gov.in/
9      Survey of India                                           http://www.surveyofindia.gov.in/
10     NBSSLUP (National Bureau of Soil Survey
       and Land Utilisation Planning)                            https://nbsslup.in/
11     NSDI                                                      https://nsdiindia.gov.in/nsdi/nsdiportal/index.jsp
12     State biodiversity board and forest department - webpages http://nbaindia.org/www.karnataka.gov.in /kbb/english/Pages/
                                                                 home.aspx/http://gsbb.goa.gov.in/ https://www.forests.
                                                                 tn.gov.in/pages/view/ about- present, http://aranya.gov.in,
                                                                 http://www.keralabiodiversity.org/, http://www.mahaforest.nic.in
                                                                 /index.php?lang_eng_mar=Eng
                                                                 https://fed.gujarat.gov.in/gsbb-fed.htm
13     Wild life Institute of India                              http://www.wii.gov.in/
14     Flora                                                     http://www.efloras.org/index.aspx
                                                                 http://florakarnataka.ces.iisc.ac.in/hjcb2/
                                                                 http://www.flowersofindia.net/
                                                                 https://thewesternghats.indiabiodiversity.org/
                                                                 https://indiabiodiversity.org/
15     Birds                                                     https://thewesternghats.indiabiodiversity.org/
                                                                 https://indiabiodiversity.org/
                                                                 https://avibase.bsc-oc.org/avibase.jsp ?lang=EN Search for
                                                                 location based checklist (example: Bird checklist of Kodagu)
16     Fish                                                      http://www.fishbase.org/search.php
17     Agro-climate                                              http://www.agriinfo.in/?page=topic &superid=1&topicid=425
18     District information                                      Search for specific district webpages (NIC)
19     WRIS (Water Resources Information System)                 http://cwc.gov.in/water-resourcesinformation-system-wris
20     IUCN red list                                             http://www.iucnredlist.org
21     Meteorology                                               http://www.imd.gov.in/pages/main.php
                                                                 http://hydro.imd.gov.in/hydrometweb/ (S(lti4uw2ksxmtoyf
                                                                 03dotj2rk))/ DistrictRaifall.aspxhttps://www.india
                                                                 waterportal.org/met_data/
22     India Data portal Water Resource Departments              https://data.gov.in, https://kerala.gov.in/kerala-water-
                                                                 authority, https://gwssb.gujarat.gov.in/http://waterresources.
                                                                 kar.nic. in/introduction.htm, https://goawrd.gov.in/
                                                                 http://www.wrd.tn.gov.in/ https://wrd.maharashtra.gov.in/
       Research papers                                           https://www.sciencedirect.com/
                                                                 http://www.biodiversityjournal.com/
                                                                 https://www.researchgate.net/ https://scholar.google.co.in/
Source: https://www.epw.in/journal/2015/7/web-exclusives/surveys-and-wildlife-conservation.html http://learnline.cdu.edu.au
/units/sbi502/study_guide/wffs4.html https://www.esri.com/en-us/ what-is-gis/overview https://www.geospatialworld.net
/blogs/managing-the-environment-using-gis/https://currentaffairs.gktoday.in/ indias-national-environment-survey-kick-2019-
10201861787.html

                                                                                                     October-December 2019      7
FOCAL POINT: NEW DELHI
Sr.            LIST of ENVIS HUBS
No.
1 Environment Protection Training and Research Institute
    (EPTRI), Hyderabad
2 Department of Environment & Forests -Arunachal Pradesh
3 Assam Science, Technology and Environmental Council,
    Guwahati
4 Bihar State Pollution Control Board, Patna
5 Chhattisgarh Environment Conservation Board, Raipur
6 Gujarat Ecology Commission (GEC), Gandhinagar
7 Directorate of Environment & Climate Change Department
    (DoE&CCD), Chandigarh
8 Himachal Pradesh Council for Science, Technology and
    Environment (HIMCOSTE), Shimla
9 Department of Ecology, Environment and Remote Sensing,
    State Government of J&K
10 Forests & Environment Department, Govt. of Jharkhand
11 Environment Management & Policy Research Institute
    (EMPRI), Bengaluru
12 Kerala State Council for Science, Technology and Environment
    (KSCSTE), Thiruvananthapuram
13 Department of Environment & Forests - Kavaratti,
    Lakshadweep
14 State Environment Department, Maharashtra
15 Directorate of Environment, Dept. of Forests and Environment,
    Govt. of Manipur
16 Mizoram Pollution Control Board, Aizawl
17 Nagaland Pollution Control Board, Dimapur
18 Centre for Environmental Studies (CES), Forest & Environment
    Department, Government of Odisha
19 Puducherry Pollution Control Committee, Puducherry
20 Punjab State Council for Science and Technology (PSCST),
    Chandigarh
21 Department of Environment - Chandigarh                          13   Department of Zoology - University of Madras, Chennai
22 Rajasthan State Pollution Control Board (RSPCB), Jaipur         14   Institute for Ocean Management (IOM),Anna University, Chennai
23 Forests, Environment & Wildlife Management Department,          15   Indian Institute of Tropical Meteorology (IITM), Pune
    Gangtok, Sikkim                                                16   Indian Institute of Chemical Technology (IICT), Hyderabad
24 Department of Environment, Govt. of Tamil Nadu                  17   National Botanical Research Institute (NBRI), Lucknow
25 Tripura State Pollution Control Board, Agartala                 18   Gujarat Cleaner Production Centre (GCPC), Gandhinagar
26 Uttarakhand Environment Protection & Pollution Control          19   Department of Environmental Sciences (DES),Kalyani University,
    Board (UEPPCB), Dehradun                                            Nadia
                                                                   20   School of Planning and Architecture (SPA), New Delhi
Sr.                                                                21   School of Environmental Sciences Jawaharlal Nehru University
No. LIST of ENVIS RESOURCE PARTNERS                                     (JNU), New Delhi
1 Central Pollution Control Board (CPCB), New Delhi                22   Environment Protection Training and Research Institute (EPTRI),
2 National Institute of Occupational Health (NIOH), Ahmedabad           Hyderabad
3 Centre for Ecological Sciences - Indian Institute of Science     23   Institute of Forest Genetics and Tree Breeding (IFGTB),
    (IISc), Bengaluru                                                   Coimbatore
4 Centre of Advanced Study in Marine Biology (CASMB),              24   Thiagarajar College of Engineering (TCE), Madurai
    Parangipettai                                                  25   Institute for Wildlife Sciences (IWS), University of Lucknow,
5 Zoological Survey of India (ZSI), Kolkata                             Lucknow
6 Centre for Mining Environment (CME)IIT-Indian School of          26   Amrita Vishwa Vidyapeetham (AVV), Coimbatore
    Mines, Dhanbad                                                 27   The Energy Resources Institute (TERI), New Delhi
7 G.B. Pant National Institute of Himalayan Environment and        28   World Wide Fund for Nature - India (WWF), New Delhi
    Sustainable Development (GBPNIHESD), Almora                    29   Asian Development Research Institute (ADRI), Patna
8 Botanical Survey of India (BSI), Howrah                          30   Bombay Natural History Society (BNHS), Mumbai
9 Forest Research Institute (FRI), Dehradun                        31   Consumer Education and Research Centre (CERC), Ahmedabad
10 Wildlife Institute of India (WII), Dehradun                     32   CPR Environmental Education Centre (CPREEC), Chennai
11 State Council of Science and Technology for Sikkim (SCSTS),     33   International Institute of Health and Hygiene (IIHH), New Delhi
     Gangtok                                                       34   Salim Ali Centre for Ornithology and Natural History (SACON),
12 Central Arid Zone Research Institute (CAZRI), Jodhpur                Coimbatore

8   October-December 2019
The Dangs
                                                                   structure of this region is composed of
                                                                   Deccan Trap. Whereas, Upper Dangs is filled
                                                                   with hilly track and having thick forest cover
                                                                   with an altitude ranging from between 675
                                                                   and 1,290 meters above MSL.

                                                                   Soil of this region is black rock outcrops
                                                                   shallow black, brown and alluvial soils of
                                                                   recent origin. The four major rivers are Gira,
                                                                   Purna, Ambika and Khapri. The Gira and
                                                                   Khapri are major tributaries of Purna and
                                                                   Ambika respectively. Slope variation map is
                                                                   represented using GIS technology which is
                                                                   shown in Figure 2.

  Figure 1: Location Map of the Dangs District
The Dangs was known as “Dakaranya or
Dandak” during the period of Ramayana. The
smallest tribal district of Gujarat, is located in
the south western part of the state of Gujarat
in western India. A cluster of thickly forested
hills, the Dangs rising to the Sahyadri
mountain range, shares boundary with the
neighbouring state of Maharashtra. It is
bounded in the North by Surat (district of
Gujarat) and Dhule (district of Maharashtra),
in the east by Nasik (district of Maharashtra)
and West by Valsad District (district of
Gujarat). This is the only district of the Gujarat
state with high hills and rich forest.
Geography                                                           Figure 2: Slope Variation
The total geographic area covered is 1,776 sq.
km. It lies between 20° 33'50” to 21° 04' 52”           Climate and Rain fall
Latitudes and 73° 27'58” to 73° 56'38” Longitudes       The district enjoys dry climate throughout the year
and ranges between 300 to 1300 m Mean Sea Level         except during the monsoon season. The district has semi-
(MSL). Major physiographic region is terraced           arid climate. The year may be divided into four seasons.
topography with flat topped conical hills, small        The cold season from December to February is followed
plateaus and steep sided narrow valleys.                by the hot season from March to May. The period from
                                                        June to September constitutes the South-West monsoon
On the basis of physiographic climate, geology, soils   season. October and November may be termed the post
and natural vegetation, district is subdivided into     monsoon or retreating monsoon season.
two micro regions Lower Dangs and Upper Dangs.
The Lower Dangs is characterized by low hills and       The temperature varies between 9.2 C and 36.4 C.
thick vegetation cover with an altitude ranging         Average rainfall for the district is 1760 mm having
from 560 to 590 meters above MSL. The geological        spread over 90 rainy days.

                                                                                       October-December 2019   9
Demography Timru leaves, teak seeds and mahuda flowers and
There are total 311 villages and 3 Talukas named seeds are mostly collected during the summer which
Ahwa, Waghai and Subir. There are total 70 gram provides an alternative livelihood source.
panchayats: 3 Gram Panchayat and 3 Group Gram Manufacturing of various household bamboo
Panchayats. products is a major source of livelihood.
As per Census 2011, the total number of households Forest Cover
in the district are 48,448. Total population is The forest of Dang is classified under North Western
2, 28,291, of which males are 1, 13, 821 and females Ghats mist deciduous forest which lie within the belt
are 1, 14,470. Average literacy rate is 75.16% of of heavy rainfall and can be classified as South Indian
which in urban area the literacy rate is 73.42% and Moist deciduous forest (38%) and Southern Dry
for rural area it is 88.32%. The Dangs district stands Deciduous Forest (58%). The Dangs forests fall in the
at 1006 per 1000 male in sex ratio as compared to bio geographic zone 5 “Western Ghats” , under biotic
Gujarat state's sex ratio (919) which represents a province 5 A “ Malabar Coast “ and 5 B Western Ghat
good picture of the district. Sex Ratio in urban Mountains”.
region of the district is 1038 whereas in rural areas,
The total area under forest in the year 2015 is 1054.88
the sex ratio is 1002 females per 1000 males.
sq. km. which is 59.80% of total geographical area of the
Thematic map of population density of the region is
district. The Dangs is rich in timber as most of the trees
shown in Figure 3.
are of high quality teak. The total
forest area consists of two parts
namely, protected forest and
reserved forest, which are under
the jurisdiction of the Forest
Department, Government of
Gujarat. The reserved forest covers
864.17 sq. km. while protected
forest comprises of 190.71 sq. km.
The reserved forest is amongst the
richest forests in the whole of
Gujarat. The forest cover is
classified into three density
categories: very dense, moderate
dense and open Forest which
encompasses 209,745 and 414 sq.
km. respectively. The Government
of Gujarat has set up one wildlife
and one national park for
Figure 3: Population Density of the district preservation of wildlife i.e. Purna
wildlife sanctuary is located around
The entire district is tribal dominated with 98% of its (160 sq. km) Purna River in the northern part and the
total population. The language spoken amongst Vansda National Park in the southern part with an area
people is basically Konkai which is very much of 23.9 sq. km. The important animal species are hyena,
familiar with Gujarati and Marathi. Dangi dance is sambar, chital, barking deer and monkey.
famous in local culture. It is famous in India and in
foreign countries as well. Warli painting and The district with its characteristic topography, is rich in
Bamboo crafts of tribal is famous across the country. forest cover in the whole of Gujarat. Forest covers more
Most of the people depend on agriculture (42.1%) than 50% of its geographical area of the district. Its
and they are also engaged in animal husbandry, natural resources is rich in timber and teak of high
daily wages activities and other services . The quality. As per census 2011, The Dangs is the least
collection of Non Timber Forest Product (NTFP) is populous district of Gujarat and is dominated by tribes.
still a major source of livelihood for the people.
10 October-December 2019Districts under National Environment Survey
Consumer Education Research Center-ENVIS • The district is a storehouse of number of
Resource Partner (CERC-ENVIS RP) has selected The medicinal plants, many of them still unexplored.
Dangs district to study under National Environment • The district was once dominated by various types
Survey - Grid based Decision Support System (NES- of wild animals. Even today, sloth beer, panthers,
GRIDSS) in a first phase. It requires collection of etc. is usually sighted in the remote part of the
primary data, secondary data, preparation of district.
thematic maps and district mapping to facilitate
policy decisions at all levels of government. • Although annual rainfall is high, as compared to
the state average, in the district, there is an
The reasons for the selection of this district are as eventual deficit of drinking water during summer
follows: season.
The above reasons make the district vulnerable to
• Dangs district is situated in the Southeastern
degradation of eco-sensitive / hot spots zones.
part of the Gujarat state. It is district primarily a
tribal dominated district having 73% of its land Sources: http://censusindia.gov.in/,
is covered under Reserved & Protected forest. https://planning.gujarat.gov.in/,
• The terrain of the district is hilly / undulating https://dangs.gujarat.gov.in/
dissected by a network of streams and rivers. http://dcmsme.gov.in/dips/2016-
17/12.%20Dang%202016-17.pdf
ENVIS Secretariat has also allotted five other districts of Gujarat to
CERC-ENVIS RP which is shown in Figure
Figure : Districts allotted under NES-GRIDSS
October-December 2019 11Figure: Shannon index computed for each village separately. It can be seen that west Dangs is rich in biodiversity
while the east part of Dangs is still lacking in diversity.
Courtesy: Summer Internship on 'Biodiversity Mapping of The Dangs District using Multi-Temporal Satellite
images and Dynamic Time Wraping (DTW) Algorithm by Mr. Arav Saha and Mr. Srikumar Sastry, Dhirubhai
Ambani Institute of Information and Communication Technology DAIICT, Gandhinagar.
The Environmental Information System acronymed as Periodical Printed & Published By
ENVIS was implemented by the Ministry of Environment Project Coordinator, CERC-ENVIS Resource Partner
& Forests by end of 6th Five Year Plan as a Plan Scheme On Behalf of Consumer Education & Research Centre,
for environmental information collection, collation, “Suraksha Sankool” Thaltej, Sarkhej-Gandhinagar Highway,
storage, retrieval and dissemination to policy planners, Ahmedabad 380 054, Gujarat, India.
Phone : 079-27489945/46,27450528, Fax : 079-27489947
decision makers, scientists and environmentalists, Email : cerc-env@nic.in, cerc@cercindia.org
researchers, academicians and other stakeholders. Website: http://cercenvis.nic.in, www.cercindia.org
https://www.facebook.com/EcoProductsEcoLabeling
The Ministry of Environment and Forests has identified Write to us: We value your views and suggestions. Please send
Consumer Education and Research Centre (CERC), your feedback on this issue. We would also like to invite your
Ahmedabad, as one of the Resource Partners to collect contributions on the Eco Product and Eco Labelling.
and disseminate information on “Environment Literacy - Disclaimer
Eco-labelling and Eco-friendly Products”. The main objective The material used in this newsletter does not necessarily
of this ENVIS Resource Partner is to disseminate represent the views of CERC or ENVIS.
information on Eco products, International, and National Printing
Eco labeling programmes. Print Express Pvt Ltd., Ashram Road, AhmedabadYou can also read