Economic Tectonics: An Economic & CRE Conditions Outlook - KC Conway, CCIM, CRE, MAI
←
→
Page content transcription
If your browser does not render page correctly, please read the page content below
Economic Tectonics:               KC Conway, CCIM, CRE, MAI
                                        CCIM Institute Chief Economist
An Economic & CRE Conditions Outlook
                                          Principal & Co-Founder of
                                            Red Shoe Economics

                                           KC@RedShoeEconomics.com
                                           www.RedShoeEconomics.com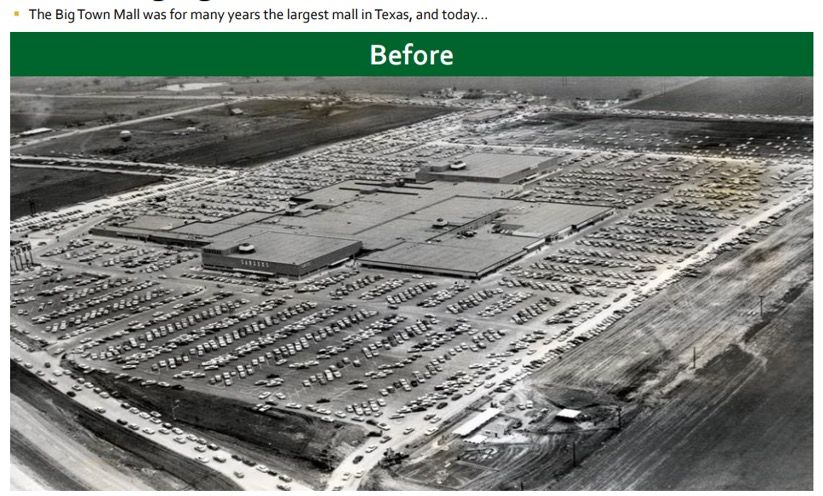
Disclaimer:                           Not in the fine print…

     Fort Bend Economic Development Council Virtual Meeting
              K.C. Conway, CCIM, CRE, MAI and CCIM Institute Chief Economist

This presentation reflects the analysis and opinions of the author, K. C. Conway,
but not necessarily those of Fort Bend Economic Development Council, CCIM Institute,
Monmouth MREIC or Red Shoe Economics.

Neither Fort Bend Economic Development Council, CCIM Institute, Event Sponsors,
Monmouth MREIC, nor Red Shoe Economics make any representations or warranties about the
accuracy or suitability of any information in this presentation. The aforementioned do NOT
guarantee, warrant, or endorse the advice or services of K.C. Conway, CCIM, CRE, MAI.
This presentation
          Associationconsists  of materials
                       for Corporate  Growthprepared exclusively by K.C. Conway, CCIM, CRE,
MAI and is provided during this event solely for informational purposes of attendees. This
presentation is not intended to constitute legal, investment or financial advice or the rendering of
legal, consulting, or other professional services of any kind.

                                         KC@RedShoeEconomics.com

                                                                                                       2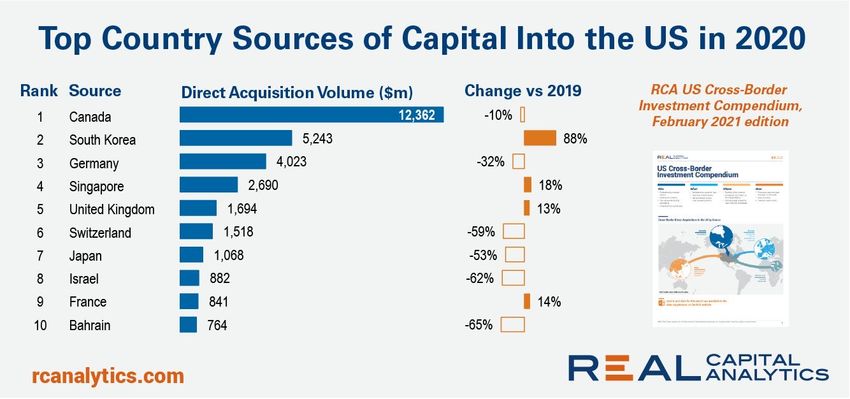
Economic Outlook for 2021

      2021 Outlook: The Year of Yogi
       • “The future ain't what it used to be.”
                                           2020 Elections – AZ ballot audit
       • “It ain’t over till it’s over.”   Crypto-currency debate
                                           Fed Monetary Policy uncertainty

       • “You’ve got to be very careful if you don’t
         know where you are going, because you
         might not get there.” KSU CP or CN Rail Merger

       • “You better cut the pizza in four pieces
         because I’m not hungry enough to eat six.”
         (And Yogi didn’t even have an HP-12c)
                                                             3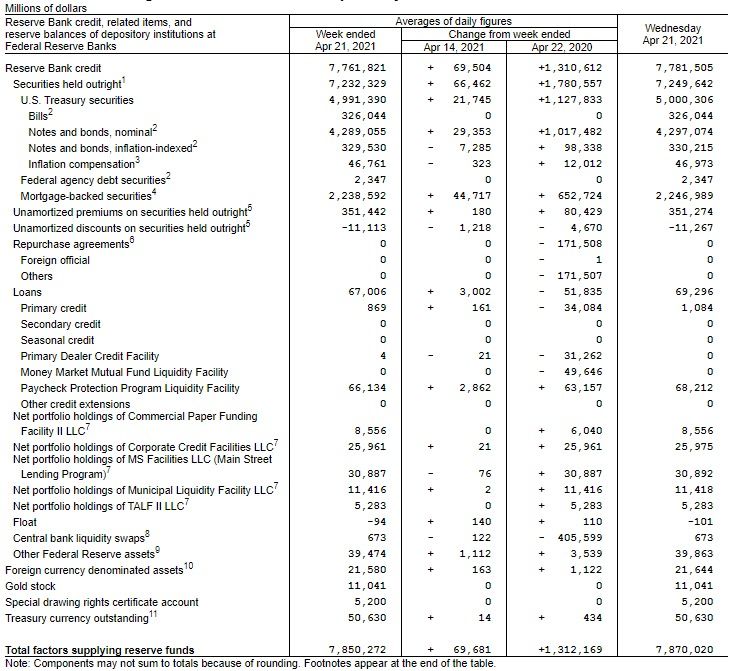
The U-Haul Report: Where did Americans move in 2020?
                                          2020 Migration Trends: U-Haul Ranks 50 States by Migration Growth
                                       TX is typically ranked among top 2 states for inbound moves – Beat out FL

                                                                         U-Haul customers made Texas and Florida their
         Tennessee (#12 2019)        11.   Arkansas (#23 2019)           top two destinations from 2016-19. Texas had the                      40.   Michigan (48) Moving Up
1.
         Amazon HQ2 kicking in                                           largest net gain of one-way U-Haul trucks for
                                     12.   Indiana (9)                                                                                         41.   Pennsylvania (46)
                                                                         three consecutive years before Florida flipped
2.       Texas (#2 - Steady)                                             the order and became No. 1 last year. Texas is
                                     13.   Wisconsin (41)                                                                                      42.   New York (43)
3.       Florida (1)                                                     second for growth, and Florida third, for 2020.
                                     14.   Oklahoma (14)                                                                                       43.   Connecticut (34)
4.       Ohio (7)      AZ only state in                                  Ohio, Arizona, Colorado, Missouri, Nevada,
                                           South Carolina (4) (#2 by                                                                           44.   Louisiana (40) Hurricanes?
5.       Arizona (20) Top-5 in BOTH 15.    United Van Lines 2020)
                                                                         North Carolina and Georgia round out the top 10
                         United Van                                      states for 2020 growth as self-movers continue to                     45.   Oregon (29)
6.       Colorado (42) Lines & UHaul 16.   West Virginia (22)            migrate to the Southeast, as well as markets in the                   46.   Maryland (45) The EXIT
                                                                         Southwest, Midwest and Rocky Mountain regions.
7.       Missouri (13)               17.   Utah (8) Understated!                                                                               47.   Massachusetts (47)
8.       Nevada (24)                 18.   Kentucky (37)                 California ranks last by a wide margin, supplanting
                                                                         Illinois as the state with the greatest net loss of U-                48.   New Jersey (44)
9.       North Carolina (3)          19.   Montana (26)                  Haul trucks. California has ranked 48th or lower                      49.   Illinois (50)
10.      Georgia (16)                20.   Minnesota (15)                since 2016. Illinois has been 49th or 50th since
                                                                         2015, when U-Haul began ranking states based on                       50.   California (49)
                                                                         annual net gain.

     Methodology: Growth states are calculated by the net gain of one-way U-Haul trucks entering a state versus leaving that state in a
     calendar year. Migration trends data is compiled from more than 2 million one-way U-Haul truck customer transactions that occur annually.
                                      https://www.uhaul.com/Articles/About/22746/2020-Migration-Trends-U-Haul-Ranks-50-States-By-Migration-Growth/

                                                                                                                                                                          4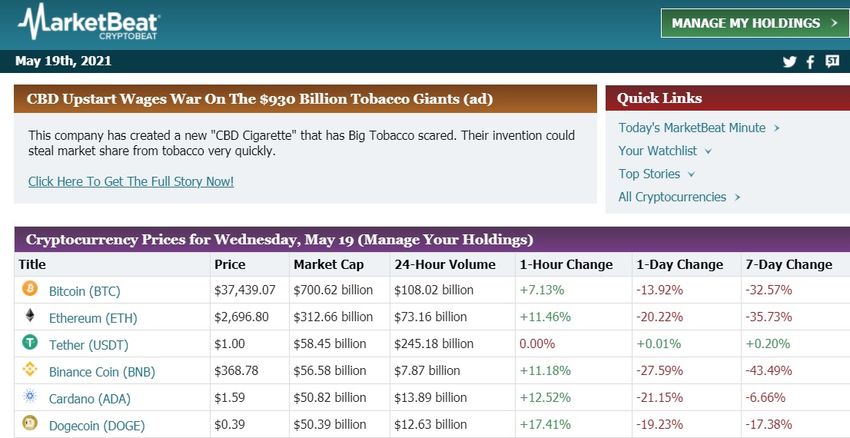
San Antonio – Navistar
                                                                       TX has 2nd largest GDP among all 50
     Springhill TN – Cadillac EV
                                                                       states and within top 10 among all
     Huntsville – Space Command HQ                                         key SS categories except 1:
                                                                            Career Readiness - really?
     MD – New Cash Printing Plant                                              Why a #26 ranking?

https://siteselection.com/issues/2021/jan/state-of-the-states-2021-cover.cfm                         5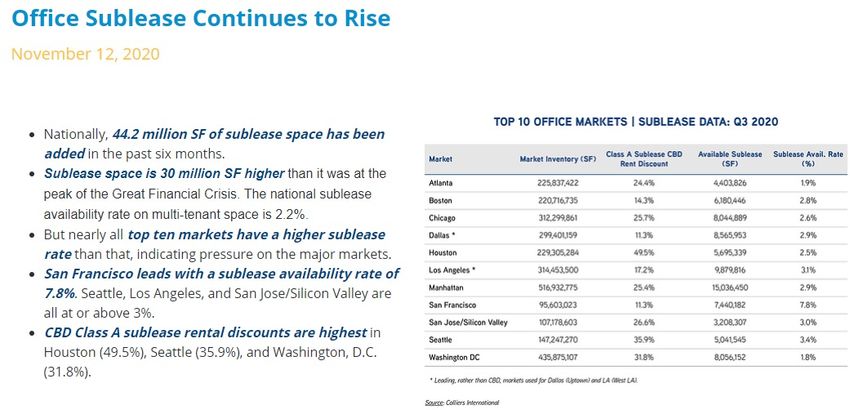
2020 Census: TX #3 in % change, #1 in absolute number

TX’s +15.9% population growth
ranks #3 in 2020 Census :
                                                                                                                             What’s going on nationally?
§ Utah #1 with +18.4%                                                                                                        The U.S. population increased by 7.4%
§ Idaho #2 with +17.3%                                                                                                       since the last census from about 309
§ Texas #3 with +15.9%                                                                                                       million to 331 million – the slowest
                                                                                                                             growth rate the nation has seen since
   Note UT & ID much smaller                                                                                                 1940.
  states so TX +15.9% is #1 in
  absolute population increase.                                                                                              Regionally, the South saw more than
                                                                                                                             10% increase in population, followed
§ IL – worst in Midwest -0.1%                                                                                                by the West, Northeast and Midwest.
§ NY & PA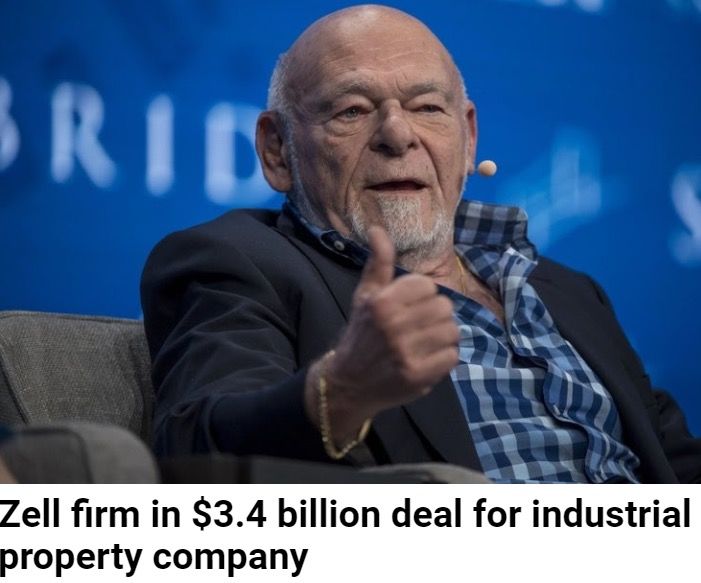
GDP: Ignore the Atlanta FED’s GDPNow
                                                                                                               Just don’t partake in Atlanta Fed’s GDP
                                                                                                                       Now (aka GDP Wrong).
                                                                                                             “Atlanta Fed's GDPNow rises to 34.6% for
             https://www.atlantafed.org/-/media/Documents/cqer/researchcq/gdpnow/RealGDPTrackingSlides.pdf   Q3 after US data” (Oct 2020)
                                                                                                                  And… Q2 2021 forecast at +13.3%
                                                                                                             The Q1 2021 forecast “Now” was 5.7% with
                                                                                                             a Min/Max range of 4.5% to 10% (looks
                                                                                                             more like a Cap Rate Survey range)

“GDPNow is not an official forecast of the Atlanta Fed. Rather, it is best viewed as a running estimate of
real GDP growth based on available economic data for the current measured quarter. There are no
subjective adjustments made to GDPNow—the estimate is based solely on the mathematical results of the
model.
In particular, it does not capture the impact of COVID-19 and social mobility beyond their impact on GDP
source data and relevant economic reports that have already been released. It does not anticipate their
impact on forthcoming economic reports beyond the standard internal dynamics of the model.”

                                                                                                                                           7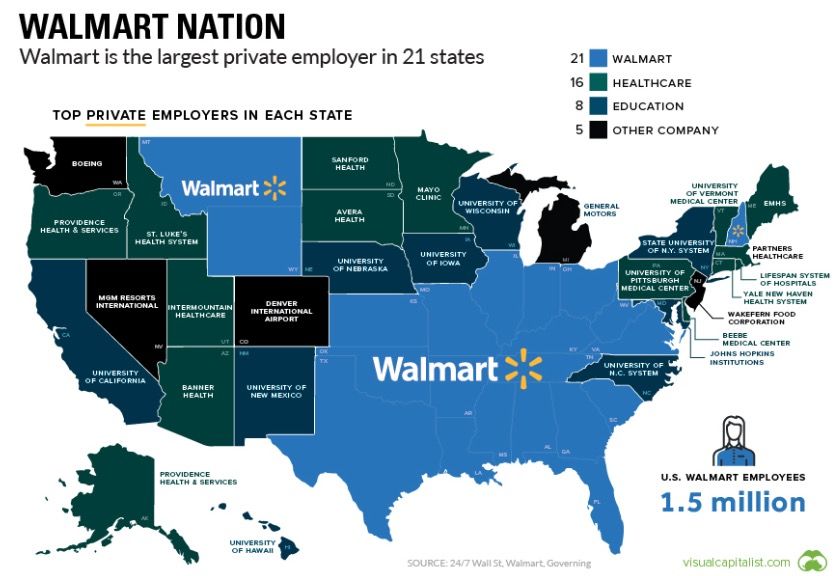
GDP by State (2020 YOY): What’s driving your State’s Economy? FL in Top-5

       TX Ranks #2 @ $1.7trillion                     Most GDP Decline in 2020 was                                   Least GDP Decline in 2020 was
     ahead of NY, FL and all in South.                    NV, TN & HI at >40%)                                              UT & AZ $500b and MA, VA
TX > NY, FL > IL, GA > NJ, NC > MA & VA                                                         CO, AZ & TN are in a horse race to surpass $400b

                                              https://www.iowaeda.com/50states/
                           https://www.statista.com/statistics/248053/us-real-gross-domestic-product-gdp-by-state/

                                                                                                                                           8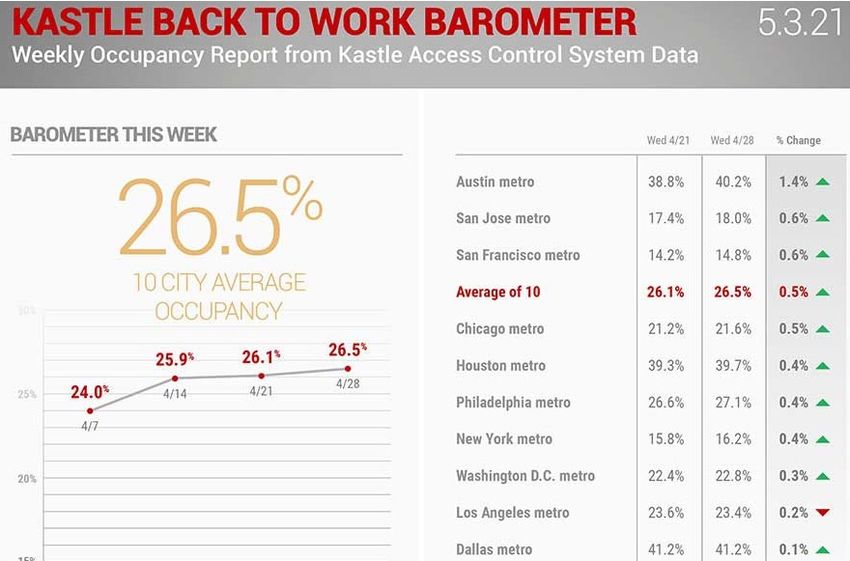
Employment: A JOLTS picture reveals a key number, 8.1 million!

   JOB OPENINGS AND LABOR TURNOVER Report Released May 11 for March 2021 period:
   The number of job openings reached a series high of 8.1 million on the last business day of March, the
   U.S. Bureau of Labor Statistics reported today. Hires were little changed at 6.0 million. Total separations
   were little changed at 5.3 million. Within separations, the quits rate was unchanged at 2.4 percent while
   the layoffs and discharges rate decreased to a series low of 1.0 percent

                                    https://www.bls.gov/news.release/pdf/jolts.pdf                               9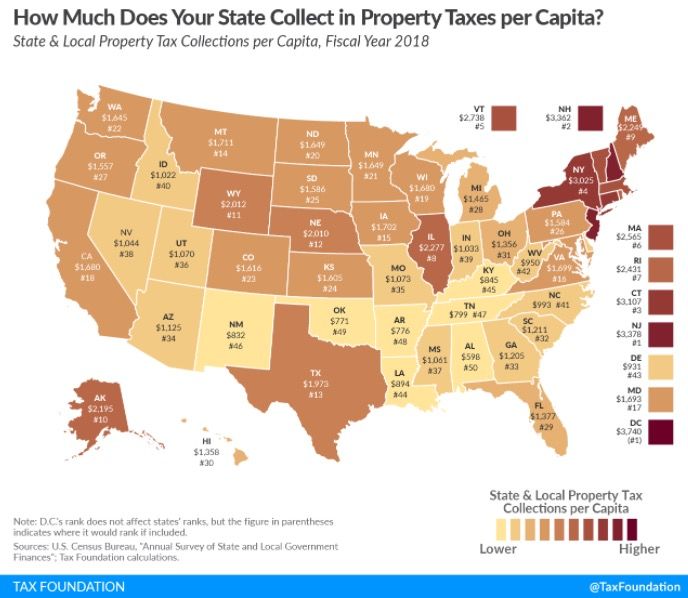
Houston Employment: A gain of 160k jobs since April 2020.

                                                                                               136k of the 160k
                                                                                              YOY gain are in the
                                                                                              2 “L&T” categories.

                                                                                 Trade, Transport & Utilities #2 job
                                                                                 gain category (Port, Logistics like
                                                                                 Amazon, Dollar Tree, Aldi, FedEx,
                                                                                 Home Depot, etc.)
                                                                                      The “other L&T” is #1 job
                                                                                      gain category

           https://www.dallasfed.org/research/indicators/hou/2021/hou2105.aspx                            10
Fort Bend Employment: It’s not so much Energy?
Fort Bend County website and
information resources are as good as they
get any where in the U.S. – Nice Job!
https://fortbendcounty.com/data-and-research/workforce-pipeline 11Who now is Largest US Private Employer? WALMART (#1 in 21 states)
Walmart Nation
Walmart is the biggest company in the world by
revenue, and there are over 3,500 Walmart
Supercenters spread around the United States
alone. It takes about 1% of private sector
workforce in the United States to keep this
massive fleet of big box stores running. In
Arkansas, that figure jumps up to 4%, with about
one-third of the total retail workforce employed at
the retail giant.
Top Walmart
States for Jobs:
#1 TX
#2 FL
#3 GA
#4 IL
#5 AR
https://www.visualcapitalist.com/walmart-nation-largest-employers/
123 Types of Economic Tectonics:
CONVERGENCE DIVERGENCE LATERAL SHIFT
§ The FED & Monetary Policy § Housing: MF in particular § Remote Work: Population and
Underneath the surface are tools beyond § State Taxes: Mitigate anticipated higher Workforce migration (Urban to
interest rates (Asset Purchases to Federal Taxes suburban and Secondary MSAs)
mitigate rise of 10-Yr Tr., Bank ALLL on § Retail: Order online “& Deliver to me” § CRE Credit Metrics: Hotel and Retail
lending, IOER, etc.) Groceries, Home Improvement, as most distressed could shift in a
§ Inflation: Look beyond CPI & PPI to Sporting Goods, Health & Beauty vaccinated economy as Leisure Travel
Construction-nomics, Energy, Home shifting to “Leisure & Travel” now rises and Retail reopens.
Prices vaccinated? § Capital Flows into CRE: Watch
§ Supply-Chain: Choke Points & re-shoring § Hotel: Boom Leisure (not-so-much Bus. Korea for more and ask:
§ Site-Selection in a more influential ESG § Earnings: Away from Tech & “Stay-at- Why are Banks doing
environment (GA Election Law & DEI) Home” economy. loan sales Vs Workouts?
13CONVERGENCE: What pressures lie beneath the surface?
FED Balance Sheet from $7.00 Tr today
§ The FED & Monetary Policy
Underneath the surface are tools beyond interest rates,
such as, Asset Purchases to mitigate rise of 10-Yr Tr.,
Bank ALLL and IOER to accelerate or slow lending, etc..
Inflation is out of the bottle! What are CRE Investors’ forecast for the
10-Yr Treasury & impact on Cap Rates? Cap
There is a correlation to what is occurring with price Rates reflect the Principle of ANTICIPATION
of Bitcoin (>$60k/coin to $30k May 19) and value of not “Rear-View Mirror”
the U.S. Dollar. And despite Fed Chair Powell’s
statement on 60 Minutes Apr 11th, it’s not that
American like or dislike cash! What’s the CRE
impact?
https://www.statista.com/statistics/1121448/fed-balance-sheet-timeline/
14CONVERGENCE: FED Balance Sheet pressures!
$4.3 Tr in Corp Notes &
Bonds, like Berkshire
FED buying MBS
prevented another
Housing Crisis - From
2.2 Tr in 12
FEDERAL RESERVE months
statistical release
Release Date:
Thursday, April 22, 2021
Not much Gold or Crypto
$7.9 Tr
https://www.federalreserve.gov/releases/h41/current/h41.htm#h41tab1 15CONVERGENCE: Crypto Fall correlated to FED & China
Bitcoin $60k to $30k at May 19
trading-day low is an effect of
Fed Monetary Policy and
China’s burgeoning Digital
currency to undermine the US
Dollar as the Reserve Currency.
The FED and China are the 2
bad-actors in this crypto
currency saga. Forecast:
Bitcoin is $80k by Q1 2022.
16CONVERGENCE: What pressures for Inflation?
Inflation:
It’s >4% for Food; >9% autos; >15% Housing & >6% for Building Materials
https://www.enr.com/ext/resources/static_pages/Economics/2021/0412_CE_WK2.pdf?oly_enc_id=4591H9390467C1Y
§ Inflation: Look beyond
CPI & PPI to
Construction-nomics,
Energy, Home Prices.
Inflation Source:
Bill Bonner, Editor, Bill
Bonner’s Diary – May 2021
Bill Bonner:
Yes, inflation is here. It is
showing up all over the
place – in commodities,
food, housing, and fuel.
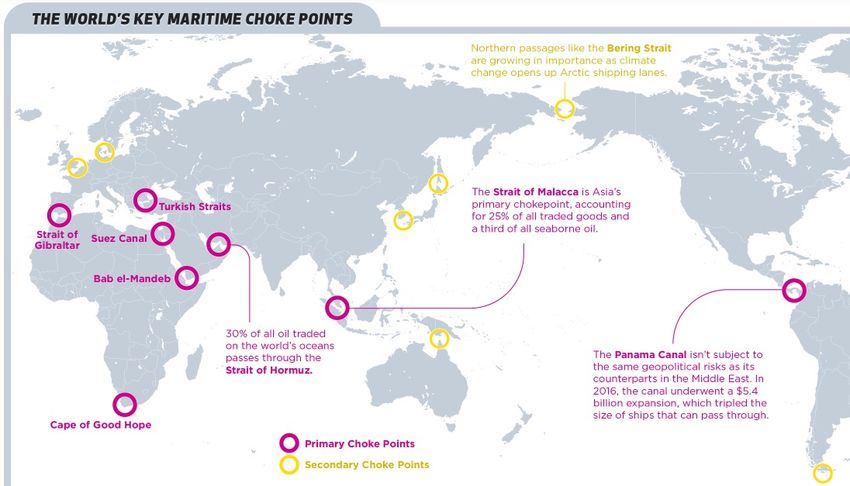
17CONVERGENCE: What pressures in Supply-Chain?
§ Supply-Chain:
Choke Points
https://www.visualcapitalist.com/mapping-the-worlds-key-maritime-choke-points/
18Condition of Logistics Infrastructure: ASCE every 4-Year Report Card For more than 20 years, the American Society of Civil Engineers (ASCE) has been releasing its quadrennial Report Card for America’s Sky Harbor Airport Exception Infrastructure. https://source.asce.org/asces-2021-report-card-marks-the-nations-infrastructure-progress/ 19
Condition of Logistics Infrastructure: ASCE Vs. Biden Infrastructure Bill

                                                                                              https://www.whitehouse.gov/briefing-room/statements-
                                                                                              releases/2021/03/31/fact-sheet-the-american-jobs-plan/

                                                                           The White House’s fact sheet acknowledges that there are at least 173,000 miles of
                                                                           major U.S. highways and other heavily trafficked roads in disrepair, as well as an
                                                                           estimated 45,000 bridges in need of rebuilding. However, Biden proposed
                                                                           infrastructure spending bill would address a mere fraction of the current need – a
                                                                           mere 20,000 miles of roadways and only 10,000 bridges.

                                                                           The Biden plan also intends to target roads and bridges in the nation’s most populated
                                                                           states and MSAs, such as New York and California. Yet the ASCE report notes the need
                                                                           is great in states like Iowa (state with most bridges in need of repair), Missouri, and
                                                                           Louisiana. This proposed legislation will take many forms before it is voted upon in late
                                                                           summer or early fall 2021. For now, it is important for commercial real estate
                                                                           professionals to focus on the needs that are documented in the ASCE IRC report, and to
                                                                           recognize that the politics in this legislation are likely to dictate the amount that is
                                                                           directly allocated
                                                                           https://www.whitehouse.gov/briefing-room/statements-releases/2021/03/31/fact-
                                                                           sheet-the-american-jobs-plan/

                                                                                                                                                                  20
https://source.asce.org/asces-2021-report-card-marks-the-nations-infrastructure-progress/
Last Mile Logistics: The
Final and Most
Expensive Link In the
Supply Chain
Presented by
KC Conway, CCIM, CRE, MAI
CCIM Institute Chief Economist
KC@RedShoeEconomics.com
21CONVERGENCE: Sam Zell just put his stamp on Logistics!
Equity Commonwealth to Buy Industrial REIT Monmouth for $3.4B
“The transaction provides Equity Commonwealth with a high-
quality, net-leased industrial business with stable cash flows, says
Chairman Sam Zell. By Erika Morphy | May 05, 2021
“Monmouth’s portfolio consists of 120 properties totaling 24.5 million square
feet. In addition, Monmouth has 6 properties totaling 1.8 million square feet
under contract and leased to investment grade tenants. Closings for these
acquisitions are expected in 2021 and 2022.
The transaction is expected to close during the second half of 2021.”
And all but 5 of the 120 Properties are in what KC Conway defined as the
“Golden Triangle” back a decade ago. (KC is a Director on MNR Board).
The Golden Triangle: Industrial and e-commerce investment is clustering around a region I
have long defined as the “Golden Triangle”. The term describes a geographic region that extends
from the pinnacle at the Great Lakes southwest to Texas and the Gulf Coast to form one side and
southeast through Tennessee, Alabama, Georgia, the Carolinas and Florida on the other. This
region is “golden” in large part because it encompasses five of the seven Class I railroads, more ports
than any other two regions of the U.S. and 70 percent of the American population. In other words,
the “Golden Triangle” is the epicenter of logistics infrastructure and where the dominant e-
commerce, package delivery and retail companies are locating their “order online and deliver to
me” warehouses.
In fact, the Golden Triangle now surpasses the West Coast market in virtually every metric, such as
new construction, transaction activity, and pricing. So, it is no surprise that the Golden Triangle is
increasingly on the radar for institutional investors.
22
https://www.globest.com/2021/05/05/equity-commonwealth-to-buy-industrial-reit-monmouth-for-3-4b/?cmp_shareConvergence: Fort Bend Industrial – Monitor the New Supply
23As Amazon Gobbles Up Warehouse Space, NYC’s Suburbs
Keep Giving It Tax Breaks (BizNow May 12, 2021 by Miriam Hall)
FacebookTwitterLinkedInEmailPrint
Multiple tax incentive deals for suburban e-commerce facilities in New
York in recent months are raising questions as to how much taxes local
counties should forgo in order to lure the warehouses to their
jurisdictions.
Local officials argue the tax breaks are a small price to pay to lure well-
capitalized employers that will make use of dead space. But critics claim
companies like Amazon, run by the world's wealthiest man, don't
need tax breaks to develop warehouses they would likely
https://fortbendcounty.com/projects-and-success/project-wins build anyway.
KC Conway, the chief economist for the CCIM Institute who specializes
in industrial real estate, adaptive reuse and property tax, is urging local
BUT … Be thoughtful with any officials to tread carefully, and not undersell their assets.
incentives for Amazon. They “Amazon has huge datasets where they know where the packages are
going. They know the density and the proximity to key infrastructure
are coming to Fort Bend elements,” he said. “They're coming regardless of the incentive.”
regardless of incentives as a lot
of packages come to FB and He added that often Amazon and other manufacturing or logistics
companies don’t deliver on what they say they will do,
they need to have fulfillment “I would encourage more of these local governments to be thinking
centers here! carefully about what Amazon's doing and how much more automated
and robotic it's getting,” he said, noting the company's recent opening of
a robotics-powered center in Stone Mountain, Georgia.
https://www.bisnow.com/new-york/news/economic-
development/amazon-suburban-warehouse-incentives-108868
24CONVERGENCE: Logistics, Supply-Chain and Ports!
KSU merger: Kansas City Star May 13, 2021
In a turnaround, Kansas City Southern board
accepts Canadian National’s buyout offer
§ Port Freeport is staying on solid financial ground.
The port continues to garner excellent ratings.
Moody’s Investor Service has maintained an Aa2
rating for Port Freeport while Standard & Poor’s
raised the port’s rating from “A” to “A+”.2020 was
§ Ports the port’s busiest year yet.
§ Activity in the Freeport Harbor Channel is
Gulf & East Coast Vs West bustling. The Freeport Harbor Channel saw more
Port Freeport and Mobile are sailings in 2020 than ever before as roll-on roll-off
(ro-ro) cargo and LPG and LNG exports grew. Port
the two ports to watch to Freeport saw 1,136 vessel calls during calendar
surpass Ports of SC and GA year 2020, up 10.29% over CY 2019.
and dominate the Gulf-coast. § It’s a Go - In February 2020, the U.S. Army Corps
Association
Port Freeport is becoming to offor Corporate
Engineers (USACE)Growth
announced $19 million in
funding was included for the Freeport Harbor
Dallas what Port of Savannah Channel Improvement Project in the USACE FY
became to Atlanta. 2020 Work Plan. On June 25, 2020, a Project
KSU & Canadian Rail merger is Partnership Agreement (PPA) was signed between
Port Freeport and the USACE, officially moving
huge as well. CN is a win for the project into the construction phase
TX while CP is win for AL. https://www.portfreeport.com/about/annual-report
25Think 1-2 million TEUs
Vs 100k 3-5 years out.
These rankings will
skyrocket over the next
5 years along with Port
of Mobile to rival those
of Charleston SC today.
https://www.portfreeport.com/about/annual-report 26CONVERGENCE: What pressures for ESG/DEI?
§ ESG/DEI
Association for Corporate Growth
ESG will become a CRE Value consideration
just like it is now becoming in Debt Ratings!
https://www.krollbondratings.com/documents/press-release/31362/kbra-assigns-ratings-to-hertz-vehicle-interim-financing-llc-series-2020-1 27CONVERGENCE: What pressures for ESG/DEI?
In case you missed this on CNBC April 14th …
If anyone still thinks CRE is going to be unaffected by ESG or now DEI (Diversity, Equity and Inclusion), guess again.
It's more than Climate Change. It's more than having a woman or person of color on your Board.
Reflect on Corp Am. Response to GA new election legislation
And just like the assigned ESG scores by the likes of ISS and Glass Lewis, this "Diversity, Equity and Inclusion"
equity index on Corp America isn't always about getting the score or context right.
§ ESG/DEI If you don't know what's going on re ESG and DEI movement and become proactive in how your company is perceived, your
reality will be that you are not Diverse or Inclusive regardless of all the good you do in your Company &
Community.
28LATERAL SHIFT: Side-by-Side Transformation
Remote Work: Population and workforce migration (from urban to suburban and secondary MSAs)
CRE Credit Metrics: Hotel and retail as most distressed could shift in a vaccinated economy
as leisure & travel rises and retail reopens
Capital Flows into CRE: Watch Korea for more and ask, Why are banks doing loan sales
vs. workouts?
Housing – Hottest MF MSAs include Littlerock AR
Remote Work: Salesforce to Let Its Employees
Go Mostly Remote.
Salesforce, San Francisco's largest private employer, will
allow a large portion of its workforce to work remotely several
days a week and seek to shrink its real estate footprint.
“We’re not going back to the way things were,” Salesforce
Chief People Officer Brent Hyder said in an interview with
The Wall Street Journal. “I don’t believe that we’ll keep every
space in every city that we’re in, including San Francisco.”
The new policy will apply to most of Salesforce's 54,000
worldwide employees — including more than 9,000 in
San Francisco
Source: https://www.wsj.com/articles/most-salesforce-employees-to-work-remotely-at-least- Source: https://www.rcanalytics.com/us-cross-border-q420/
part-time-after-pandemic-11612897201 29 16LATERAL SHIFT: Office – Are we Returning to Work? Sublet is a key metric
https://view.usa.colliers.com/?qs=966a632e96b0d0f8e9800a1f1b4feeeea7fc525b662d562df57b43a3a555e2601b6
9ae7507c3043bba773f2dab5bb0bfd9784719fab04f926293d4db6a54290bddd16ae8858651d2
Association for Corporate Growth
Office fundamentals have softened rapidly in this cycle. Vacancies have moved quickly as sublease space has hit the market fast and furiously. Already 44.2 million SF
of sublease space has appeared in the past six months, with a national average of 2.2% availability for multitenant office, per CoStar. Major markets are facing a
disproportionate share of this space
Class A CBD sublease discounts vary from 10%-15% in Dallas (11.3%) and Boston (14.3%), to 32% in Washington, D.C., to 50% in Houston. Manhattan sublease space
is 25.4% below direct rents. With limited deal activity and still-high rates of remote work in many markets across the country, sublease space is expected to
continue to increase in the quarters ahead.
30LATERAL SHIFT: Office – Sugar Land metrics not trending post-Covid direction yet
31Office CRE:
The Other Metric
https://www.kastle.com/city-by-city-views-of-americas-office-use/ https://www.kastle.com/safety-wellness/getting-america-back-to-work/#workplace-barometer
Despite vaccinations, still only 1 in 4
of us returning to the office!
32LATERAL SHIFT: CRE Credit Metrics – Hotel as Proxy for a Shift
CRE Credit Metrics
Hotel serves as a proxy for the shift underway.
Following the recent downward trend of the overall delinquency rate, the lodging sector in February
also posted its largest drop in the delinquency reading since October 2020, dropping 272 basis
points to 16.38%. The drop in the February rate was concentrated in the ‘other’ and full-service
property subtypes, which saw declines of 705 and 169 basis back in November 2020.
This data from Trepp looks at the ten largest metropolitan statistical areas (MSAs) by delinquent
balance. The list is largely unchanged apart from Philadelphia, which replaced Seattle as the MSA
with the tenth-largest delinquent balance points. For March, the overall lodging rate fell even further,
dropping 41 basis points to 15.95%.
Hotel Loan
DQT and LTSS
Are Both
Appraisal
Flattening or Reductions Are
Declining as Still in a
Vaccination “Discovery Phase,”
Rate
But Also
Increases.
Flattening.
33 17LATERAL SHIFT: Housing – SF is move to Affordability; MF is too
Only 1 TX Mid-Sized Hub made the list – El Paso
https://www.rentcafe.com/blog/rental-market/market-snapshots/rentcafe-market-competitivity-report-april-2021/
34 17DIVERGENCE: State & Local Gov. Fiscal Health – Composition of State Revenue
On average, state and local
governments collected
$1,675 per capita in
property taxes nationwide
in FY 2018, but collections
vary widely from state to
state.
The highest state and local
property tax collections per
capita are found in the
District of Columbia
($3,740), followed by New
Jersey ($3,378), New
Hampshire ($3,362),
Connecticut ($3,107), New
York ($3,025), and Vermont
($2,738).
The lowest collections per
capita are found in
The five states with the highest average combined state Alabama ($598), Oklahoma
and local sales tax rates are Tennessee (9.55 percent), ($771), Arkansas ($776),
Louisiana (9.52 percent), Arkansas (9.51 percent), Tennessee ($799), and New
Washington (9.23 percent), and Alabama (9.22 percent). T Mexico ($832).
The five states with the lowest average combined rates
are Alaska (1.76 percent), Hawaii (4.44 percent),
Wyoming (5.33 percent), Wisconsin (5.43 percent), and
Maine (5.50 percent).
https://taxfoundation.org/state-property-taxes-reliance-2021/
35DIVERGENCE: Retail during Covid Vs. post-Vaccination?
Food
& Bev
Health &
Personal
care
Bldg
Materials Sporting
Goods
§ Retail: Order online “& Deliver to
me” Groceries, Home Improvement,
Sporting Goods, Health & Beauty
shifting to “Leisure & Travel” now
vaccinated?
Will we spend as much on F&B,
H&PC, Home-Impr. & Sporting
Goods post vaccination as during
Covid in CY 2020?
Amazon vs Walmart Vs Alibaba
models and growth?
36DIVERGENCE: Fort Bend Retail – on a path to recovery, but don’t add “Spec.”
§ Net Retail Absorption is Positive (+39k in Q1 2021)
§ Vacancy is trending down (6.9% in Q1 2021 vs >7% Q4 2020
§ BUT …
§ Rents are NOT yet increasing. “Fill up before Price Up”
37Adaptive Reuse: “Changing of the Guard”
3Q18 Commercial Real Estate
Insights Report
“Adaptive Reuse: Turning Blight into
Bright” represents the first step to
redefine and quantify the
adaptation of obsolete commercial
properties for new uses as an
institutional-grade product category.
Highlighting projects from across the
country, the 3Q18 report explores
the opportunities and challenges of
the new era of adaptive reuse.
https://www.ccim.com/insights/
38Evolve Thinking for Mall AdRu
Office in Malls? Universities in Malls (Emory/Northlake & 100 Oaks in N’ville)
After the Mall
Before the Mall AdRu
Atlanta: Emory Univ & Northlake Mall: Emory Healthcare is
injecting new energy into the revitalization of Atlanta's Northlake Mall.
Emory will move into the project's former Sears building, bringing over
1,600 employees onto the mall's campus. Emory will also occupy an
additional portion of the 1-million square foot retail center. Emory will
lease 224,000 square feet at Northlake, with an option for more space.
39Adaptive Reuse 2.0: Making Bright Brighter Again!
40DIVERGENCE Bank Failures: They’re back! Where is the Risk/Opportunity? https://www.fdic.gov/bank/historical/bank/ 41
Where are the Healthiest Banks & Credit Unions?
Texas Ratio                                         • A TX Ratio of 5% or below is considered healthy; above 10%-20% is concerning.
Developed at RBC Capital Markets, the
Texas      Ratio    is     a      relatively
straightforward and effective way to
determine the overall credit troubles
experienced by financial institutions. It is
determined by comparing the total
value of at risk loans to the total
value of funds the bank has on hand
to cover these loans. At risk loans are
any loans that are more than 90 days
past due and are not backed by the
government. The amount of funds on
hand consists of the loan loss allowance
that the bank has set aside plus any
equity capital.

For example, a bank with $65 million in
at risk loans and $72 million in cash on
hand to cover those loans would have a
Texas Ratio of $65mm / $72mm,
which is 90.3%. This figure is
approaching the 100% threshold,
which is considered very risky. You
can also look at the trend in this Texas              Woodforest National Bank: Founded in 1980 in Houston, Texas, is a privately-owned bank now headquartered in The
Ratio as an additional factor to tell if the          Woodlands, Texas. It operates well over 700 branch locations in several different states and offers both personal and
bank's financial health is heading in the             business depository banking products.
right direction.
https://www.depositaccounts.com/banks/health.aspx

                                                                                                                                                               42
Q2 is June 22, 2021
http://www.redshoeeconomics.com/news-events
43Red Shoe Economics is a private research firm exclusively supporting
today’s Commercial Real Estate industry in the areas of economics,
forecasting, and consulting. Our promise is to deliver unique views “eight
days a week” connecting the dots of all the daily market chatter to provide the
most concise and up to date information for successful CRE investments and
strategic outcomes. RSE is a majority woman owned minority business.
KC Conway, CCIM, CRE, MAI
Economics Forecasting Consulting Principal, Futurist
• Corporate Earnings • Key Note Presentations • CRE Expert Witness
• Tax Appeals Beverly Keith, CCIM, CRX
Reports • Red Shoe Review Principal, Business Strategist
• Ports & Logistics Trends (Newsletter) • MSA Market Level Monitoring
• Banking Regulations • Webinars (virtual ) • Site Selection Caylinn Peterson
Updates • Podcasts/Articles/ • Feasibility Studies Research Analyst
• Housing Economics Interviews • Valuation and Risk Analysis
• Environmental Risk • Real Estate Finance • Impaired Appraisals Stacy Barrington
• Bank Regulatory Compliance Operations
Management • Special Projects
• Macro EconomicsYou can also read