Sustainability and Responsibility - 2013 Summary Report - Tim Hortons sustainability report
←
→
Page content transcription
If your browser does not render page correctly, please read the page content below
Sustainability and Responsibility
       2013 Summary Report

          2013 Sustainability and Responsibility Summary Report   Page 1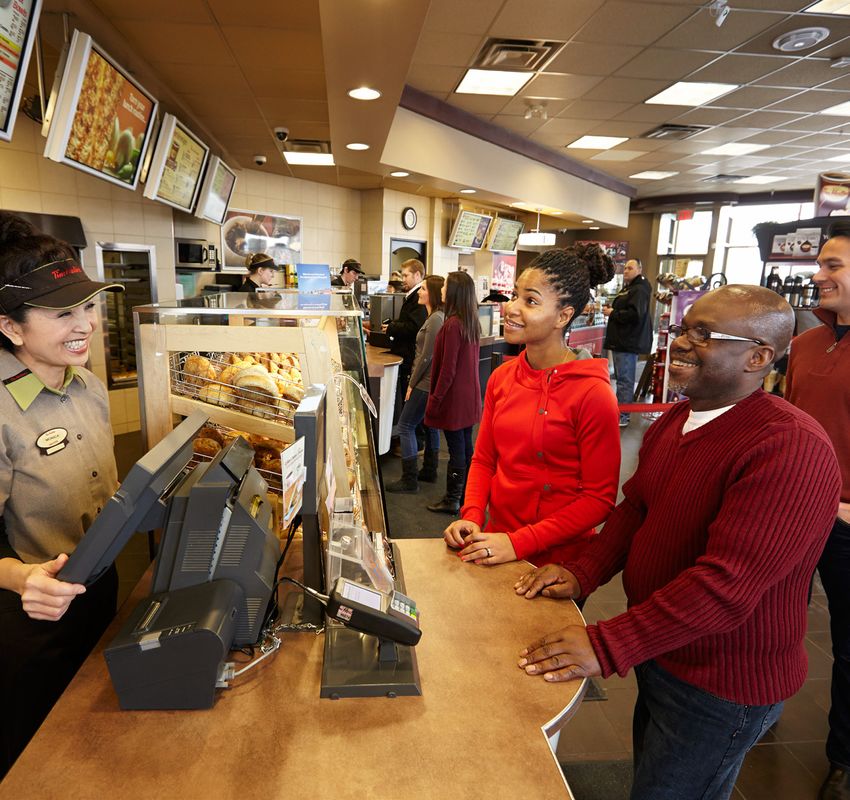
Table of Contents
 3 Welcome                                          16 H
                                                        orizons: Aboriginal Relations
 4 Executive Message                                17 P
                                                        artnership Blend Coffee, Third-Party Verification,
 5 About This Report                                   and Tim Hortons Coffee Partnership
 6 Governance and Strategy                          18 The Planet
 8 Individuals                                      19 The Planet Goals and Performance
 9 Individuals Goals and Performance                20 E
                                                        nvironmental Performance Summary,
10 Nutrition, Hospitality and Food Safety              and Independent Verification
11	Employees, Ethics, Restaurant Owner and         21 Our Greenhouse Gas Emissions, and Corporate Waste
    Team Member Training, and Partners              22 Environmental Stewardship at Our Restaurants
12 Communities                                      24 Corporate Operations
13 Communities Goals and Performance                26 Supply Chain
14 Tim Horton Children’s Foundation, Funding for   27 Our Online Sustainability and Responsibility Report Features
    Our Camps, and Community Initiatives            28 Contact Us
15 Timbits Minor Sports and Smile Cookie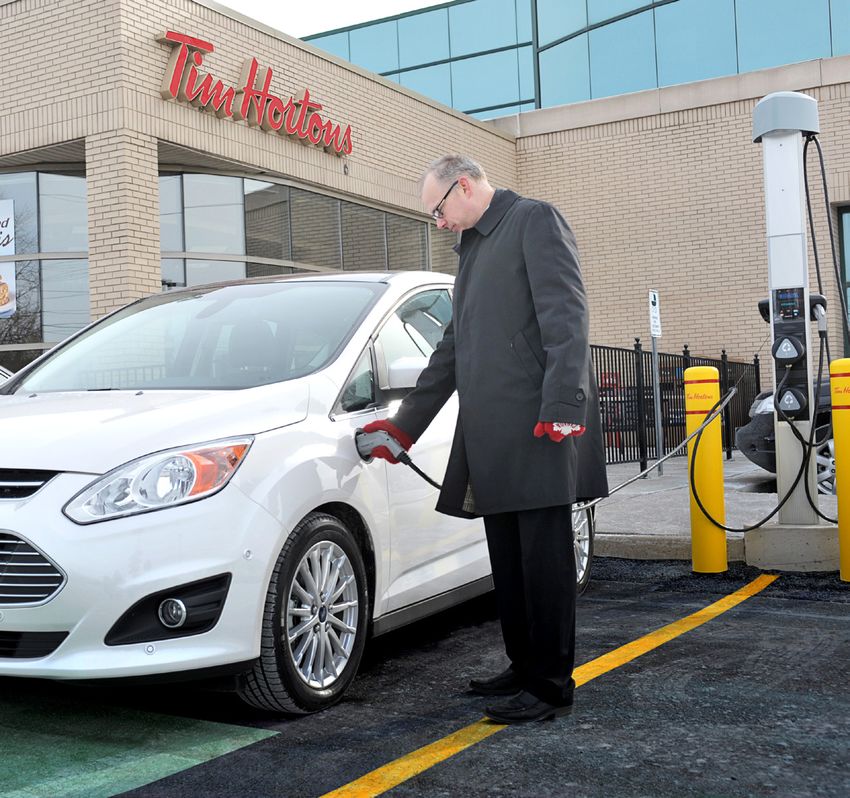
Welcome to our 2013 Sustainability and
                           Responsibility Summary Report.

This report provides an overview of our activities over the year and performance
against our goals and commitments. Our complete 2013 Sustainability and
Responsibility Report can be found online at sustainabilityreport.timhortons.com.

                               2013 Sustainability and Responsibility Summary Report   Page 3
Executive Message

“…I have seen that investing in the economic,
  social and environmental aspects of
  a business is necessary in communities
  where a business operates.”
 Marc Caira, President and CEO

 It is my pleasure to address you as part of the Tim Hortons     • Together with our Restaurant Owners, we raised
 2013 Sustainability and Responsibility Report for the first        $11.5 million on Camp Day for the Tim Horton Children’s
 time as President and CEO. I have been following this              Foundation;
 great Company’s success for many years. From my vantage
                                                                 • Since 2011 we have achieved a 35% reduction in water
 point of having previously worked for many years at a global
                                                                    consumption at our corporate offices;
 food and beverage company operating in approximately
 90 countries, I have seen that investing in the economic,       • From 2008 to 2012, we achieved a 12.5% overall
 social and environmental aspects of a business is                  improvement in distribution fleet fuel efficiency;
 necessary in communities where a business operates.
                                                                 • As part of the Tim Hortons Sustainable Food Management
 Making a True DifferenceTM is the overarching framework            Fund, we hosted an industry-wide Animal Welfare Summit
 that brings together all of our sustainability and                 at the University of Guelph, communicating new research
 responsibility programs and initiatives. At the foundation         on animal welfare and alternative housing systems,
 of Making a True Difference are the principles we use to           consumer expectations and supply chain economics; and
 help guide us on our sustainability journey.
                                                                 • We engaged PricewaterhouseCoopers LLP to conduct an
 As we have communicated previously, our overall vision for         independent limited assurance engagement on selected
 sustainability is to be a leader in the North American quick       environmental information in our 2013 Sustainability
 service restaurant sector and across all sectors in Canada.        and Responsibility Report. For details, please download
 To achieve our vision, sustainability and responsibility           a copy of PricewaterhouseCoopers’ Independent Limited
 are embedded in our strategies and corporate priorities.           Assurance Report on our website.
 Some highlights of our progress in 2013 include, but are
                                                                 We can take pride in what we have accomplished to date;
 not limited to:
                                                                 however, there is much more to be done. With respect to our
 • Being named to the Carbon Disclosure Project (CDP)           sustainability and responsibility commitments and goals, we
    Leadership Index for the second consecutive year as          have reported our 2013 performance and are continually
    one of the top disclosure scorers in Canada;                 looking at opportunities to enhance our performance.

 • As part of our sodium reduction initiative, for the second   Lastly, I maintain our commitment to comprehensive and
    consecutive year, we have reduced sodium in our soups        transparent reporting in the years to come. On behalf of
    (31%), deli meats (49%), muffins (25%), english muffin       Tim Hortons and our Restaurant Owners, I would like to thank
    in the U.S. (40%), and cheese croissant (25%, which also     you for your interest in our sustainability and responsibility
    had a 15% fat reduction);                                    journey, and we look forward to continuing to share our
                                                                 progress with you.

                                                                                        Marc Caira
                                                                                        President and
                                                                                        Chief Executive Officer

                                              2013 Sustainability and Responsibility Summary Report                      Page 4
About This Report

Report Scope and Reporting Standards
Our Report covers our 2013 fiscal year, which is the period from December 31, 2012 to December 29, 2013 (unless otherwise noted).
Our reporting boundary is outlined below.

                        1 For footnote, please see our Report Scope section at sustainabilityreport.timhortons.com.

                                               Our Making a True Difference Framework centres on our three focus areas: Individuals,
                                               Communities and the Planet. We prioritized the sustainability and responsibility issues based
                                               on an assessment of Company-wide risks and opportunities and on a review of alignment with
                                               current Company strategic plans. The issues that had the greatest perceived impact on our
Our Sustainability and Responsibility          business and on our stakeholders were:
Report has been prepared in
accordance with the GRI G3.1
Sustainability Reporting Guidelines.
Our complete GRI Index can be
found online.

Transparency in Reporting
We believe in being transparent when providing information to our stakeholders. We are pleased to report that in 2013 we were
recognized by the following organizations:
• We were named to the Carbon Disclosure Project (CDP) Leadership Index for the second consecutive year, placing in the top 20 companies
   in Canada for carbon disclosure
• We were named as one of the 50 Most Socially Responsible organizations in Canada by Maclean’s magazine
• We were named one of the 50 Best Corporate Citizens in Canada by Corporate Knights magazine
• We were named on the Global 100 Most Sustainable Corporations by Corporate Knights

For more details on how this report was developed, please see the Sustainability and Responsibility Process section online.

                                                        2013 Sustainability and Responsibility Summary Report                          Page 5
Governance and Strategy

Our Board of Directors governs sustainability and responsibility. The Nominating and Corporate Governance Committee of the Board
manages this accountability on behalf of the Board, including oversight for the development of our Sustainability and Responsibility
Policy. A summary of our sustainability and responsibility governance model is provided below:

For more information, please see the Sustainability Process and Governance sections online.

                                                2013 Sustainability and Responsibility Summary Report                            Page 6
Governance and Strategy

   Our Sustainability Strategy
   Our strategy execution and development follows a cycle of
   continuous improvement and engagement as outlined in the graphic
   to the left.

   In 2013, we continued to execute our priorities and activities
   developed as part of the strategy update we performed in
   2011. While we have made considerable progress to date, we
   continue to consider ourselves to be at the early stages of our
   sustainability journey. In 2014, we will once again review our goals
   and commitments and work with our stakeholders to establish a
   new sustainability strategy. We are excited about executing our
   strategic plan and showing additional progress in further embedding
   sustainability and responsibility across our company.

Stakeholder Engagement
We believe it is important to engage with stakeholders to understand issues, impacts, risks and opportunities that can affect our
organization. We engage a variety of different stakeholder groups to determine key priorities.

   Materiality
   We followed the GRI G3.1 Guidelines to determine materiality for our report. We evaluated both internal and external factors in
   defining material topics that have helped us establish and prioritize our sustainability and responsibility commitments and goals,
   our report content and boundaries, and the GRI indicators that we deemed important to report.

   For more information please see the Materiality and Defining Report Content section online.

Commitments and Goals
As part of our Making a True Difference framework, we developed overarching sustainability and responsibility commitments. Our
commitments are aspirational, long-term statements related to our most important sustainability and responsibility issues.

In addition to our commitments, we also set goals in each of our focus areas. Our goals are tangible, short-term targets that focus on
improving our performance. These goals are reviewed on an annual basis to maintain their relevance to our stakeholder expectations and
business. Progress with regards to our goals can be found throughout the Report.

                                                2013 Sustainability and Responsibility Summary Report                               Page 7
Individuals

Provide our guests with balanced choices.
Provide a hospitable and welcoming overall experience.

• Balanced Menu Choices
• Hospitality
• Food Safety
• Employees
• Transparent Reporting

                                 2013 Sustainability and Responsibility Summary Report   Page 8
Individuals

Individuals Goals and Performance
                  2013 Goal                                                                    Status          Performance Highlights
                  Nutrition                                                                                    • In 2013, we introduced gluten-free macaroons, turkey sausage
                  We will continue to work to enhance the availability of                                         breakfast sandwiches, and multigrain flatbread.
                  healthier options across our product categories and to                         GOAL MET
                                                                                                               • To date, we have reduced sodium in our soups (31%), deli meats
                  increase communication of the positive attributes and                                           (49%), muffins (25%), classic hot beverages (15%), chili (10%),
                  options within our menu.                                                                        english muffins in the U.S. (40%), and cheese croissants (25%,
                                                                                                                  including a 15% fat reduction).
                                                                                                               • New communication included a “Lighter Options” section on
                                                                                                                  our breakfast menu boards in the U.S. and a “Breakfast Value”
                                                                                                                  promotion highlighting items under 300 calories in Canada.
G u ests

                  Guest Services                                                                               • We achieved a response rate of 99.9% for 150,000 guest
                  We will work to maintain a 100% response rate on                                                inquiries in 2013.
                  enquiries that are received by Corporate Guest Services                        GOAL MET

                  where a response was requested by our guests.
                  Food Safety                                                                                  • 98.5% of our full-serve restaurants received at least two food
                  We are aiming for 100% of our full-serve restaurants to                                         safety audits in 2013. Remaining restaurants were audited in
                  receive at least two food safety audits every 12 months.                       GOAL MET         January 2014.
                  We will continue to aim for 100% of our corporate                                            • 99% of employees who directly influence restaurant operations
                  employees who directly influence restaurant operations                                          have up-to-date food safety certification and we launched our
                  to have up-to-date food safety certification, and we are                       GOAL MET         online training system. Remaining employees are scheduled for
                  aiming to launch an enhanced online training system that                                        re-certification in Q1 of 2014.
                  will allow a broader reach of participants in 2013.
                  Standards of Business Practices (SOBP)                                                       • 100% of our employees were educated on our SOBP and
                  All new corporate employees will be educated on our                                             additional Ethics and Compliance e-learning modules were
                  SOBP within their first year of employment and we will                         GOAL MET         developed and launched in 2013.
                  launch additional Ethics and Compliance e-learning
                  modules in 2013.
                  Training and Development                                                                     • We conducted an employment experience study, an engagement
                  Commitment: We will maintain our strong levels of                                               survey and several focus groups, which identified opportunities to
                  employee engagement and commitment through                                       GOAL
                                                                                                 PARTIALLY
                                                                                                                  enhance our overall employee experience. Task forces have been
                  feedback surveys, focus groups, and external                                     MET
                                                                                                                  developed to address improvement opportunities.
E mp l o y ees

                  benchmarking initiatives.
                  We will again work to improve our “under one year”                                           • We achieved a 15% improvement in our “under one year”
                  voluntary turnover rate by 10% in 2013.                                        GOAL MET         voluntary turnover rate compared to 2012.
                  Calibration: We will complete annual talent reviews for                                      • Performance and talent reviews were completed to evaluate
                  manager level and above in 2013.                                                                employee performance and potential across the organization.
                                                                                                 GOAL MET

                  Capability: 100% of our permanent corporate employees                                        • We were not able to measure our capability goal because we
                  will have an Individual Development Plan.                                                       decided to defer implementation of our talent management system.
                                                                                                GOAL NOT MET

                  Performance: 100% of our permanent corporate                                                 • We have completed 100% of our annual 2013 performance
                  employees will set annual goals aligned with business                                           reviews and goal setting.
                  objectives and will have an annual performance review                          GOAL MET

                  in 2013.
                  Restaurant Owners                                                                            • Close to 40 of our Restaurant Owners participated in roundtables
                  We aim to host our Restaurant Owner roundtables                                                 that focused on education and sharing of best practices
                  in 2013 and incorporate their feedback into our                                GOAL MET         with respect to sustainability and restaurant operations.
                  sustainability and responsibility strategy and initiatives.                                     Recommendations will be considered for future sustainability
P a rt n ers

                                                                                                                  strategy and programming.
                  Investors                                                                                    • We utilized the GRI Guidelines and received independent limited
                  We will continue to report using the GRI Guidelines, and                                        assurance from PricewaterhouseCoopers on select environmental
                  respond to both the Carbon Disclosure Project (CDP) and                        GOAL MET         indicators.
                  the Dow Jones Sustainability Index (DJSI).                                                   • We submitted responses to both the CDP and DJSI. We were
                                                                                                                  named to the Canada 200 CDP Leadership Index for the second
                                                                                                                  consecutive year.
                 For further details on our 2013 goals and performance, please visit our online Sustainability and Responsibility Report: sustainabilityreport.timhortons.com.

                                                                            2013 Sustainability and Responsibility Summary Report                                                Page 9
Individuals

Nutrition
We believe in giving our guests balanced choices and therefore offer a wide variety of menu items to choose from. We strive to provide
better-for-you options in each of our beverage and food categories. New communication this year included a Lighter Options section on
our breakfast menuboards and a Breakfast Value promotion highlighting items under 300 calories.

New better-for-you additions for 2013:

For more information, please see the Nutrition, Innovation and Communication section online.

   Hospitality
   At Tim Hortons, our guests are our number one priority. We strive to provide the
   ultimate guest experience that exceeds our guests’ expectations each and every time
   they visit our restaurants.
                                    Our commitment to the guest experience is a
                                    collaborative effort between our Restaurant Owners
                                    and our corporate offices. We recognize that our
                                    guests are looking for friendly, accurate and
                                    fast service, regardless of whom they contact.
                                    Our guest service teams were able to respond to
                                    99.9% of guest comments requesting response.
                                     Tim Hortons has a team dedicated solely to the
                                     development and execution of hospitality programs
                                     across the chain. An example of this would be the “Tim Cup Challenge,” which is a service competition
                                     that tests our Restaurant Owners’ and Team Members’ speed, order accuracy and friendliness.

                                                              Food Safety
                                                              At Tim Hortons, food safety includes the systems and standard operating
                                                              procedures that are carried out on a daily basis, throughout all areas of our
                                                              restaurants, to protect our guests. Our goal is that safe food be provided to
                                                              each and every guest, every day.
                                                              Our restaurant Food Safety Plan has been in place for many years and
                                                              our cross-functional teams work diligently every day so that food safety is
                                                              integrated into the development of our products and operational procedures
                                                              before they are introduced to the restaurants. Every new Restaurant Owner,
                                                              Manager of Business Development, Manager of Operations Standards,
                                                              Manager of Regional Training and Restaurant Opening Team Member
                                                              completes our food safety training and is certified before opening a restaurant.
                                                              We are focused on ensuring all employees are continually re-certified.

                                                              For more information, please see the Food Safety section online.

                                                  2013 Sustainability and Responsibility Summary Report                                  Page 10
Individuals
Employees
Our goal is to be one team, committed to delivering the ultimate guest experience.
This will be accomplished by offering an engaging work experience and a
compelling and differentiating employment promise. We are focused on creating an
environment that is conducive to ensuring the long-term health of our organization
and to make our company an employer that attracts, develops and retains highly
capable, highly engaged and highly performing Team Members.
We support a wide range of internal and external learning and development
opportunities for our employees, which are based on the following model: 70%
“on the job” development, 20% development through relationships, networking
and feedback, and 10% development through formal learning (training, courses,
books etc.).
Ethics
Operating in a fair and ethical manner has always been a core value at Tim Hortons.
Every employee is provided with, and must sign, a copy of our Standards of
Business Practices (SOBP) document that provides our expectations regarding
ethical business practices.
Restaurant Owner and Team Member Training
Tim Hortons University
The Tim Hortons University takes the training of Restaurant Owners and Managers very seriously and is committed to providing a customized
learning environment for all participants. They have five learning streams customized to the needs of each student: Tim Hortons Culture and
Coffee; Production; Floor Leaders; Restaurant Management; and Leadership.
For more information about our Restaurant Owner and Team Member Training visit the Online Report.
Team Tim Hortons Scholarship Program
The Team Tim Hortons Scholarship Program recognizes restaurant Team Members, their children, and their
grandchildren who give back to the community through volunteer work and who are pursuing post-secondary
education. Each year we award 200 scholarships in Canada and 20 scholarships in the U.S., worth $1,000
each. Provided that applicants continue to meet the eligibility criteria, they have the opportunity to qualify for
a Team Tim Hortons Scholarship up to five times!
Partners
2013 Restaurant Owner Sustainability and Responsibility Roundtables
In 2013 we hosted Restaurant Owner roundtables in four regions where we engaged
in discussions on sustainability issues, and sharing best practices used in their
restaurants.
The most common issues discussed at the roundtables were energy/water conservation,
effective waste management systems, increased communication and education on
sustainability programs and opportunities, and leveraging technology.
We plan on inputting feedback from our Restaurant Owners into our sustainability and
responsibility strategy and partnering with them on embedding value-add initiatives at
their restaurants throughout 2014.
For more information, please see the Employees and Partners sections online.
2013 Sustainability and Responsibility Summary Report Page 11Communities
Tim Hortons Coffee Partnership
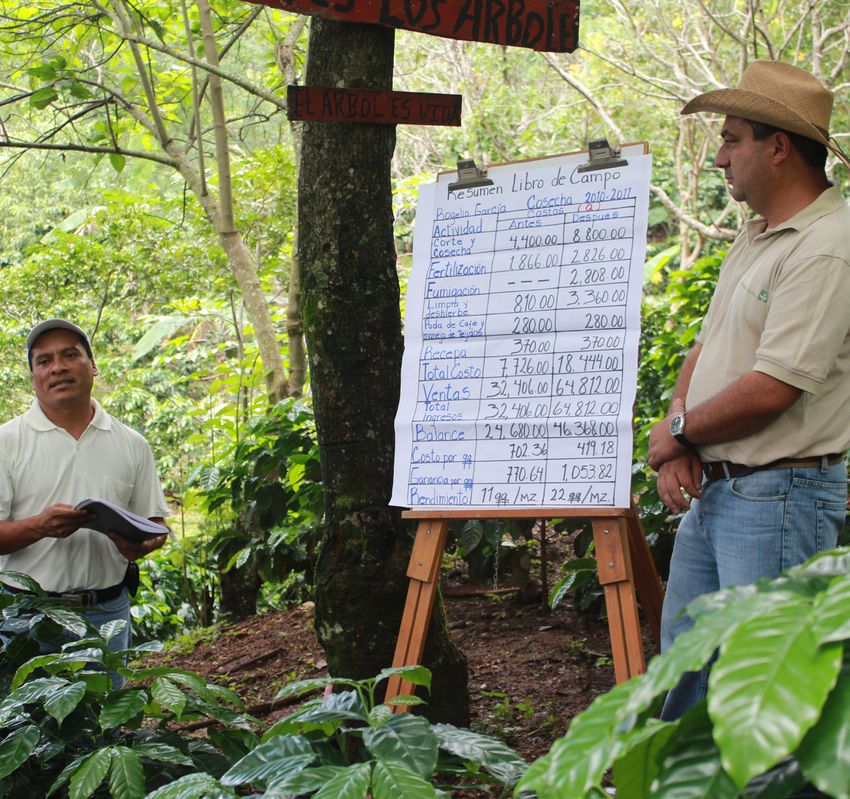
Tim Hortons believes it has a positive role to play Technical Training Demonstration
in enabling communities to thrive and grow. Trifinio Region, Guatemala
• Tim Horton Children’s Foundation
• Community Initiatives
• Tim Hortons Coffee Partnership
2013 Sustainability and Responsibility Summary Report Page 12Communities
Communities Goals and Performance
2013 Goal Status Performance Highlights
Tim Horton Children’s Foundation • We hosted almost 17,700 economically disadvantaged children
We will continue to work towards 17,000 economically and youth at THCF camps.
disadvantaged children participating in Tim Horton GOAL MET
• Construction for our new Youth Leadership Camp in Manitoba
Children’s Foundation camps and programs by the end is proceeding.
of 2015.
C hi l d ren
We will continue to invest in youth by providing over • We have distributed 539 bursaries since January 2012, worth
1,000 bursaries to graduates of our Youth Leadership approximately $1.2 million for post-secondary education, to
Program for post-secondary education by the end ON TRACK graduates of our Youth Leadership Program.
of 2015.
Together with our Restaurant Owners, Team Members • We raised $11.8 million on Camp Day!
and the community, we are aiming to raise over
$11.5 million on Camp Day in 2013. GOAL MET
Community Initiatives • We invested approximately $16 million through community
Together with our Restaurant Owners we are aiming to initiatives in Canada in 2013. To date, we have invested
invest $100 million through our community initiatives in ON TRACK $31.9 million towards our goal of $100 million by 2018.
Canada by the end of 2018.
Smile Cookie • Together with our Restaurant Owners and guests, we raised over
Together with our Restaurant Owners and guests, we are $5.1 million for local charities across Canada and in the U.S.
aiming to raise $4.6 million through our Smile Cookie GOAL MET
Program in 2013 for local charities across Canada and
in the U.S.
C omm u n it y S u ccess
Horizons Aboriginal Program • Over 36,750 new Restaurant Team Members completed our
Education: We are aiming for 30,000 new Restaurant Aboriginal Awareness training in 2013.
Team Members to complete Aboriginal Awareness GOAL MET
training in 2013.
Employment: We will expand the DevelopMENTOR • Collaborating with Algonquin College, the DevelopMENTOR
Program beyond its pilot, and pursue Aboriginal Program has been expanded beyond its pilot, and new participants
recruitment strategies. GOAL MET are enrolled in the program.
• We have also worked with the Aboriginal Human Resources Council
to pursue Aboriginal labour, education and recruitment strategies.
Empowering Youth: We are aiming for a total of • We have hosted 4,000 Aboriginal children and youth at our THCF
5,000 Aboriginal youth to attend Tim Horton Children’s camps since setting our goal in January 2012.
Foundation camps for structured learning by the end ON TRACK
of 2014.
Economic Development: We are striving for 10 new • Since 2012, we have opened eight Aboriginal-owned restaurants
Aboriginal-owned restaurants or kiosks to be opened on or self-serve kiosks on Aboriginal lands.
Aboriginal lands by the end of 2014. ON TRACK
We are aiming for 2,800 farmers to participate in our • We had 3,925 farmers participating in our projects in 2013.
projects in 2013.
T im H ortons C offee
GOAL MET
We are aiming for 12,000 technical training • We completed 13,920 technical training demonstrations and 76%
P artnership
demonstrations for farmers in 2013 and for 95% of of our farmers had established farm management plans.
farmers to have a farm management plan over the GOAL
PARTIALLY
lifespan of each project. MET
We are aiming to achieve a three-year average of • Our three-year average of land under environmentally responsible
5,000 hectares of land under environmentally management increased to 7,355 hectares in 2013.
responsible management in 2013. GOAL MET
We are aiming for 90% of water to be recycled and/or • We achieved 76% of water recycled and/or treated during coffee
treated during coffee processing in 2013 and 100% of processing in 2013 and 100% of project farmers did not use
farmers not to be using banned pesticides. GOAL
PARTIALLY
banned pesticides.
MET
For further details on our 2013 goals and performance, please visit our online Sustainability and Responsibility Report: sustainabilityreport.timhortons.com.
2013 Sustainability and Responsibility Summary Report Page 13Communities
Tim Horton Children’s Foundation
The Tim Horton Children’s Foundation (the Foundation) was established in 1974 in memory of our
company founder, Tim Horton. Created as a way to honour Tim’s memory and to keep alive his
love for helping those less fortunate, the Foundation provides an enriching and memorable camp
experience for children and youth from economically disadvantaged homes. The first camp was
opened in 1975 in Parry Sound, Ontario, and hosted 200 campers in its first summer. Since then,
we have grown to five camps in Canada and one in the United States, hosting over 17,000 children
and youth in 2013. For further information on
the Foundation visit www.thcf.com.
The Foundation operates year-round, and
has three program formats serving children
and youth:
• Summer Camp Program
• Year Round Group Program
• Youth Leadership Program
To hear more success stories from the
Foundation campers themselves, visit us on
Facebook or see the Tim Horton Children’s
Foundation section of our report online.
Funding for Our Camps
Funding for the camps comes primarily from donations from our Restaurant Owners,
and our guests through our counter coin boxes located year-round at our restaurants.
Throughout the year, a number of fundraising events are also held such as golf
tournaments and banquet dinners where Tim Hortons suppliers and business partners
also provide donations.
The largest single fundraising event is our annual Camp Day. Camp Day is the one day
(during the first week of June) where our Restaurant Owners donate 100% of their coffee
proceeds, plus other funds raised throughout the 24-hour period, to the Foundation. In
2013, Camp Day raised over an incredible $11.5 million.
Because of the generosity of our Restaurant Owners and guests, we will be opening our
new Manitoba Youth Leadership Camp, in 2015!
Community Initiatives
Our Restaurant Owners live in, and are a part of, the communities where they operate. We’re proud
to have established a reputation for giving back to our communities and are continually looking for
ways to better support the cities and towns that are home to our restaurants and guests. By working
together with our Restaurant Owners, we have developed a number of local, regional and national
programs as outlined below.
2013 Sustainability and Responsibility Summary Report Page 14Communities
Timbits Minor Sports
One of our most widely recognized programs is our Timbits
Minor Sports Program for children aged four to eight years.
Together with our Restaurant Owners, we provide funding for
associations to acquire uniforms and much-needed items that
help offset costs for parents and volunteers.
We invest more than $3,000,000 annually in children’s sports.
We are committed to this program support because we believe
it is important that children benefit from participating in team
sports and have the opportunity to take time out to be a child.
Timbit Hockey Jamboree, Moncton, NB
Smile Cookie
Our Smile Cookie program is a unique program that
raises much-needed funds for charities across Canada
and the United States. Each year, for one week
during September, we sell special Smile Cookies --
our famous chocolate chip cookies decorated with
a smiley face. During that time, 100% of the
proceeds from Smile Cookie sales are donated to
local charities, hospitals and community programs.
For more information, please see the Community Initiatives section online.
Free Skating and Swimming
Another popular program is our Free Holiday Skate program where we rent almost 2,875 hours of ice
time at more than 459 local arenas across Canada during the winter holiday season. This provides
a great opportunity for families and friends to spend quality time together at no cost. Our program
continues to grow in popularity, with many arenas at capacity during the skating sessions.
Similarly, our Free Swim program provides an opportunity for families to enjoy time together at a local
swimming pool. In 2013, more than 2,400 hours of pool time was sponsored across over 105 local
communities and at 229 pools.
Earn-a-Bike
The Tim Hortons Earn-a-Bike program is a community-oriented
sponsorship program where children between the ages of 10 and 14
team up with community partners to help clean up their local streets,
parks and schools. The participants complete 30 hours of community
service and are rewarded with their very own Tim Hortons mountain
bike and helmet, courtesy of their local Restaurant Owners. Children
are selected by organizations such as Big Brothers and Big Sisters and
their local police department. These organizations also coordinate the
program and provide supervision while the children are out doing their
part to make their community a cleaner, brighter place to live.
2013 Sustainability and Responsibility Summary Report Page 15Communities
Alberta Flood Relief
In 2013, we worked with our Restaurant Owners to develop a multi-level program to provide
assistance and support to those communities across southern Alberta which were impacted
by flooding. The “Alberta Rose” donut was developed and our Restaurant Owners donated
100% of the sales from this $1 donut directly to the Red Cross flood relief efforts. In addition,
we provided a $100,000 corporate donation to the Canadian Red Cross Alberta Floods
Fund, to aid in their continuing effort to provide on-the-ground support in flood affected
communities. We also established a text donation line for Canadians to donate $5, with all
proceeds going to the Canadian Red Cross Alberta Floods Fund. Our joint efforts collectively
raised almost $250,000!
Fruition Fruits & Fills: Community Giving
Our Fruition Fruits & Fills (Fruition) manufacturing facility donates its used blueberry
pails to communities in developing countries. The pails are washed, filled with soup
mix, and transported to remote areas where the food will be used to provide meals for
children while at school. In addition, the pails may be used as storage containers for
food or water, pieces of furniture, tools, such as a shovel or fish net, or even as a place
to bathe small children.
Horizons: Aboriginal Relations
We have been working on implementing a meaningful, structured and long-term partnership with
Aboriginal communities for the past several years.
Horizons is name of the Tim Hortons framework that includes our Aboriginal relations strategy
and outreach programs.
Our Aboriginal relations philosophy, strategy and programs are guided by the following principles:
•O
ur programs should be sustainable;
• Our programs should have a clear benefit;
• Our programs should be community-based; and
• Our programs should be supported by the Aboriginal community.
Our Horizons logo and accompanying graphic brings together a number of
important elements. Central to the logo is a vibrating drum – the Indigenous
symbol of communications, ceremony and celebration. Within the drum
circle, the bursting sun signifies strength, opportunity and the energy of
life. Mother Earth is represented by the warm colours of the rich soil. The
three cultural motifs honour the First Nations (Eagle feather), Métis (Infinity
symbol) and Inuit (Inukshuk) Aboriginal people.
For more information, please see the Horizons Aboriginal Relations
section online.
2013 Sustainability and Responsibility Summary Report Page 16Communities
Partnership Blend Coffee
In 2013, we launched our Tim Hortons
Partnership Blend coffee – sourced 100% from
coffee farmers in the Coffee Partnership Program.
The Partnership Blend coffee is a unique blend,
different from our regular coffee blend, and $1
from every purchase goes back to support the
Tim Hortons Coffee Partnership! We are happy to report that over 180,000 bags of Partnership Blend
were sold in 2013. Dollars raised from sales will assist in scaling and expanding the Partnership,
particularly in important areas like enhanced technical training and youth and education programs.
Third-Party Verification
Since 2009, we have been monitoring and evaluating the performance of the Tim Hortons Coffee Partnership
through a comprehensive set of key performance indicators. Our indicators are aligned to economic, social
and environmental factors, and in 2013, they were verified by an independent third party – Control Union
Certifications. A copy of their verification letter is available for download at timhortons.com.
Additional information on our Coffee Partnership Program and Partnership Blend coffee can be found
online at timhortons.com.
Tim Hortons Coffee Partnership
The Tim Hortons Coffee Partnership helps small-scale coffee farmers
and their communities by supporting them in key economic, social
and environmental areas that will improve their coffee business
and their lives. Our approach is unique from other coffee initiatives
because we are involved in grassroots projects that work directly
with farmers, local coffee organizations, and government and
non-governmental organizations. Through these projects, the farmers
are encouraged to improve farming practices to produce higher
quality coffee more efficiently, giving them more control and options
for their coffee. Please see the Coffee Partnership section online.
Our key areas of focus include:
• Establishing technical training in agronomy to improve the quantity and quality of coffee produced;
• Consulting with farmers to organize with others in their community to reduce their costs and ensure
their coffee gets to market at the best time and at the best price;
• Providing a framework for youth and education programs and supporting housing improvements; and
•S
trengthening environmental management by educating farmers on sustainable farming techniques
such as recycling water, reducing pesticide use, and promoting shade on the coffee farm.
Ethical Tea Partnership
Tim Hortons is proud that all varieties of our leaf–based tea served in our restaurants, including our
brewed and specialty teas,1 are sourced from a member company of the Ethical Tea Partnership (ETP).
ETP is a non-commercial alliance of international tea companies that share a vision of a thriving
global tea sector that is socially just and environmentally sustainable. ETP staff work directly with tea producers to ensure that they
meet international labour standards, so that workers are fairly treated and the environment is protected. All ETP activities, including
independent third-party auditing against the ETP standard, are free to producers.
ETP also works with expert partners on projects that improve the sustainability of the tea sector – from improving labour relations and
reducing discrimination, to safe management of agrochemicals and adapting to climate change.
Find out more at ethicalteapartnership.org.
1 Excludes chamomile, honey lemon, peppermint, and apple cinnamon teas because they are not tea-leaf based.
2013 Sustainability and Responsibility Summary Report Page 17THE PLANET
Tim Hortons understands that changes in
the environment need to be managed and
embraces our responsibility to do our part.
• Responsible Packaging
• Reducing Litter
• Minimizing our Environmental Footprint
(Greenhouse Gas Emissions, Water, Energy and Waste)
• Sustainable and Ethical Supply Chain Practices
2013 Sustainability and Responsibility Summary Report Page 18The Planet
The Planet Goals and Performance
2013 Goal Status Performance Highlights
Packaging • We completed our benchmarking exercise, assessing over 90% of
We will implement our standardized process and tools to our guest-facing packaging formats. The results generated short-
benchmark the environmental impacts of key packaging GOAL MET term opportunities to explore and lessons learned to inform future
formats in order to allow for future goal setting in 2013. goal setting.
Waste Diversion at Restaurants • We worked on two studies to increase our understanding of the
Together with our Restaurant Owners, we are striving barriers to the acceptance of our hot beverage cup and other food
to build on our current level of success and develop ON TRACK service packaging in municipal recycling programs.
a comprehensive waste diversion strategy for our
restaurant system.
By 2016, we are focused on achieving wide-scale • We met with our Restaurant Owners across Canada as a first
implementation of bottles, cans and cardboard recycling phase in developing a comprehensive waste diversion strategy.
programs and increase the number of restaurants
E n v ironmenta l S tewar d ship
ON TRACK
diverting paper packaging (including our hot beverage
cups) and organic waste by 20%.
Corporate Offices • We have seen a 35% decrease in water usage and a 2% increase
We will continue to focus on reducing the environmental in energy consumption at corporate offices since 2011 (our
impact of our corporate operations and work towards a ON TRACK baseline year).
10% reduction in energy/water consumption and landfill • In 2013, we validated our 2012 waste baseline data and
waste at our corporate offices by the end of 2014. performed waste audits at our Oakville Corporate Offices.
Manufacturing and Distribution • In 2013, we continued to measure our waste diversion rates,
At our manufacturing and distribution facilities, we are and investigated opportunities for improved waste diversion and
focused on a 10% increase in waste diversion by the end ON TRACK data collection.
of 2014.
Transportation Efficiency • We have increased the fuel efficiency of our distribution fleet by
We will continue to reduce the environmental impact of 9.7% since 2010. All manual transmission trucks have now been
our distribution fleet by working towards a 15% increase ON TRACK replaced with more efficient automatic transmissions, and we
in fuel efficiency by the end of 2014. continue to upgrade our fleet and trailers on an annual basis to
further increase fuel efficiency.
We will focus on more efficient routing and trailer cube • In 2013, we implemented a new system to centrally route and
utilization to improve our average cases per kilometre. optimize our trailer cube utilization to improve our average cases
GOAL
PARTIALLY per kilometre.
MET
Green Building Design • We registered three restaurants for LEED Certification in 2013,
We will continue to explore LEED applications for our bringing our total to 17 registered restaurants.
restaurants and are aiming to register a minimum of ON TRACK
30 new restaurants for LEED Certification by the end of
2016. We will continue to test innovative energy and
water reduction initiatives for our restaurants.
Business Partner and • Over 99% of our in-scope vendors signed our BPSCC and we
Supplier Code of Conduct (BPSCC) finalized our risk assessment and verification program with an
We will continue to refine and implement our BPSCC GOAL MET independent auditing organization.
and our independent verification program by the • Since 2011, Control Union Certifications has conducted eight
end of 2013. independent verification audits at dry mills of our coffee suppliers
in Colombia, Guatemala and Brazil.
S upp l y C hain
Animal Welfare • Engagement and collaboration with our supply chain and the pork
By 2022, we will source pork from suppliers who have industry continued in 2013.
made a transition to alternative open housing. Further, ON TRACK
• We hosted an industry-wide Animal Welfare Summit at the
we will work with the pork industry and governments to University of Guelph, communicating new research on animal
advance standardized approaches and codes resulting welfare and alternative housing systems, consumer expectations
in more humane and sustainable open housing systems. and supply chain economics.
At the same time, we will support efforts to improve
traceability systems and verification.
We will purchase at least 10% of our egg products, • We sourced 10% of our eggs for our egg products from producers
representing significantly more than 10 million eggs, from utilizing alternative hen housing systems.
more humane, alternative hen housing systems by the GOAL MET
• Three new alternative hen housing barns came on-line for
end of 2013. Tim Hortons supply in 2013 and we are aiming to achieve 12%
sourcing by the end of 2014.
For further details on our 2013 goals and performance, please visit our online Sustainability and Responsibility Report: sustainabilityreport.timhortons.com.
2013 Sustainability and Responsibility Summary Report Page 19The Planet
Environmental Performance Summary
To learn more about our efforts to reduce our environmental impact, please visit
sustainabilityreport.timhortons.com.
20131 20121 20111 Unit of measurement
TIM HORTONS INC. (CORPORATE OFFICES,
DISTRIBUTION CENTRES, MANUFACTURING FACILITIES
AND corporate restaurants)2
Energy
Direct Energy Use3 143,209 136,693 120,197 mWh
Indirect Energy Use4 33,651 35,835 29,127 mWh
Total Energy Use 176,860 172,528 149,325 mWh
Energy Intensity5 0.000054 0.000055 0.000052 mWh/$ Revenue
Water
Total Water Consumption6 107,339 108,803 90,213 1000 L
Water Intensity5 0.000033 0.000035 0.000032 1000 L/$ Revenue
GHG Emissions (CO2e)7
Total CO2e Emissions8 47,398 46,873 41,617 tonnes
RESTAURANTS (CANADIAN AND U.S. STANDARD
RESTAURANTS)9*
Energy
Direct Energy Use3 273,994 223,742 204,371 mWh
Indirect Energy Use4 1,168,940 1,080,012 861,552 mWh
Total Energy Use 1,442,933 1,303,754 1,065,923 mWh
Energy Intensity10 0.000116 0.000121 0.000211 mWh/restaurant sales ($)
Water
Total Water Consumption6 5,972,480 6,263,817 5,702,908 1000 L
Water Intensity10 0.001016 0.001184 0.001130 1000 L/restaurant sales ($)
GHG Emissions (CO2e)7
Total CO2e Emissions11 331,212 312,214 207,240 tonnes
GHG EMISSIONS (CO2e) BY SCOPE12,13
Total Gross Emissions Scope 1 (Direct) 34,056 32,859 28,491 tonnes
Total Gross Emissions Scope 2 (Indirect) 5,532 6,874 4,958 tonnes
Total Gross Emissions Scope 3 (Other Indirect) 341,205 321,672 217,927 tonnes
Total Gross CO2e Emissions 380,793 361,405 251,376 tonnes
Total Net CO2e Emissions14 380,787 361,397 251,343 tonnes
* In 2012, we expanded our reporting to include energy, water and GHG emissions data for U.S. standard restaurants.
Independent Verification
For the second consecutive year, PricewaterhouseCoopers LLP has conducted an independent limited assurance
engagement on selected environmental information in our 2013 Sustainability and Responsibility Report.
For details, please download a copy of PricewaterhouseCoopers’ Independent Limited Assurance Report at
sustainabilityreport.timhortons.com/pdf/2013PWC.pdf.
Additional footnote information can be found in our online Sustainability and Responsibility report at
sustainabilityreport.timhortons.com/planet_performance_summary.html.
2013 Sustainability and Responsibility Summary Report Page 20The Planet
Our Greenhouse Gas Emissions
Our total gross greenhouse gas (GHG) emissions for 2013 were 380,787 tonnes of CO2e. The largest portion of our greenhouse gas emissions
was generated by our restaurants, which represent approximately 88% of our total emissions.1 Emissions generated by Tim Hortons Inc.
represented only 11% of our total emissions, and approximately 46% of those emissions were generated by our distribution fleet alone. We
continue to focus on reducing the GHG emissions of our restaurants’ energy and of our distribution fleet.
2013 Tim Hortons Inc. GHG Emissions 2013 Tim Hortons GHG Emissions
(47,398 tonnes of CO2e) (380,793 tonnes of CO2e)
}
Corporate travel 4% Distribution centres 8% Franchised
Corporate fleet 10% Tim Horton Children’s Restaurants
Corporate restaurants 3% (Standard)
Foundation 1%
Corporate offices 2% 88%
Manufacturing
operations 13% Tim Hortons Inc.
11%
Third-party
Distribution fleet distribution 14%
46%
Corporate Waste
1 11 88 01 8 4 3 2 31 41 64
46 14 13 2 3 4 8 10 88 11 1
In 2013, we continued to track the waste we create in all aspects of our
operations: corporate offices, manufacturing facilities and distribution.
Our goal is to increase our diversion rate by 10% across our operations by
the end of 2014. As of the end of 2013, we had an overall diversion rate
of 81%, a 16% increase from the baseline year 2012. While this rate has
exceeded our goal of a 10% increase in diversion, we are continuing to
focus on increasing recycling and organics programs to reduce the amount
of waste going to landfills.
Key highlights of our progress in 2013 include the following initiatives:
• At our coffee roasting facilities, increased efforts have been made to
divert coffee chaff (a by-product of the roasting process) from landfill
through the organics stream.
• Our distribution centres have increased their diversion of used pallets for re-use and recycling of the wood.
• Our corporate head office is continuing to focus on refining recycling and organics diversion programs. There is still room for improvement and
we are committed to investigating additional opportunities to increase diversion of materials from landfill.
The table outlines the total weights for waste,
recycling and organics diversion at our corporate
offices, manufacturing facilities and distribution
centres, including the improvement in waste
diversion rates from 2012.
For additional information and waste
footnotes please visit our online report at
sustainabilityreport.timhortons.com/
planet_performance_summary.html.
For more information, please see the Environmental Impacts and Performance section online.
2013 Sustainability and Responsibility Summary Report Page 21The Planet
Environmental Stewardship at
Our Restaurants
Waste
As we strive to reduce the waste created in every
part of our business, one of the most important
areas of action, particularly for our guests, is
tackling the waste generated at our restaurants. We
are working towards this objective by considering
the environment when designing our packaging
and implementing reduction, re-use and recycling
initiatives in our restaurants.
The chart represents the average proportion of
waste (by weight and type of material) generated at
a standard Tim Hortons restaurant, based on the
annual waste audits conducted in 2012 and 2013.
Packaging
At Tim Hortons, we consider the environment when
making decisions about our packaging. Designing
better packaging can significantly reduce the
associated adverse environmental impacts. Examples
of how we do this this includes reducing material,
resizing and reconfiguring for pallet optimization,
increasing recycled content, and using new material
types and sources.
Recent Packaging Improvements
In 2013, we continued to focus efforts on pallet
optimization, based on our goal of reducing
the environmental impacts associated with
transporting our products and packaging. Key
highlights include the following:
• We worked with our vendors to change • We increased the number of cases per • Working with Sealed Air, our donut
the sizes and palletizing patterns on pallet for our Timbit and Donut boxes, fillings and glaze packaging vendor,
some of our products. Our combined achieving a reduction of 3,600 incoming we reduced the thickness of the plastic
efforts resulted in a reduction of pallets, which translated into savings film used to package the fillings and
approximately 6,200 incoming pallets, of approximately 168,950 kilometres glaze by 30%, eliminating approximately
saving over 323,500 kilometres in 2013. in 2013. 60 tonnes of plastic per year.
2013 Sustainability and Responsibility Summary Report Page 22The Planet
Programs for the Hot Beverage Cup and Other Paper Packaging
In 2000, we launched our first hot beverage cup diversion program in Prince Edward Island.
Since then, the number of restaurants with hot beverage cup and paper packaging recycling
and composting programs has increased each year. By the end of 2013, we estimate that paper
packaging diversion programs, many of which include the hot beverage cup, were offered at
30% of our restaurants in Canada. We continue to look for new opportunities to increase the
number of restaurants with programs to divert the full range of our waste materials from landfill.
Green Building Design
We are continually evaluating new technology, design and construction methods to improve the energy and water efficiency of our
restaurant buildings, and to reduce our overall environmental footprint. This also enables our Restaurant Owners to benefit financially by
saving on the utility costs to operate their restaurants. We pilot and test emerging technologies and, where feasible, introduce them into
our standard restaurant designs. Key accomplishments in 2013 include the following:
• We expanded our Electric Vehicle Charging Station pilot in 2013 with six new charging stations across British Columbia and two more
in Ontario. This brings the pilot to 12 available stations across Canada.
• We completed a Request for Proposal (RFP) for energy efficient LED lighting in our
restaurants and are pleased to announce that in 2014 all of our new restaurants will be
equipped with interior and exterior LED lighting wherever possible.
• We also completed an RFP to find an energy management system. This type of system
will not only help control the components of the restaurant, but will also provide them
with more data visibility, allowing for more consistent monitoring and greater opportunity
for operational improvements and prototype development.
Improving Our Restaurant Equipment
In 2013, we partnered with a recycling company to implement a menuboard
recycling program. Old menuboards that were removed during our restaurant
renovations were diverted from landfill, and sent to a facility where they
were dismantled and materials separated and sorted for recycling. In total,
we recycled approximately 230,000 pounds of materials and generated
approximately $25,000 in revenue which will be donated to the Tim Horton
Children’s Foundation!
Our new drive-thru menuboards are eligible to contribute towards LEED
certification points as they are made from 80% recycled material.
For more information, please see the Restaurants section online.
2013 Sustainability and Responsibility Summary Report Page 23The Planet
Corporate Operations
In addition to working with our Restaurant Owners to minimize the environmental impact of our restaurant buildings and operations, we have
been working hard to minimize our corporate environmental footprint as well.
Corporate Offices
In 2012, we set a goal to reduce our energy and water use at corporate offices by 10% by the
end of 2014, as compared to 2011 consumption. At the end of 2013, we have met our goal
for water usage, achieving a 35% reduction in water consumption. Our energy consumption
increased by almost 2% at our corporate offices in 2013 in comparison to 2011. This is
primarily the result of an increase in the consumption of natural gas to heat our facilities
due to lower average temperatures. We continue to work towards meeting the goal of a 10%
reduction in energy consumption by 2014.
In 2013, we validated our 2012 waste baseline data and performed waste audits at our
Oakville corporate offices. In 2013, our waste diversion rate for all corporate offices was
60%, which represents an 8% increase in our diversion rate from 2012. Working towards the goal of a 10% increase in waste diversion
by 2014, we plan to continue to focus on reducing waste created through our offices by the expansion of waste diversion programs and
employee education.
Manufacturing
Maidstone Coffee
In 2013, our Maidstone Coffee roasting plants in
Ancaster, ON, and Rochester, NY, were successful
in implementing our program to recycle 100% of
our jute bags holding green coffee, diverting this
waste landfill.
The coffee chaff, a waste product from the coffee
bean, is being used as a soil additive in Ontario farms, and we are currently testing
chaff as an additive for bioplastics.
Our facilities continue to recycle 100% of their cardboard and plastic wrap. While we
have not yet found an energy efficient method to recycle the packaging film for our
coffee, we will continue to work towards a solution in 2014.
Fruition Fruits & Fills
Fruition Fruits & Fills (Fruition) is our fondant and fills manufacturing facility. The production
of icing and fruit-based filling and glaze has typically been water intensive. Therefore, in
past years, Fruition has focused on reducing the amount of water used in its manufacturing
process. Between 2008 and 2013, we have reduced our water consumption by 21%.
Our focus in 2013 was on reducing waste and improving diversion rates. This was done
through efforts to educate employees on the importance of reducing waste and segregating
materials into the appropriate waste stream. For example, in 2013 employees increased
efforts to separate plastic waste film for recycling. Through these efforts and previous
years’ activities, the diversion rate for Fruition Fruits & Fills increased to 89%.
2013 Sustainability and Responsibility Summary Report Page 24The Planet
Distribution
As a vertically integrated company, our network of distribution centres (DCs) across Canada is a significant
source of our energy consumption and, due to our transportation fleet, the main source of our corporate
carbon footprint. Our DCs are continuously piloting and implementing projects aimed at increasing efficiency
of our operations and reducing the environmental impact. Key highlights for 2013 include:
• Doubling our utilization of fleet backhauls, we eliminated over 466,000 kilometres driven by our distribution
trucks, and saved approximately 194,000 litres of fuel.
• We implemented a new program to divert from landfill any sugar shipments that were damaged in transit and
could no longer be sold to restaurants, instead returning the sugar to the manufacturers for recycling and re-processing.
• With an increased focus on recycling pallets and plastic shrink wrap, and improving our ability to collect waste collection data,
our DCs are now diverting 85% of waste from landfills, an increase of 16% from 2012.
Transportation Efficiency
In 2013, our distribution fleet achieved a 12.5% increase in fuel efficiency from 2008,
achieving an average of 2.4 kilometres per litre. Key highlights for 2013 include:
•C
ompletion of the replacement of our pre-2010 manual transmission trucks with new
more efficient automatic transmissions.
• Implementation of a new system to centrally route and optimize our trailer cube utilization,
which will improve our average cases delivered per kilometre travelled.
• Using a Long Combination Vehicle (LCV) program in Alberta, Ontario and Quebec. Each
LCV unit represents another vehicle off the road, which further reduces fuel usage and
greenhouse gas emissions.
We are focused on achieving our goal of a 15% increase in fuel efficiency by the end of 2014. We are actively working on improving our idling
rates, and we are closely monitoring truck operations and driver behaviour through the use of our on-board computer systems.
2013 Sustainability and Responsibility Summary Report Page 25The Planet
Supply Chain
Our supply chain is made up of a wide network of suppliers, some of whom provide us with goods that ultimately end up in our restaurants,
while others provide us with goods or services that help us in our day-to-day business operations. For the second time in 2013, our food,
beverage, packaging and equipment vendors were evaluated on criteria based on sustainability practices, goals, and innovation. We look
forward to further engaging with our suppliers to share best practices, encourage innovation and minimize the environmental impacts of our
products and equipment.
Business Partner and Supplier Code of Conduct
We are committed to sustainable supply chain practices across our business. Our Business Partner and
Supplier Code of Conduct (BPSCC) is built on the principles of respect, fairness and business ethics, with
regulatory compliance being a minimum standard of doing business with us. Our BPSCC is based on
internationally accepted labour standards, including the International Labour Organization’s (ILO) core
conventions and the United Nations’ Universal Declaration of Human Rights. Key areas of focus in the
BPSCC include compliance with applicable laws and regulations, conditions of employment, workplace
environment, and business ethics.
In 2013, we completed the implementation of our Business Partner and Supplier Code of Conduct,
with over 99% of our in-scope vendors signing our BPSCC. In addition, we finalized our risk assessment and verification program with an
independent auditing organization. For further information, a copy of our BPSCC can be downloaded online.
Animal Welfare
Animal welfare is an important issue to Tim Hortons and all of our stakeholders, including our Restaurant Owners, suppliers, and guests.
We consider animal welfare to apply to all aspects of animal care of the farm animals within our supply chain. While some of our food
products are derived from farm animals, we are not directly involved in the raising, handling, transportation or processing of these animals.
We depend on various direct and indirect suppliers – from processors right down to producers, many of which are family-run farms.
Our Animal Welfare Policy (available online) is aligned with our company values and Sustainability and Responsibility Guiding Principles,
and sets internal standards in key areas such as regulatory compliance, quality assurance and auditing, continuous improvement and
reporting. Key highlights in 2013 include:
• In 2013, we sourced 10% of our eggs from producers utilizing alternative hen
housing systems. Three new alternative hen housing barns came on-line for
Tim Hortons supply in 2013, and we are aiming to source 12% by the end of 2014.
• We engaged with our suppliers, government and industry groups to further
understand the latest animal welfare science-based research and best practices.
• Our partnership with the University of Guelph, through the establishment of the
Tim Hortons Sustainable Food Management Fund (established in 2012), continued
in 2013, and together, we hosted our first North America–wide restaurant industry
summit which focused on animal welfare issues, academic research and best
practices for the restaurant industry.
University of Guelph researchers are investigating opportunities that produce sustainable outcomes in the best interest of animals and
farmers. The focus of the research aims to understand the costs of making transitions to alternative hen and sow housing systems,
and the viability and timeline of implementation. Traceability of these alternative value chains
has already emerged as a major challenge to the industry. The researchers are also conducting
consumer research on perceptions of animal welfare and sustainability attributes in a hospitality
setting. Research will continue throughout 2014.
By 2022, we intend to source pork from suppliers who have made a transition to alternative
open housing systems. We are on track to meet this goal and continue to work with the pork
industry and governments to advance standardized approaches and codes resulting in more
humane and sustainable open housing systems.
2013 Sustainability and Responsibility Summary Report Page 26You can also read