Sustainable Mobility in the United States: Challenges & Opportunities from New Technologies - Heinrich-Böll ...
←
→
Page content transcription
If your browser does not render page correctly, please read the page content below
Sustainable Mobility in the United States:
Challenges & Opportunities from New Technologies

                ERE Practicum, Spring 2020
                 Heinrich Böll Foundation

Simran Borade, Kathleen Cohen, Chantal Davis & Jake Stockman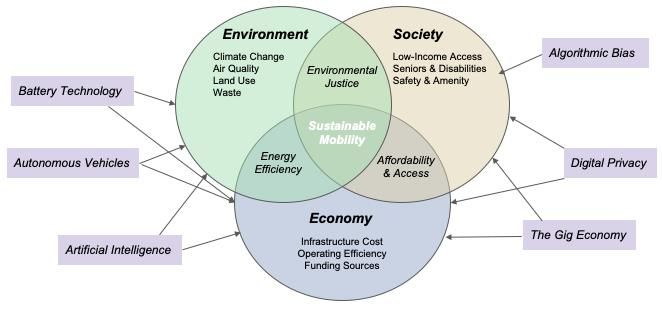
Table of Contents
1      Executive Summary ............................................................................................................................ 4

2      Introduction ......................................................................................................................................... 5

3      Methodology ........................................................................................................................................ 7

4      Mobility Trends in the United States ................................................................................................. 8
    4.1        Passenger Vehicles ...................................................................................................................... 8
    4.2        Demographic Changes ................................................................................................................. 9

5      Electric Vehicles ................................................................................................................................ 10
    5.1        Electric Vehicle Adoption in the United States ............................................................................ 10
    5.2        EVs and the Electricity Grid ........................................................................................................ 11
    5.3        Sustainability Implications ........................................................................................................... 12
    5.4        Equity Implications ...................................................................................................................... 13
    5.5        Federal Policy and EVs ............................................................................................................... 13

6      Shared Mobility.................................................................................................................................. 15
    6.1    Shared Mobility Adoption in the United States ............................................................................ 15
      6.1.1 Ride-hailing with Transportation Network Companies (TNCs) ............................................... 15
      6.1.2 Micromobility ........................................................................................................................... 16
    6.2        Sustainability Implications ........................................................................................................... 17
    6.3        Equity Implications ...................................................................................................................... 17
    6.4        Federal Policy and Shared Mobility............................................................................................. 18

7      Autonomous Vehicles ...................................................................................................................... 19
    7.1    Autonomous Vehicle Adoption in the US .................................................................................... 19
      7.1.1 Consumer Perceptions ............................................................................................................ 20
    7.2        Sustainability Implications ........................................................................................................... 21
    7.3        Equity Implications ...................................................................................................................... 22
    7.4        Federal Policy and AVs ............................................................................................................... 23

8      Data Privacy ....................................................................................................................................... 24

9      Case Studies ...................................................................................................................................... 25
    9.1    California ..................................................................................................................................... 25
      9.1.1 Climate Policies ....................................................................................................................... 26
      9.1.2 Electric Vehicles ...................................................................................................................... 26
         9.1.2.1 Consumer Incentives ...................................................................................................... 27
         9.1.2.2 Charging Infrastructure ................................................................................................... 27

                                                                                                                                                             2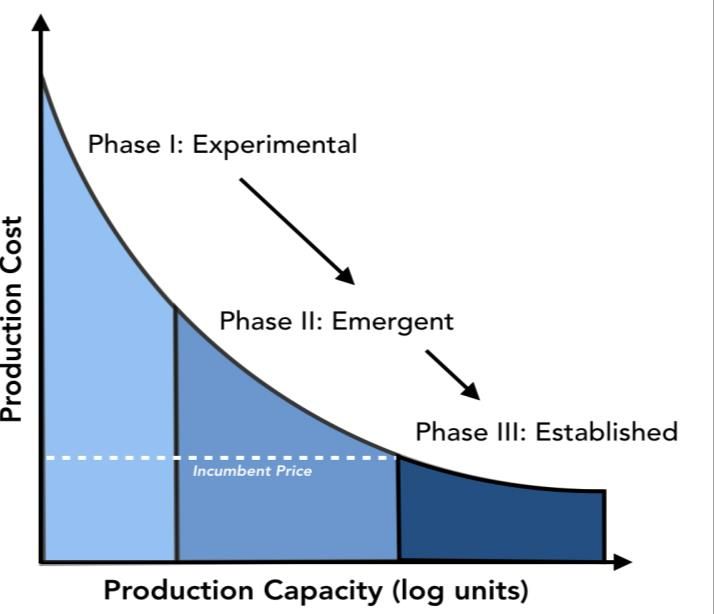
9.1.3 Shared Mobility........................................................................................................................ 28
          9.1.3.1 Ride-hailing with TNCs .................................................................................................... 28
          9.1.3.2 Micromobility ................................................................................................................... 29
          9.1.3.3 Data Privacy .................................................................................................................... 30
       9.1.4 Autonomous Vehicles ............................................................................................................. 32
   9.2    Michigan ...................................................................................................................................... 32
     9.2.1 Electric Vehicles ...................................................................................................................... 33
        9.2.1.1 Private Sector Initiatives .................................................................................................. 33
        9.2.1.2 State Initiatives ................................................................................................................ 34
        9.2.1.3 Utility Initiatives................................................................................................................ 35
        9.2.1.4 Future policies in Michigan .............................................................................................. 36
     9.2.2 Shared Mobility........................................................................................................................ 36
        9.2.2.1 State Initiatives ................................................................................................................ 36
        9.2.2.2 Ride-hailing with TNCs .................................................................................................... 37
        9.2.2.3 Micromobility ................................................................................................................... 37
     9.2.3 Autonomous Vehicles ............................................................................................................. 38
        9.2.3.1 Private Sector Initiatives .................................................................................................. 38
        9.2.3.2 State Initiatives ................................................................................................................ 39
        9.2.3.3 Data Privacy .................................................................................................................... 39
   9.3    Washington, DC .......................................................................................................................... 40
     9.3.1 Administrative Structure .......................................................................................................... 40
     9.3.2 Transit Initiatives ..................................................................................................................... 41
     9.3.3 Electric Vehicles ...................................................................................................................... 42
     9.3.4 Shared Mobility........................................................................................................................ 43
        9.3.4.1 Ride-hailing with TNCs .................................................................................................... 43
        9.3.4.2 Micromobility ................................................................................................................... 45
     9.3.5 Autonomous Vehicles ............................................................................................................. 47
   9.4    Pittsburgh .................................................................................................................................... 47
     9.4.1 Transit Initiatives ..................................................................................................................... 49
     9.4.2 Electric Vehicles ...................................................................................................................... 51
     9.4.3 Shared Mobility........................................................................................................................ 51
        9.4.3.1 Micromobility ................................................................................................................... 51
     9.4.4 Autonomous Vehicles ............................................................................................................. 52

10         Conclusions ................................................................................................................................... 53
   10.1       Sustainability ............................................................................................................................... 53
   10.2       Equity .......................................................................................................................................... 55
   10.3       Data Privacy ................................................................................................................................ 56
   10.4       Policy Approaches ...................................................................................................................... 58

Bibliography .............................................................................................................................................. 61

                                                                                                                                                                3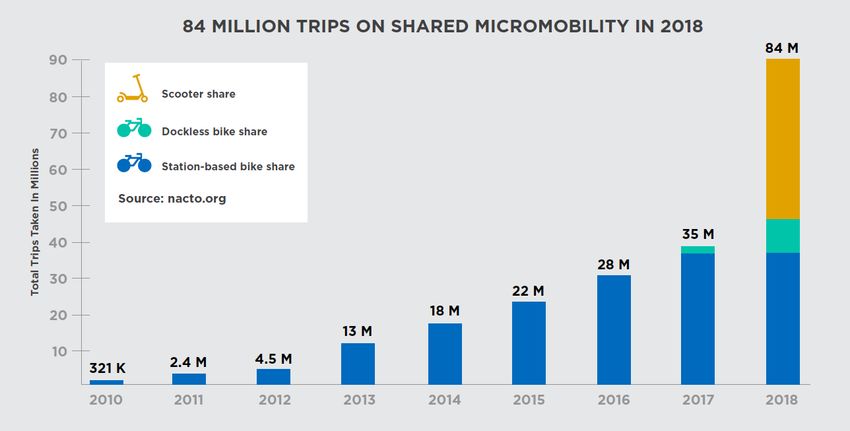
1 Executive Summary
In 2018, the transportation sector accounted for more than 24% of carbon dioxide (CO2)
emissions globally1 and became the largest contributor of greenhouse gases (GHGs) in the
United States, accounting for 29% of emissions.2 While this sector is crucial for the development
of any economy, it also has a large role to play in any meaningful efforts to transition to a low-
carbon future. Therefore, it is necessary to view the transportation sector through the lens of
sustainability, which encompasses economically viability, as well as human and environmental
health.

In this report we define sustainable mobility as the application of technologies and management
methods to promote better local and global environmental outcomes, while also remaining
economically-viable and bridging socioeconomic gaps in the transportation network. Our main
goal is to examine the current status of sustainable mobility in the United States and the policies
that shape its adoption and impacts on the environment and society and develop strategic
recommendations to ensure that the adoption of new mobility technologies truly benefit people
and the planet. In doing so, we have focused on three key mobility technologies, which have a
potential to transform the transportation sector: battery powered electric vehicles (EVs), shared
mobility technologies (specifically ride-hailing and micromobility), and autonomous vehicles
(AVs).

We examine policies and programs at the federal, state, and local levels that focus on
promoting and regulating these three technologies. Specifically, we chose case studies focusing
on two states, California and Michigan, and two cities, Washington, DC and Pittsburgh. We
selected contrasting cases that represented differing policy approaches and stages of
technology adoption. The state of California is at the forefront of technology innovation, as well
as a leader in sustainability and climate efforts. Michigan, on the other hand, is the historic
center of the US automotive industry, with a growing autonomous vehicle industry. As the
capital of the United States, the city of Washington, DC boasts a robust and expanding transit
network, along with a rapid growth in micromobility services. Pittsburgh, on the other hand, is a
former industrial city that is becoming an emerging hub for AV technology and has taken a more
collaborative approach to the integration of newer technologies.

The adoption of these technologies has an impact on multiple realms of society. We specifically
examine their impacts on sustainability, equity, and data privacy outcomes. We find that
sustainability impacts depend not only on tailpipe emissions, but the entire lifecycle of a
technology, as well as where it is adopted, how it is adopted, and the sustainability of the modes
of transportation it is replacing. Equity outcomes can also vary: the introduction of a new
mobility technology does not mean that all groups benefit equally with enhanced mobility. As
many of these new mobility technologies involve the collection of and use of large amounts of

1
    Wang and Ge, “Everything You Need to Know About the Fastest-Growing Source of Global Emissions.”
2
    U.S. Environmental Protection Agency, “Fast Facts on Transportation Greenhouse Gas Emissions.”

                                                                                                   4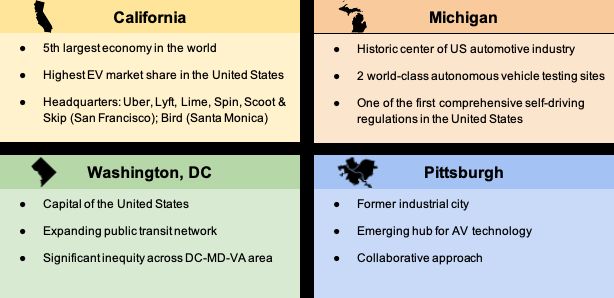
trip data, questions arise and precedents are set around data privacy and what data can and
should be protected.

To ensure the best outcomes in the realms of sustainability, equity, and data privacy, we
recommend frameworks that policymakers can use when making decisions about how to
incorporate these new sustainable mobility trends into their transportation landscape. We also
propose a framework that can be used to determine which policy approaches are best
depending on how developed and widely used a mobility technology is. As a result, we hope
that the American experience with sustainable mobility can serve as a learning experience
going forward for policymakers everywhere.

2 Introduction
In this report, we will address the challenges and opportunities that the United States faces at
the federal, state, and city level in promoting sustainable mobility. Before examining specific
technologies and practices, it is first important to define “sustainable mobility” in this context. For
the purposes of this report, we will refer to sustainable mobility as the application of
technologies and management methods to promote better local and global environmental
outcomes, while also remaining economically viable and bridging socioeconomic gaps in the
transport network.

These objectives underpin the Smart Cities movement, which attempts to integrate technologies
like remote monitoring and artificial intelligence to improve the performance of the city’s
transportation and other systems. In Figure 1 we illustrate how various technologies integrate
with and impact society, the economy, and the environment. While these tools offer great
potential for improving efficiency, their rapid deployment has brought about concerns about the
wider social implications, like digital privacy and the potential for algorithmic bias. Therefore, we
will also be addressing the role and impact of data collection in developing transportation
policies.

                                                                                                     5
Figure 1: Sustainable Mobility and the Role of Technology
To evaluate impacts of new transportation technologies, we chose to examine the adoption of
these technologies at three levels: federal, state, and municipal. For the more localized impacts
we focused on specific metropolitan- and state-level case studies. The case studies selected for
this report are California and Michigan at the state level; and Washington, DC and Pittsburgh at
the metropolitan-level. The different geographic, economic, and demographic conditions in each
of these cities and states correspond to different present and future transportation demand and
constraints. Differences notwithstanding, these cases each feature public and/or private-sector
innovation in the transport sector.
Within each case, we will examine not only the processes of technological diffusion and
regulatory responses, but also their broader impacts on civil society. In particular, we will use
existing evidence to identify threats and opportunities in the following areas:
Environmental Sustainability: Do changes in the transportation system lead to a net
reduction in greenhouse gas emission? What are the effects on local air quality? What
changes in land use are expected? How are adverse environmental impacts distributed
across space and social groups?
Inclusion, Access, and Equity: Are new technologies widely affordable? Will
implementation improve or worsen existing disparities in transportation services? Are
groups with special needs (seniors, children, people with disabilities) adequately served?
Data Management & Security: What kinds of data are being collected to support
implementation of new transportation technologies? Are consumers aware of the
information being collected? What measures are being taken to ensure consumer safety
and privacy? How are data practices affecting different social groups? What are the
tradeoffs involved in data collection/privacy?
As we will demonstrate in this report, those answers are rarely straightforward, and involve a
complex set of choices by policymakers, manufacturers, and consumers. Especially in the case
6of experimental or less-established technologies, the overall impact may be uncertain. We will
aim to highlight some key controversies surrounding emerging topics in transportation systems,
offering insights into the sources of uncertainty.
3 Methodology
We used a variety of information sources when compiling this report, including peer-reviewed
literature, trade literature, and interviews with subject-matter experts. The first part of this report
will focus broadly on new trends and technologies in urban transportation in the United States.
This encompasses emergent technologies, evolving consumer trends, and changes in public-
sector management of the transportation network. Throughout this report, we will frame these
developments in the context of the adoption curve. The adoption curve refers to the relationship
between a new technology’s cost, relative to incumbent technologies, and its market
penetration. In a 2018 paper, Meckling et al. examine how policy choices influence both the cost
and deployment of new ‘clean energy’ technologies.3 The authors identify three distinct phases
of technological adoption, called experience in their formulation (Figure 2):
Figure 2: Adoption Curve4
At the top of the curve are experimental technologies. At this stage, technologies are generally
too cost-prohibitive to implement beyond limited pilot or experimental applications. In the context
of this report, autonomous vehicles remain in this phase of development.
The middle of the curve are emergent technologies. This stage is characterized by increasing
cost-competitiveness, which may result from policy support, growing economies-of-scale, or
improvements in manufacturing efficiency. Emergent technologies have not yet achieved cost-
3
Meckling et al., “The Political Logics of Clean Energy Transitions.”
4
Adapted from Meckling et al.
7parity with incumbents, but falling costs and technical improvements in this stage make these
technologies viable for niche audiences. Though such technologies may have a niche
commercial market, there remain barriers to widespread adoption. In most cases, cost is the
principal barrier, though infrastructure constraints, ambiguous regulation, and consumer
preferences can also present obstacles to implementation at-scale. Electric vehicles and shared
mobility are currently at this phase of development.
At the bottom of the curve are established technologies. At this stage, newer technologies are
deployable at-scale and cost-competitive with incumbents. Traditional manufacturers may have
to reduce prices in order to compete with new competitors. Other companies will try to adapt to
the changing situation by evolving to mimic their upstart competitors. For example, existing
carmakers have invested in or acquired start-up firms in the AV sector.
The mobility technologies and practices evaluated in this report feature differing levels of
adoption, resulting in different regulatory approaches. It is also important to note that adoption
can vary by locality. Some places lack the infrastructure, resources, or technical capacity to
support new transportation models and modes. In other places, there can be varying levels of
social support or resistance toward changes in the transportation network.
4 Mobility Trends in the United States
4.1 Passenger Vehicles
The automobile and highways dominate perceptions of US transportation. Mobility in the United
States has long been characterized by high private car use and ownership. There are about 766
cars for every 1000 people, whereas Europe has only 507 and China, 74.5 A high share of the
population, 70 % have drivers’ licenses.6 However, there is evidence that the prevalence of the
private vehicle is slowly declining due to changes in demographics, technology, economics, and
cultural preferences.
Americans have been using cars less to make their daily trips, as seen in the following trends:
● Vehicle miles traveled (VMT) growth has been stagnating since the Great Recession.7
● Americans drive on average 7.6% fewer miles than they did a decade ago.
● Demand for new cars has slightly decreased by 0.4%8
● The average number daily trips has decreased from 4.3 in 1995 to 3.4 in 2017.9
● The share of daily commutes in single-occupancy vehicles (SOV) has decreased slightly
from 92.8% in 2001 to 91.4% in 2009.
5
Bormans, “Statistical Pocketbook 2018.”
6
Keeney, “China’s Booming Autonomous Car Opportunities.”
7
Martin et al., “Understanding Travel Behavior: Research Scan.”
8
ACEA, “Vehicles in Use - Europe 2018.”
9
Polzin, “Changing Travel Behavior.”
8In addition to making fewer trips and fewer trips by car, Americans are also increasingly less
likely to own a car than in the past. There were 5-6% drops in the number of vehicles per
person, vehicles per driver, and vehicles per household from 2006 - 2012, with the most
pronounced declines in the millennial generation.10 There has also been an increase in the
percentage of households with zero to one car and a decrease in the share of households with
two or more cars.11 While the economic hardships that many faced in the wake of the financial
crisis contributed to these drops, peak car ownership in the United States occurred before 2008,
implying that the financial crisis only exacerbated a trend that was already happening.12
Urbanization and internet technology have contributed to this slow-down of car use and
ownership. Those living in dense, urban areas are more likely to own fewer vehicles, and the
U.S. population is urbanizing.13 The rise of e-commerce has contributed to Americans taking
fewer trips for shopping and errands.14 Telecommuting and remote-work capabilities allow more
people to work from home, but the lack of employer surveys makes it difficult to fully measure
their impacts. These trends are fueled by changing demographics in the United States and
different preferences amongst the generations.
4.2 Demographic Changes
The American population is aging. By 2030 one in five Americans will be 65 or older.15 The
millennial generation (born 1981-96) has surpassed the baby boomers (1946-64) as the largest
adult generation in the United States.16 Their travel behaviors will have the largest impact on
American mobility moving into the future.
Car ownership rates have dropped the most for millennials as compared to any other
generational cohort. The number of young people who are getting their driver’s license is also at
an all time low, making it unlikely that car ownership rates will rebound, since license rates are
good indicators of future car ownership.17 Millennials are also three times more likely to
abandon their personal vehicle than any other generation.18 To make up for reduced car use,
millennials use other modes, such as carpool, public transit, and bicycling at rates higher than
older generations. However, millennials are also travelling less than older generations were at
the same age, according to the National Household Travel Survey. 19
10
Bouton et al., “Urban Mobility at a Tipping Point | McKinsey.”
11
Martin et al., “Understanding Travel Behavior: Research Scan.”
12
Berg, “U.S. Urban Population Is Up ... But What Does ‘Urban’ Really Mean? - CityLab.”
13
Berg, “U.S. Urban Population Is Up ... But What Does ‘Urban’ Really Mean? - CityLab.”
14
Polzin, “Changing Travel Behavior.”
15
Martin et al., “Understanding Travel Behavior: Research Scan.”
16
Fry, “Millennials Expected to Outnumber Boomers in 2019.”
17
Bliss, “Federal Highway Administration.”
18
Giffi et al., “The Changing Nature of Mobility.”
19
Martin et al., “Understanding Travel Behavior: Research Scan.”
9Some of this reduced car use can be explained by changing preferences amongst younger
generations. Millennials and their younger cohort, Gen Z (1996-2012) do not see car ownership
as important as older generations do. They are twice as likely to question whether they need to
own a vehicle in the future and are less willing to buy a car than older generations.20
5 Electric Vehicles
Electric vehicles (EVs) have existed for more than a century; however, it is only in the past
decade that there has been significant commercial interest in electric-powered cars. Since the
first commercially available EV model entered the US market in 2010,21 the industry has rapidly
expanded. Newer models now have an increased range on a single charge and electric
charging stations have become more plentiful. Today, there are several EV models available in
the US market, and this number continues to increase. As an indication of the industry's shifting
attitude toward EVs, there were four ads for EVs in the 2020 Super Bowl. In the next few years,
the market will likely expand beyond early adopters.
5.1 Electric Vehicle Adoption in the United States
The United States is the third largest EV market in the world. EV sales in the United States
increased by 81% in 2018, and the total number of EVs has surpassed 1.5 million. Despite the
rapid growth of the EV sub-sector in recent years, they still comprise only 1.6% of private light
vehicles in the United States making them an emergent technology on the adoption curve.
Public perception of EV technology has been tepid.22 This has slowed EV growth in the United
States since consumer awareness and understanding are critical precursors to EV market
growth.23 In addition, mismatched policies from states have sent mixed signals to auto
manufacturers, which has delayed the scaling up of EV manufacturing as well as the
development of lower cost and more sophisticated vehicles.24 As a result, EVs are still
significantly more expensive than gasoline-powered vehicles, and early adoption has been
limited to the rich and those committed to environmental causes.25
EV owners in the United States typically fall into certain socioeconomic categories. Those who
are male, middle-aged, highly educated, or make over 100,000 USD make up the largest shares
of EV owners.26 Another important factor that encourages EV adoption is the availability of
charging infrastructure. A widespread charging infrastructure network that includes home,
20
Vitale et al., “2019 Global Automotive Consumer Study.”
21
Canis, Clark, and Sherlock, “Vehicle Electrification: Federal and State Issues Affecting Deployment.”
22
Fitzgerald and Li, “Driving a Shared, Electric, Autonomous Mobility Future: What China, India, and the
United States Can Learn from Each Other.”
23
Slowik, “The Continued Transition to Electric Vehicles in U.S. Cities.”
24
Fitzgerald and Li, “Driving a Shared, Electric, Autonomous Mobility Future: What China, India, and the
United States Can Learn from Each Other.”
25
Fitzgerald and Li.
26
Nickkar, “Electric Vehicle Ownership Factors and Commuting Behavior in the United States.”
10workplace, and public locations not only increases driver confidence in the vehicle’s range, but
also increases visibility and public awareness of EV technology. Consumer research shows that
the decision to buy an EV is directly related to the availability of fast-charging stations.27 Markets
with high EV uptake have at least 300 public charging points per million people. In the United
States, by contrast, half of the population lives in a market with charging infrastructure at least
70% below this benchmark.28
5.2 EVs and the Electricity Grid
Another barrier to EV diffusion at scale is insufficient infrastructure, particularly in relation to
residential charging. In a scenario with mass EV adoption, the demands on existing electricity
distribution networks would likely exceed local capacity. Introducing electric vehicles will
increase total electricity consumption (shifting from liquid fuel to electricity), but more importantly
it has the potential to dramatically increase demand at peak hours. If every household in a
neighborhood charges their vehicle in the evening, the amount of electricity needed to support
this activity will in many cases exceed local distribution capacity. If demand exceeds available
capacity, wholesale prices spike dramatically, and blackouts or frequency losses (which can
disrupt electronics) are possible. Customers do not directly observe price spikes due to time-
averaged pricing, but if they occur with regularity it would likely result in higher household rates
potentially dampening demand for electric vehicles.
If mass EV replacement of conventional vehicles is to occur, there will need to be corresponding
shifts in policy. The “hardware” solution is to increase local distribution capacity, including
infrastructure like high-voltage DC lines to support commercial charging. This can be paired with
distributed generation (e.g. rooftop solar) and battery storage to increase local power
availability. The “software” solution is to implement demand-responsive pricing to shift charging
times to less constrained times of day. This requires real-time electricity pricing, and demand
responsiveness will vary. Some activities cannot be shifted to another time, and some people
will be willing to pay more, or unaware of the increased electricity cost. There is also a
behavioral aspect. Charging during daytime hours while at work, for example, could reduce
peak-hour demands on the grid. Similarly, shorter and/or fewer trips can reduce the energy
consumption of EVs.
27
Bonges and Lusk, “Addressing Electric Vehicle (EV) Sales and Range Anxiety through Parking Layout,
Policy and Regulation.”
28
Slowik, “The Continued Transition to Electric Vehicles in U.S. Cities.”
115.3 Sustainability Implications
With no tailpipe emissions EVs will reduce local air pollution. They also have the potential to
decrease greenhouse gas (GHG) emissions depending on the power supply of the grid. In
areas where the majority of electricity is generated by renewables, the use of EVs will decrease
GHG emissions. However, plug-in EVs might not prove to be as sustainable in regions where
the electricity generation mix is mostly fossil fuels, such as in Florida, where only 2% of
electricity generated is from renewables.29
As EVs have become more established in the marketplace, there has been increased scrutiny
over their broader social and environmental impact, especially as it relates to materials,
manufacturing, and waste management. The lithium-ion batteries used in EVs today are crucial
in determining cost, performance, and range; however, the manufacturing of these batteries
requires intensive inputs of resources like lithium and cobalt, while also encountering
sustainability concerns. In a high EV-adoption scenario, the demand for these minerals will
increase significantly, leading to a rise in demand for lithium and cobalt. This will have
numerous negative implications. For example, with 70% of the world’s cobalt resources located
in the Democratic Republic of Congo (DRC), the country has been known for artisanal mining
and child labour, which have been major concerns of the consumers in the automotive sector.
Moreover, the instability of the country, exacerbated by its mineral wealth has given rise to
internal conflicts which often lead to supply disruptions and price volatilities.30
A recent study also highlighted that while an electric car can reduce emissions, making their EV
batteries could emit more carbon dioxide than manufacturing conventional cars. To power an
electric vehicle, batteries must be significantly larger than those used in consumer electronics.
The battery packs used in Tesla models contain between 7,100-8,300 ‘cells,’ while a
smartphone can be powered by a single cell.31 Larger batteries would produce more CO2 gases,
especially if the electricity required for battery manufacturing utilizes fossil fuels. An example for
this would be the use of energy derived from coal plants in Germany to manufacture a battery,
leading to an overall increase in CO2 emissions.32
The battery is not the only design consideration that impacts the life-cycle sustainability of EVs.
Lighter-weight vehicles offer improvements in battery performance. With less energy required
on a per-mile basis, weight reduction reduces electricity consumption, improves vehicle range,
and reduces cost for consumers. Though these all appear to be positive effects for sustainability
and adoption, the assessment becomes more complicated when accounting for materials used
in manufacturing. The primary way to reduce vehicle weight is to use lighter-weight materials in
the vehicle frame. Aluminum is substantially lighter than steel, however the manufacturing
process is significantly more energy-intensive, resulting in a 7 times higher carbon footprint per
29
Bellan, “The State of Electric Vehicle Adoption in the U.S.”
30
Azevedo et al., “Lithium and Cobalt - a Tale of Two Commodities.”
31
Kerns, “When Electric Vehicles Take Over.”
32
Autovista Group, “Conflicting Reports on the Carbon Footprint of EVs.”
12unit.33 While EVs have great potential to decrease the GHG emissions of the transportation
sector, these life-cycle impacts should be taken into account when considering EVs’ overall
sustainability.
5.4 Equity Implications
It is necessary to consider the equity implications of increasing the number of electric vehicles
on the roads. While EVs will definitely have a positive impact on the environment due to
decreased tailpipe emissions, equity driven policies and programs will be needed to ensure EV
adoption is not confined to the wealthy or environmentally conscious. While EVs are
approaching cost parity, especially due to negligible fuel and maintenance costs, there are still
hurdles that need to be overcome, such as their high upfront cost and a varied availability of
charging infrastructure in cities.
Another potential hurdle is the likely increase in electricity prices due to rising peak demand as
the number of electric vehicles connected to the grid rise. The higher rates would impact both
households that have EVs and those that do not, and would disproportionately affect low-
income households. A recent report from the American Council for an Energy Efficient Economy
(ACEEE) highlighted the fact that low income households on an average spend 7.2% of their
household income on utilities, more than thrice as much as a higher income household in 48 of
the largest cities in the United States.34 Thus, there is a need for government intervention
through policies and programs that would specifically promote equity while simultaneously
increasing adoption levels of electric vehicles.
5.5 Federal Policy and EVs
The US government uses a suite of policy tools that directly and indirectly encourage the
adoption of EVs, including financial incentives, emissions standards, and informational tools.
Overall, there has been less action on the part of the federal government to encourage EV
adoption than there has been at the state or local level.
The most impactful federal policies encouraging EV adoption have been financial incentives.
Examples include:
● The plug-in electric tax credit allows purchasers of electric vehicles to take a tax credit
up to 7,500 USD for each vehicle that can be recharged by plugging into the grid.
Multiple studies have shown that this incentive has had a positive impact on EV
adoption.35 This tax credit phases out after a manufacturer has sold 200,000 vehicles.
So far only Tesla and General Motors have met that threshold. These companies along
with Nissan, the Alliance for Automobile Manufacturers, the Edison Electric Institute, and
several environmental and public health groups have been lobbying the Trump
33
Kerns, “When Electric Vehicles Take Over.”
34
Drehobl and Ross, “Lifting the High Energy Burden in America’s Largest Cities: How Energy Efficiency
Can Improve Low Income and Underserved Communities.”
35
Zhou, Levin, and Plotkin, “Plug-in Electric Vehicle Policy Effectiveness: Literature Review.”
13Administration to extend the cap. Working against them are oil and gas interests who are
lobbying to end the credit.
● In April 2019, Senators Debbie Stabenow (D-MI), Lamar Alexander (R-TN), Gary Peter
(D-MI) and Susan Collins (R-ME) and Congressman Dan Kildee (D-MI) introduced the
Driving America Forward Act in both chambers of Congress. The act calls for
increasing the plug-in electric tax credit vehicle cap to 600,000 qualifying sales for each
automaker. So far this act has only been introduced in Congress not approved as law. 36
● There was also a tax credit for the installation of alternative fuel vehicle refueling
property, which included EV charging stations, and expired in 2017. For residential
installations it allowed a tax credit of 1,000 and up to 30,000 USD for business
installations.
Indirectly, EV adoption has been encouraged by the Corporate Average Fuel Economy
(CAFE) Standards. These standards aim to improve the fuel economy of cars manufactured for
sale in the United States. While the Trump Administration proposed rolling back the standards
to lower miles-per-gallon levels, car manufacturers have stated that this has not deterred them
from continuing to produce and sell EVs.37 Investment in transportation electrification
research and development38 has been another way that the federal government has
supported the development and adoption of electric vehicles.
Other initiatives at the federal level that have promoted EV adoption include:
● Electrify America - Volkswagen settlement: While not a government policy, the 2016
Volkswagen settlement has a large impact on the adoption of EV technology nationwide.
Volkswagen has agreed to pay the government 14.7 billion USD to settle allegations of
cheating on emissions standards. Volkswagen is also required to invest 2 billion USD to
increase public awareness about EVs and support public charging infrastructure.39
● Clean Cities Coalitions - The Clean Cities Coalitions Network is a Department of
Energy (DOE) program. Under this federal umbrella there are almost one hundred
coalitions in the United States made up of local stakeholders. The local coalitions
undertake transportation projects, such as implementing alternative fuels like electric
batteries, fuel-saving technologies and practices, and new mobility choices in their
communities. At the federal level the DOE provides information and resources to help
stakeholders achieve their alternative fuel goals, in the form of federal grants and data-
driven online tools such as the Alternative Fuels Data Center. Clean Cities Coalitions
help with building EV infrastructure and encourage EV fleets.40
36
Stabenow, “S.1094 - 116th Congress (2019-2020).”
37
Merchant, “Can the Electric Vehicle Push Defy a CAFE Standards Rollback?”
38
Canis, Clark, and Sherlock, “Vehicle Electrification: Federal and State Issues Affecting Deployment.”
39
Bellan, “The State of Electric Vehicle Adoption in the United States”
40
U.S. Department of Energy, “Clean Cities Coalition Network.”
146 Shared Mobility
Shared mobility refers to transportation services and resources that are shared among users,
either concurrently or one after another.41 This includes public transit; taxis and limos;
carsharing; carpooling and vanpooling; ride-hailing; micromobility (bikesharing and scooter-
sharing); shuttle services and “microtransit”; and more. This report will address the newest and
most disruptive of these services to the American transportation system—ride-hailing and
micromobility.
6.1 Shared Mobility Adoption in the United States
Use of certain forms of shared mobility, such as ride-hailing and micromobilty, has been growing
in the United States, especially among younger city residents. However, shared mobility usage
in the United States is still much lower than in Europe or China, since driving a personal vehicle
is often the cheapest (due to low gas prices) or most available mode of transport. The most
common form of shared mobility in the United States is ride-hailing,42 but it is still mostly
concentrated in urban centers. Similar to EVs, the users of shared mobility are predominantly
younger, urban, middle-upper income, highly-educated, and male. Young people in particular
are more likely to try shared mobility: 42% of millennials are willing to try ride-hailing and other
modes of shared mobility, whereas in older generations only 28% are willing to try.43
6.1.1 Ride-hailing with Transportation Network Companies (TNCs)
Ride-hailing is an arrangement where a passenger travels in a private vehicle driven by its
owner for a fare. Booking of and paying for rides is done through a smartphone app with a
transportation network company (TNC) such as Uber or Lyft. In ride-hailing, there is only one
passenger or group riding in the vehicle. Ride-sharing is another option offered by TNCs and is
similar to ride-hailing with the exception that the driver may pick up additional passengers along
the route requiring passengers to share their ride with strangers. Ride-sharing fares per
passenger tend to be lower to account for the reduced convenience and comfort.
Ride-hailing is the most well-known and widely used form of shared mobility in the United
States. Since 2015, the share of the US population that has used ride-hailing services has more
than doubled.44 Despite its relative popularity with respect to other modes of shared mobility,
42% of respondents in a Deloitte study reported that they had never used a ride-hailing service.
However, in 2017, that number was greater, with 55% never having used ride-hailing.45 We find
ride-hailing is still an emergent technology as so many people still have not used it.
41
“What Is Shared Mobility?”
42
Santos, “Sustainability and Shared Mobility Models.”
43
Giffi et al., “The Changing Nature of Mobility.”
44
Jiang, “More Americans Are Using Ride-Hailing Apps.”
45
Vitale et al., “2019 Global Automotive Consumer Study.”
156.1.2 Micromobility
Micromobility includes shared bicycles, electric pedal assisted bicycles, and electric scooters. It
is usually used to travel short distances, often the first or last mile of a journey or connections to
public transit. Shared bicycles can be stationed-based, meaning they have to be returned to a
designated station at the end of the ride or free-floating, where they can be left anywhere
streetside within a certain geographical area. Electric scooter programs are usually free-floating.
Micromobility use in the United States has been increasing. From 2017 to 2018, the number of
trips that Americans took by shared micromobility more than doubled, totalling 84 million trips in
2018.46 The micromobility market in the US is predicted to be worth 200-300 billion USD by
2030.47 While stationed bikeshare has the longest history in the US, in 2018 electric scooter use
emerged as extremely popular and surpassed station-based bikeshare in number of rides taken
(see Figure 3).
Figure 3: Shared Micromobility Trips Per Year48
The adoption of micromobility in the United States will be somewhat slowed by the fact that the
use of micromobility is concentrated in urban areas, where distances between points of interest
are closer. The six cities with the most station-based bikeshare usership account for 84% of all
station-based bike trips in the country. Similarly for e-scooters, three metropolitan areas account
for 40% of all trips nationwide.49 Since the adoption of micromobility has exploded in some
46
NACTO, “Shared Micromobility in the U.S.”
47
Heineke et al., “Micromobility’s 15,000-Mile Checkup.”
48
Taken from DuPuis and Griess, “Micromobility in Cities: A History and Policy Overview.”
49
NACTO, “Shared Micromobility in the U.S.”.
16places but has not actually reached that many cities, we classify micromobility as on the cusp
between an experimental and emergent technology.
6.2 Sustainability Implications
Shared mobility offers the promise of reducing emissions and congestion by getting people to
stop driving alone and share a ride or use a bike or scooter. Whether or not shared mobility
actually does that depends on the mode. Ride-hailing, the most common form of shared mobility
in the United States, has been shown to increase congestion in certain cities, as drivers often
drive around passenger-less between customers.50 Ride-hailing has also had the effect of taking
some passengers off of public and active transportation and into cars.51 According to a recent
study by the Union of Concerned Scientists, trips on ride-hailing services produced nearly 70%
more emissions than the modes of transportation they replace.52 Ride-hailing trips are shared
only around 15% of the time, but pooling more trips could help reduce both emissions and
congestion impacts.53 Pooled trips in EVs could significantly reduce the climate impacts of ride-
hailing by cutting emissions up to 68% compared to a private car trip.54
All micromobility options are more environmentally friendly than a private vehicle trip. However,
electric scooters are less environmentally friendly than many of the modes of transport they
replace: walking, bicycling, and some modes of public transportation. While tailpipe emissions
are non-existent for e-scooters, it is their entire life cycle, which includes the production of
lithium-ion batteries and aluminum parts; manufacturing; shipping (often from China); and the
collecting, charging, and redistributing of scooters, that makes up their environmental impact.55
Similarly, bikeshare bikes need to be redistributed, though unless they are electric assist they
do not need to be recharged.
6.3 Equity Implications
As mentioned above, users of shared mobility are more likely to be younger, male, and well
educated compared to the general population. This is despite the fact that shared mobility could
enhance the mobility of disadvantaged communities through improved job access and by
making mobility cheaper, more available, and faster. Access to credit and debit cards for low-
income commuters is a challenge for micromobility and ride-hailing use as the associated
smartphone apps and stationed bikesharing kiosks require a credit or debit account.
Disability access is also a challenge for shared mobility where very few ride-hail vehicles are
equipped to take on a passenger in a wheelchair and micromobility options are almost
50
Hawkins, “Uber and Lyft Finally Admit They’re Making Traffic Congestion Worse in Cities.”
51
Fitzgerald and Li, “Driving a Shared, Electric, Autonomous Mobility Future: What China, India, and the
United States Can Learn from Each Other.”
52
Union of Concerned Scientists, “Ride-Hailing Is a Problem for the Climate.”
53
Urbanism Next, “Estimated Percent of Total Driving by Lyft and Uber.”
54
Union of Concerned Scientists, “Ride-Hailing Is a Problem for the Climate.”
55
Hollingsworth, Copeland, and Johnson, “Are E-Scooters Polluters?”
17exclusively designed for able-bodied users. The dockless versions of micromobility, when not
properly placed or ridden off the path of the sidewalk can become harmful obstacles for disabled
pedestrians. As a result there have been two lawsuit filed against micromobilty companies for
violating the Americans with Disabilities Act.56
Ride-hailing and sharing use in the United States is largely concentrated in urban centers. Only
19% of Americans living in rural areas use ride-hailing apps, whereas in urban and suburban
areas, those numbers are 45% and 40% respectively.57 Rural areas are much less lucrative
money-making opportunities for potential drivers and the ride-hailing companies themselves,
since there are fewer and typically longer rides. Indeed, ride-hailing is most economical for all
where the distance is short and the parking is expensive, which is not usually the case in rural
areas.58
6.4 Federal Policy and Shared Mobility
The federal government has played a very limited role in regulating shared mobility. State and
especially local governments tend to play a larger role due to their involvement in transportation
planning, parking policies, and public transportation.59 TNCs like Uber and Lyft classify
themselves as technology companies, so they have largely avoided being regulated like
traditional transportation companies. This has drawn criticism, especially as the companies
avoid transportation and labor regulations.60 However, it has been states like California, New
Jersey, and New York, rather than the federal government, that have proposed laws to regulate
these companies.61
For micromobility, scooters are regulated the same as bicycles at the federal level. An electric
bicycle (or scooter) is considered legal to go on the roads if it does not go above 20 mph and
has a maximum motor power of 705W. Within this range the scooter or bicycle does not require
a license or registration in most states. Like bicycles, electric scooters should go in the bike
lane, where available, and are permitted in the street with cars, where not.62
56
Kerr, “Disability Rights Group Sues Scooter Companies over Clogged Sidewalks.”
57
Jiang, “More Americans Are Using Ride-Hailing Apps.”
58
Shrikant, “Transportation Experts See Uber and Lyft as the Future. But Rural Communities Still Don’t
Use Them.”
59
Shaheen, Cohen, and Zohdy, “Shared Mobility Current Practices and Guiding Principles.”
60
Beene, “Uber, Lyft May Face More Federal Oversight, Lawmaker Warns.”
61
Sherman, “‘Catastrophically Huge’: New Labor Laws Aimed at Independent Contractors Could Be a
Huge Drag on Uber and Lyft Stock.”
62
EnvyRide, “Laws and Legislation on Electric Scooters.”
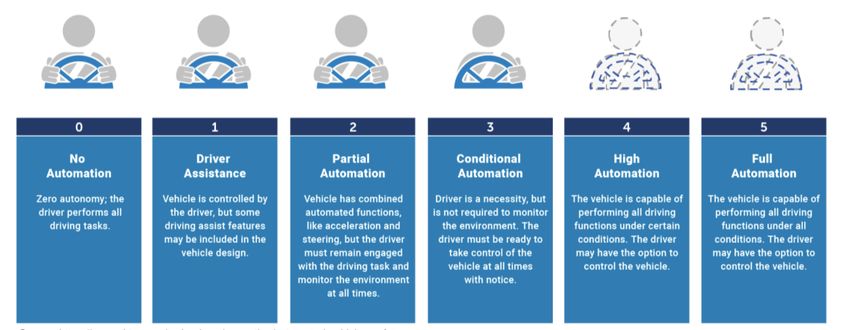
187 Autonomous Vehicles
Autonomous vehicles (AVs) have drummed up a lot of hype in recent years. A fully autonomous
vehicle is one that can guide itself without human direction, or even a human present in the car.
There are five levels of autonomous driving, but we will primarily deal with the highest levels (4
and 5) or high and full automation, since they will be the most disruptive and do not require a
human driver in most conditions (Figure 4). Levels 1-3 range from driver assistance to
conditional automation, and there are many such systems on the market today, but all require a
driver to be in the car.63 Both automakers and software companies are testing fully autonomous
models, but none yet are available on commercial markets.
Figure 4: Automation Levels64
7.1 Autonomous Vehicle Adoption in the US
While some have promised that AVs will hit the market soon, the theory that there will be a
massive adoption of AVs in the near future is flawed. To launch AVs somewhere, there needs to
be rich and textured maps for the vehicle to use that include not just street maps and GPS
information, but also visual imagery of the streets. The process of mapping with this level of
detail is very time and resource intensive, which is why there are only a small number of pilot
programs in select cities. For this reason, AVs are clearly still in the experimental phase of the
adoption curve.
Currently, Uber is testing in Pittsburgh, Pennsylvania, and the Dallas-Ft. Worth area in Texas;
Ford is running a pilot in Austin, Texas; and Waymo is testing in Phoenix, Arizona. Almost all of
these cities are in the Sunbelt where the weather is clear and sunny most of the time, the cities
are less dense with larger metropolitan areas, and there are not strong public transportation
63
National Highway Traffic Safety Administration, “Automated Vehicles for Safety.”
64
Taken from National Highway Traffic Safety Administration.
19networks.65 Rain, snow, and stormy weather still pose a significant technical challenge to AV
development as the computers need to learn how to interpret the precipitation correctly, “see”
around it, and modify driving accordingly.
AVs that operate more as slow-moving shuttles along a set route are likely to be adopted much
faster than a personal-vehicle model. Ideal for campuses and shopping areas with limited traffic,
these shuttles are already being piloted in a wide range of locations across the country, such as
Florida, Texas, Colorado, Maryland, and Massachusetts.
7.1.1 Consumer Perceptions
According to a BCG survey, 52% of respondents said they were likely or very likely to take a
ride in an AV. When considering the possibility of one day riding in an AV, many consumers are
drawn to convenience. The ability to drop someone off, find a parking spot, and park without a
driver were some of the top reasons that people would want an AV. Another selling-point is the
ability to multitask while the car drives.66
Young and technologically savvy people are more likely to say that they intend to use AVs.67
Knowing this, AV companies are targeting the younger generations who tend to be more urban,
more connected, and less interested in car ownership and more interested in potential AV
subscription-based service models.68 Desire for automation is strongest for lower level features,
such as driver assistance to prevent skidding. Millennials prefer these features in cars; however,
they are not necessarily willing to pay more for vehicles with them.69
One roadblock to eventual AV adoption is trust—or lack thereof—that people have for a
computer to drive a car. Reports of accidents during self-driving tests, such as a pedestrian
killed in Arizona in 2018,70 reduce the trust people have in AVs. Media reports of accidents have
caused over 50% of consumers to state that they are more cautious of AV technology.71
Consumer perception on whether AVs will be safe dropped everywhere from 2017 to 2018 and
did not improve much in 2019.72 In this way, the race to develop the first commercially-available
AV is just as much of a “trust race” as it is a “technology race” for the industry.73 One way that
trust in AVs could be rebuilt and boosted is through the promotion of lower levels of automated
driving that are already popular, such as Advanced Driver Assistance Systems (ADAS). People
with ADAS features in their vehicles are more willing to use AVs.74 Also, the more the public
65
Rubin, interview.
66
BCG, “Self-Driving Vehicles & Car Sharing.”
67
HERE Technologies, “Consumer Acceptance of Autonomous Vehicles.”
68
Rubin, interview.
69
Giffi et al., “The Changing Nature of Mobility.”
70
Hawkins, “Uber Halts Self-Driving Tests after Pedestrian Killed in Arizona.”
71
Vitale et al., “2019 Global Automotive Consumer Study.”
72
Vitale et al.
73
Rubin, interview.
74
HERE Technologies, “Consumer Acceptance of Autonomous Vehicles.”
20You can also read


