Target 75 Update: Squid 2019 - Sustainable Fisheries Partnership
←
→
Page content transcription
If your browser does not render page correctly, please read the page content below
Target 75 Update: Squid 2019
TARGET 75 SECTOR UPDATE: SQUID 2019

Execu:ve Summary

This report is a follow-up to the 2018 T75 Squid Sector report. While much of the language
remains the same, we have updated this report to include new data acquired since the previous
report’s release.

SFP’s Target 75 (T75) ini:a:ve has set a goal to see that 75 percent of the world’s seafood
produc:on is considered sustainable or making regular, verifiable improvements by 2020. To
simplify achieving and measuring progress toward this goal, SFP has divided the world’s
fisheries and farmed seafood produc:on into various “sectors,” defined by groups of species.
While the sectors as a whole do not cover the en:rety of the global seafood industry (e.g., some
high-volume species groups such as carp, milk fish, and some shellfish are not included), those
included represent a substan:al propor:on of the commercial seafood produc:on of
importance to markets currently demanding sustainability.

For the purposes of this analysis, we define a fishery as “sustainable” if it is Marine Stewardship
Council (MSC) cer:fied or green-listed in SFP’s Metrics tool. We define a fishery as “improving”
if it is cer:fied by one of the following programs: IFFO RS, ASMI RFM, Iceland Responsible
Fisheries, Fair Trade USA; if it is under full assessment in the MSC program; or if it is in a fishery
improvement project (FIP) that is making good progress (i.e., with a progress ra:ng of A, B, or C
using SFP’s FIP evalua:on tool).

In this report, SFP provides informa:on on the current status of the sector in terms of volumes
coming from sustainable and improving fisheries, and, most importantly, we map out a path to
close the gap to Target 75. We base the analysis on a blend of data and expert opinion on
priority fisheries. SFP obtained produc:on volumes and addi:onal informa:on relevant to this
analysis from the FAO FishStat database, relevant countries’ na:onal sta:s:cs, and the
respec:ve cer:fica:on programs’ websites and cer:fica:on reports (e.g., MSC, ASMI RFM).
Trade data provide a guide to how much of the produc:on goes to markets that are highly
engaged in sustainability (e.g., EU, US), markets with ac:vi:es that engage in improvements
(e.g., Brazil, China, Indonesia, Japan), and markets with liale evidence of engagement in
sustainability or immediate plans to engage in improvements (e.g., Nigeria, Vietnam). Such

   sustainablefish.org                                                                               2
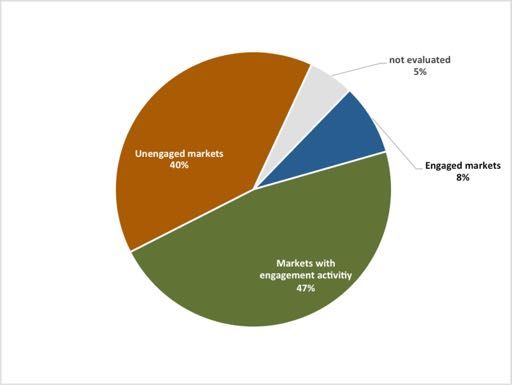
trade data provide some insights into the likely influence key markets have, but is combined
with expert opinion and informa:on on the structure of produc:on in each country, in order to
determine whether a fishery is a candidate to contribute to the Target 75 ini:a:ve’s goal.

Squid sector

The squid sector comprises all squid species (families: Gona:dae, Loliginidae, Ommastrephidae,
Onychoteuthidae). Squids are mostly traded fresh/chilled or frozen, although some small
volumes are also traded dried, prepared, or preserved. Most produc:on comes from industrial
fisheries using a wide variety of fishing gears, including jigs, hook and line, purse seine, mid-
water, and boaom trawling, opera:ng within exclusive economic zones (EEZs) and in
interna:onal waters. An important ar:sanal component operates in a number of EEZs, ranging
from small vessels with outboard motors carrying two or three fishers to vessels of 15 meters or
more carrying five or six fishers.

Global Supply and Pa.erns of Trade
• FAO reports total global produc:on of more than 3.7 million tonnes. For countries that are
   known to capture squids but where there is no reported catch at the family level (e.g.,
   Cambodia, Madagascar, Mozambique, Somalia), we have used landings data at the lowest
   taxa reported (typically “cephalopods nei”) or have es:mated squid produc:on based on
   other sources (e.g., for India, Vietnam).
• More than 95 percent of global produc:on comes from only 18 countries (see Figure 1).
• Imports – Of the 1.26 million tonnes in traded volume in 2014 (Interna:onal Trade Center,
   2014), China imported the most, with 31 percent of total imports, followed by the EU at 25
   percent, Thailand at 11 percent, and South Korea and the US, each with 6 percent of total
   imports.
• Exports – Of the total traded volume in 2014 (Interna:onal Trade Center, 2014), China leads
   again with 22 percent of total global exports, followed by Peru at 13 percent, the US with 8
   percent, Spain at 6 percent, North Korea at 5 percent, India and Taiwan with 5 percent each,
   Chile and Argen:na with 4 percent each, and Indonesia with 3 percent.
• Approximately 8 percent of global produc:on goes to markets engaged in sustainability,
   with a further 47 percent going to countries with some engagement efforts underway
   (Figure 2).

   sustainablefish.org                                                                           3
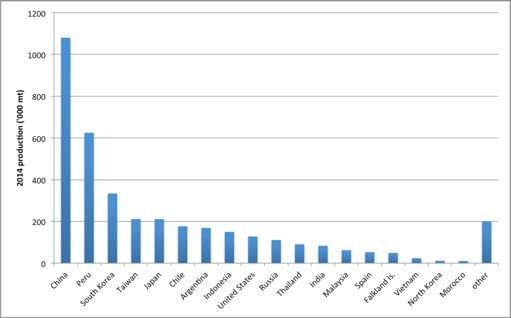
Figure 1. Top 18 squid-producing countries, 2014 produc@on
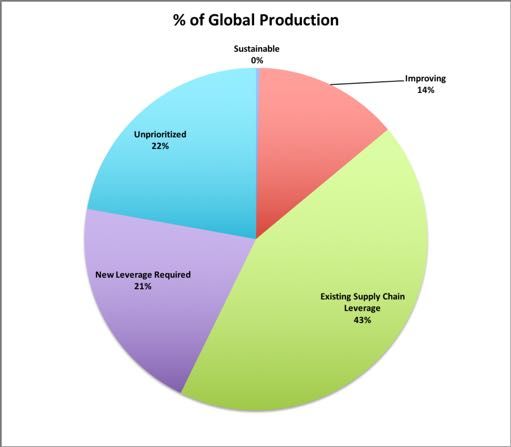
Figure 2. Strategy to reach Target 75 for the squid sector
sustainablefish.org 4Improvement Progress to Date
Based on 2014 produc:on data, 527,470 tonnes, or 14 percent of global produc:on, are
currently considered sustainable or improving (see Annex: Table 1), using publicly available
informa:on on MSC status and FIP progress ra:ngs reviewed in January 2019. This is a
substan:al improvement over the volumes reported in the previous Squid Sector Report
(January 2018), when only 0.3 percent of global produc:on was sustainable or improving.
• MSC-cer:fied fisheries
US Northeast Longfin Inshore Squid Boaom Trawl Fishery, longfin squid
• MSC Full Assessment
US Northeast Longfin Inshore Squid Boaom Trawl Fishery, shorpin squid
• FIPs with A–C-rated progress/AIPs
Auckland Islands Arrow Squid – C progress
Mexico Gulf of California Giant Squid – C progress
New Zealand EEZ Squid – B progress
Peruvian Jumbo Flying Squid – C progress
Shantou-Taiwan Chinese Common Squid – C progress
Closing the Gap to Target 75
Exis%ng Supply Chain Leverage and Interest
The primary target fisheries for improvement are those in FIPs not making good progress, major
fisheries in which exis:ng SR par:cipants have market leverage to deliver improvements, and
those fisheries that SFP believes are likely candidates for improvement projects. Together, these
fisheries account for more than 1.6 million tonnes of produc:on, represen:ng 43 percent of the
global total (see Annex: Table 2).
• Other FIPs
The East China Sea and Yellow Sea Japanese flying squid FIP was launched
by Ocean Outcomes and the China Aqua:c Products Processing and
Marke:ng Alliance (CAPPMA) in November 2018. This FIP has not yet met
the criteria of an ac:ve FIP and has not yet received a progress ra:ng; thus
it is not counted as "Improving" at this :me. When it does become ac:ve,
an addi:onal 5,000 tonnes will be added to the “Sustainable and
Improving” category.
• Supply Chain Roundtables
The South American Squid SR and the Asia-Pacific Squid SR merged into one
group—the Global Squid SR—in March 2017. Though the name of the SR
sustainablefish.org 5suggests global coverage of squid fisheries, current par:cipant leverage
does not encompass all of the fisheries necessary to achieve the Target 75
goal. Current SR par:cipants helped to catalyze new FIPs in China (mitre
squid and Japanese flying squid) and Peru (jumbo flying squid), and further
efforts are needed to expand the coverage of these FIPs to include a larger
por:on of the fisheries. Other fisheries of interest that may be covered by
this SR include Argen:ne shorpin squid, Patagonian squid, and jumbo flying
squid in South America, as well as Japanese flying squid and common squids
in Asia.
Urgent Addi%ons Requiring New Supply Chain Engagement
Target 75 can only be achieved by expanding improvement efforts to Chinese fleets opera:ng in
interna:onal waters off South America, where they target Argen:ne shorpin squid off the
Atlan:c coast and jumbo flying squid in the Pacific. In addi:on, the engagement of the South
Korean market will cover another 3 percent of global produc:on caught in interna:onal waters
off South America (jumbo flying squid and Argen:ne shorpin squid). See Annex: Table 3 for the
respec:ve volumes of these fisheries.
Improvement Opportuni@es and Challenges
A number of factors favor improvement in sustainable squid fishing. Unlike some species, squid
grow rapidly and typically have an annual life cycle, reproducing and dying at the end of one
year. This makes squid stocks resilient to fishing, for example when compared to fish. Also, the
most common fishing methods used in squid fisheries—apart from boaom trawling—are known
to have rela:vely low environmental impacts.
Near real-:me fisheries data collec:on has been demonstrated to be an effec:ve complement
to scien:fic surveys helping to improve stock assessment methodology and, therefore, should
be a key element of the management strategies for squid fisheries. This has been seen, for
example, in the Japanese flying squid fishery within the Japanese EEZ, the Argen:ne shorpin
squid fishery in the Southwest Atlan:c, and the Patagonian squid fishery in the Falklands
management zones in the Southwest Atlan:c.
Monterey Bay Aquarium’s assessment of Japan’s Japanese Flying Squid fishery shows that squid
fisheries can operate sustainably; this fishery should serve as a model for similar improvement
efforts.
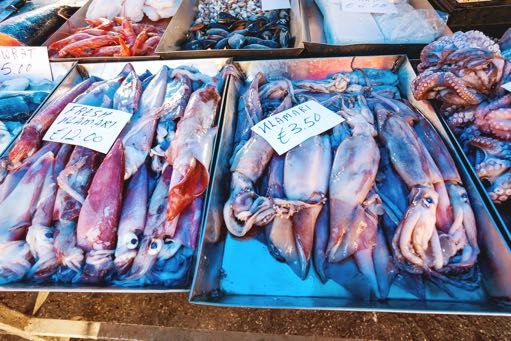
sustainablefish.org 6In February 2018, a new industry group, Comité para el Manejo Sustentable del Calamar Gigante del Pacifico Sur (CALAMASUR), or the Commiaee for the Sustainable Management of the Southern Pacific Jumbo Flying Squid, was formed to improve squid fishery management and enforcement at the regional fisheries management organiza:on (RFMO) level. As improvement efforts progress, coopera:on between different jurisdic:ons will be key. The three biggest stocks worldwide (jumbo flying squid, Japanese flying squid, and Argen:ne shorpin squid) will require interna:onal coopera:on and/or agreements to develop management structures and implement management measures to ensure the long-term sustainability of the different fisheries opera:ng on each of those stocks. For management relying on an RFMO-type model, ongoing poli:cal disagreements between neighboring countries are likely to remain an obstacle, especially in the Southwest Atlan:c. Given the importance of the near real-:me data collec:on from fishing fleets stated above, three areas are likely to need addressing in order to enable key sustainability improvements: investment in various at-sea data collec:on and transmission technologies and monitoring capacity; investment in the technical capacity of scien:fic ins:tu:ons to op:mally analyze and use these data; and development of the ability of regulatory authori:es to be responsive to the fishery and stock abundance in near real-:me. Summary A great deal of progress has been made in the squid sector in the last year, with the addi:on of three new FIPs and the improved progress of two exis:ng FIPs. Yet, with 14 percent of global produc:on recognized as sustainable or improving, there is a great deal of room for improvement to be made in large-scale squid fisheries. Efforts to engage the interna:onal supply chain are s:ll in the early stages, which makes it hard to define a clear, high-confidence route to close the gap to T75. That said, there are, fortunately, a number of fisheries making incremental improvements that are not yet publicly recorded under FIPs. It is possible that exis:ng supply chain leverage and interest may be able to influence an addi:onal 43 percent of global produc:on. The key to reaching T75 is engaging Chinese and South Korean fisheries opera:ng in the interna:onal waters off South America. The industry can accomplish this through demand from some markets already engaged in sustainability, engaging the markets where those products end up, and crea:ng demand for sustainable products from new markets. sustainablefish.org 7
Figure 3. Strategy to reach Target 75 for the squid sector

   sustainablefish.org                                        8
Annex: Progress toward Target 75 goal

The following tables show key figures in gauging the progress of global squid produc%on toward
the Target 75 goal. The table format will be reprised in future reports with updated figures.

Table 1. Volume considered sustainable or improving, as of January 2019

 T75 Category               Volume (mt)               % of Global
                                                      Production
 Sustainable: MSC-                     12,040                       0.3
 C or FS Green
 Improving: MSC-                        8,770                       0.2
 FA
 Improving: FIPs                     506,660                      13.4
 (rated A–C)
              Total                  527,470                    13.9%

Table 2. Target squid fisheries with exis@ng supply chain leverage and interest

 Production                2014 Landings               % Global             Improvement
 Source                        (mt)                   Production              Outlook
 East China Sea and                      5,000                      0.1 This FIP was
 Yellow Sea                                                             launched in
 Japanese flying                                                        November 2018
 squid FIP                                                              but has not yet met
                                                                        the criteria for an
                                                                        active FIP or
                                                                        received a progress
                                                                        rating.
 Spain, Argentine                       33,460                      0.9
 shortfin squid (FAO
 41)
 Falkland Islands,                      43,110                      1.1
 Patagonian squid
 Falkland Islands,                       6,150                      0.2
 Argentine shortfin
 squid
 China, mitre squid,                    70,000                      1.9
 non-FIP volume
 China, squids nei,                   306,730                       8.1
 non-FIP volume
 Japan, Japanese                      173,110                       4.6
 flying squid (East
 China Sea and East/
 Japan Sea)

    sustainablefish.org                                                                        9
Indonesia, common 112,050 2.9
squids nei (FAO 71)
Indonesia, common 37,790 1.0
squids nei (FAO 57)
Thailand, common 70,780 1.9
squids nei (FAO 71)
Thailand, common 14,330 0.4
squids nei (FAO 57)
Argentina, 168,730 4.4
Argentine shortfin
squid
Chile, jumbo flying 176,600 4.7
squid
Peru, jumbo flying 153,110 4.1
squid, non-FIP
volume
India, squids nei 83,220 2.2
(FAO 51, 57)
South Korea, 163,890 4.3
Japanese flying
squid (East China
Sea and East/Japan
Sea)
Ecuador, jumbo 18,150 0.5
flying squid
(Eastern Pacific)
Total 1,636,210 43.3%
Table 3. Addi@onal fisheries that must be engaged to close the gap to T75
Production 2014 Harvest (mt) % Global
Source Production
China, Argentine 336,000 8.9
shortfin squid
(FAO 41)
China, jumbo 332,520 8.8
flying squid (FAO
87)
South Korea, 103,340 2.7
Argentine shortfin
squid (FAO 41)
South Korea, 7,200 0.2
jumbo flying
squid (FAO 87)
Total 779,060 20.6%
sustainablefish.org 10You can also read