Technical Memo #3: GNC SWOT Analysis - The Great ...
←
→
Page content transcription
If your browser does not render page correctly, please read the page content below
Technical Memo #3:
      GNC SWOT Analysis
           PERIOD COVERED JAN-AUGUST 2014

Prepared by the Olsson Associates Team

Prepared for the Montana Department of Transportation

                                            10.27.2014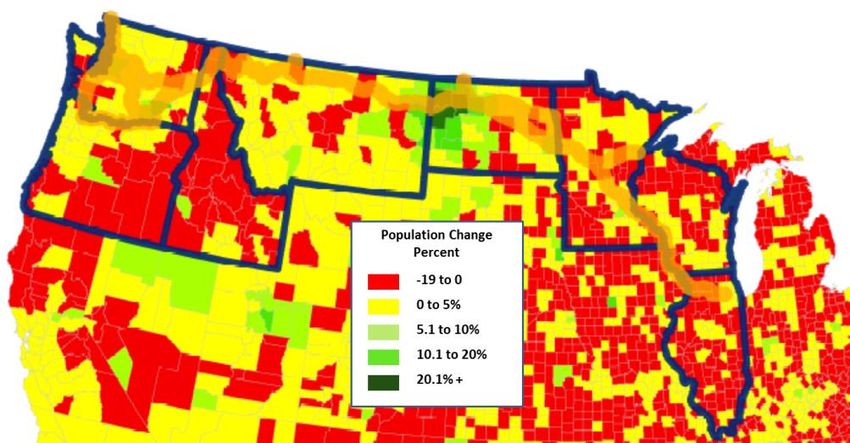
Technical Memo #3 | SWOT Analysis

                  TECHNICAL REPORT DOCUMENTATION PAGE

1. Report No. 3                                              2. Government Accession No.         3. Recipient's
                                                                                                 Catalog No.
4. Title and Subtitle                                        5. Report Date October 27, 2014

Great Northern Corridor SWOT Analysis – Technical            6. Performing Organization Code
Memorandum #3

                                                             8. Performing Organization Report No. 3
7. Author(s)

Olsson Associates
Parsons Brinckerhoff
The Beckett Group
9. Performing Organization Name and Address                  10. Work Unit No.
                                                             11. Contract or Grant No.
Olsson Associates
2111 S. 67th Street, Suite 200
Omaha, NE 68106
12. Sponsoring Agency Name and Address                       13. Type of Report and Period Covered

Research Programs                                            Type: Technical Memorandum
Montana Department of Transportation                         Period Covered: January 2014-July 2014
2701 Prospect Avenue
P.O. Box 201001                                              14. Sponsoring Agency Code        5401
Helena, MT 59620-1001
15. Supplementary Notes

Research performed in cooperation with the Montana Department of Transportation and the US Department of
Transportation, Federal Highway Administration.

                                                                                                      PAGE i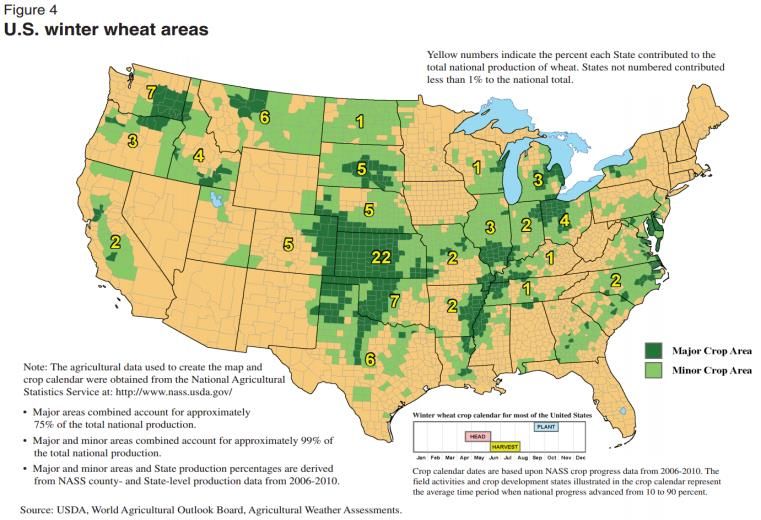
Technical Memo #3 | SWOT Analysis

16. Abstract

Technical Memorandum #3: GNC Scenario Planning and SWOT Analysis will recap the Scenario Planning workshop
held in Vancouver, Washington, in May 2014 and use the outcomes of that workshop, along with an analysis of trends
and issues facing freight transportation now and into the future, to formulate an initial SWOT analysis.

17. Key Words                                                 18. Distribution Statement
                                                              Unrestricted. This document is available through the
                                                              National Technical Information Service, Springfield,
                                                              VA 21161.
19. Security Classif. (of this   20. Security Classif. (of    21. No. of Pages                  22. Price
report)                          this page)

Unclassified                     Unclassified

        Disclaimer Statement
        This document is disseminated under the sponsorship of the Montana Department of Transportation
        (MDT) and the United States Department of Transportation (USDOT) in the interest of information
        exchange. The State of Montana and the United States assume no liability for the use or misuse of its
        contents.

        The contents of this document reflect the views of the authors, who are solely responsible for the facts
        and accuracy of the data presented herein. The contents do not necessarily reflect the views or official
        policies of MDT or USDOT.

        The State of Montana and the United States do not endorse products of manufacturers.

        This document does not constitute a standard, specification, policy, or regulation.

                                                                                                    PAGE ii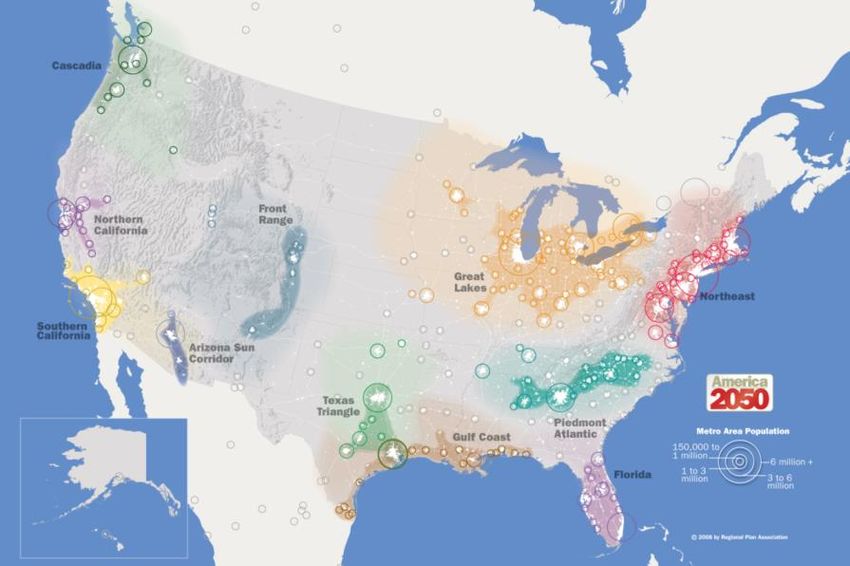
Technical Memo #3 | SWOT Analysis

Table of Contents
Introduction ................................................................................................................................................................ 1
Chapter 1: Trends and Issues facing the Great Northern Corridor ............................................................................ 5
   Demographic and Societal Trends (US Census Bureau) ....................................................................................... 5
   Energy and Environmental Trends ........................................................................................................................ 9
   Technology Trends .............................................................................................................................................. 11
   Economic Trends ................................................................................................................................................. 13
   Government and Political Trends ........................................................................................................................ 17
Chapter 2: Scenario Planning Workshop Results .................................................................................................... 22
   Global Marketplace.............................................................................................................................................. 22
   One World Order ................................................................................................................................................. 25
   Millions of Markets.............................................................................................................................................. 28
   Naftastique ........................................................................................................................................................... 31
   SWOT Analysis Summary ................................................................................................................................... 34
   Future Scenario Commonalities ........................................................................................................................... 35
Chapter 3: Conclusion.............................................................................................................................................. 36

Table of Exhibits
Exhibit 1: Driving Forces Influencing Freight Transportation .................................................................................. 1
Exhibit 2: Trends and Potential Flow Impacts ........................................................................................................... 3
Exhibit 3: US Civilian Work Force by Age Group .................................................................................................... 5
Exhibit 4: Emerging Mega-Regions .......................................................................................................................... 6
Exhibit 5: Population Change in the GNC States by County 2010 – 2013 (US Census Bureau) .............................. 7
Exhibit 6: Mode Share for GNC States by Tonnage .................................................................................................. 7
Exhibit 7: Dimensions of Sustainability .................................................................................................................... 9
Exhibit 8: Forecast for Freight Rail LNG Adoption ................................................................................................ 10
Exhibit 9: US Winter Wheat Growth Areas............................................................................................................. 11
Exhibit 10: Top 5 Destinations for GNC Exports .................................................................................................... 13
Exhibit 11: Northwest Passage Route ...................................................................................................................... 14
Exhibit 12: North American Ports by Depth ............................................................................................................ 16
Exhibit 12: GNC Futures Scenario SWOT Discussion Summary ........................................................................... 34

                                                                                                                                                   PAGE iii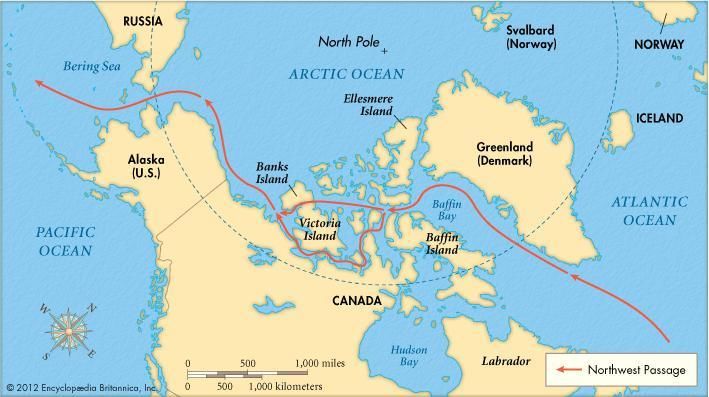
Technical Memo #3: SWOT Analysis

Introduction
This Technical Memorandum identifies and explores broad trends and issues that may affect the future of freight
transportation across the Great Northern Corridor (GNC). These trends and issues are examined from five
perspectives, which previous research, conducted through the National Academy of Sciences, Transportation
Research Board, has identified as key driving forces that influence transportation (ICF 2009). These five forces
are depicted in the graphic of Exhibit 1 below:

Exhibit 1: Driving Forces Influencing Freight Transportation

Source: Olsson Associates, adapted from ICF International/NCFRP Project 20-80: Long-Range Strategic Issues Facing the
Transportation Industry, Final Research Plan Framework. October 17, 2009.

This technical report was developed through a two-step process: 1) Key issues and trends affecting freight
transportation were identified through an environmental scan based on a survey of key issues among GNC
Coalition members, popular press, and Web research. 2) The identified trends and issues were broadly vetted and
discussed with freight stakeholders during a Future Freight Flows Scenario Planning Workshop held in
Vancouver, Washington, on May 13, 2014.

The team has used scenario planning as a means of examining how the future could be shaped by the five key
forces identified in the chart above. Each scenario is evaluated without making predictions of which driving force

                                                                                                    PAGE 1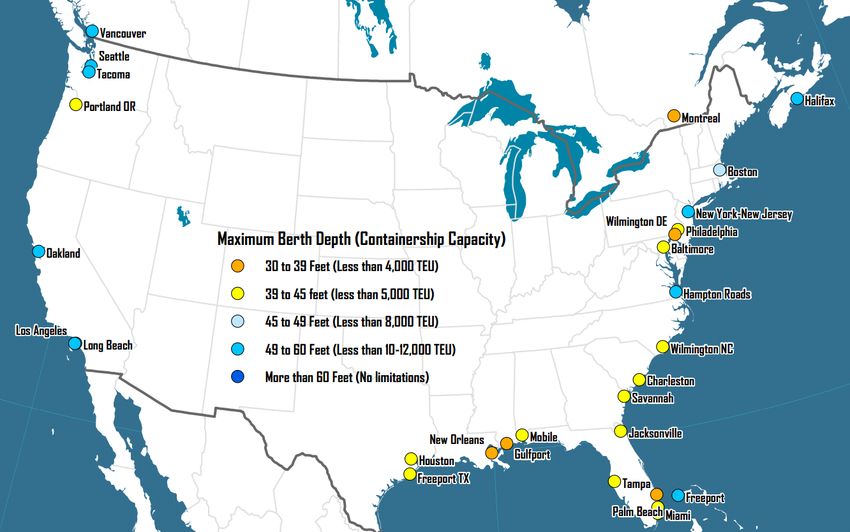
Technical Memo #3: SWOT Analysis

will prevail over the others in shaping the future. Scenario planning does not predict the future, but it serves to
raise the consciousness of planners, market analysts, and developers regarding possibilities for the future. One
response to this increased awareness of future outcomes is the creation of an agenda that explores the impacts,
opportunities, and threats of likely future outcomes.

Four Divergent but Plausible Futures
The GNC scenario planning workshop conducted in Vancouver on May 13, 2014, was based on four different
potential futures that were developed by researchers at the Massachusetts Institute of Technology (MIT). This
MIT research was funded through the Transportation Research Board and was described in NCHRP Report 750:
Strategic Issues Facing Transportation, Volume 1: Scenario Planning for Freight Transportation Infrastructure
Investment (Caplice and Phadnis 2013). The report looks at four future scenarios. Two of the scenarios, One
World Order and Naftastique, are visions of futures driven by geo-political forces responding to changes in global
policies to conserve or secure scarce resources. The other two scenarios, Millions of Markets and Global
Marketplace, are primarily market driven futures shaped by technology and economics. A brief overview of each
scenario is provided in the following section.

One World Order
Facing global scarcity of key resources, nations establish international rules to ensure their fair
and sustainable use. Global trade thrives, but its course is shaped by the very visible hand of
regulation, at times an iron fist in a velvet glove. During the workshop, participants viewed this
future as one where “Big Brother” would be constantly interceding on businesses to reduce environmental
impacts, resulting in less responsive but more consistent transport services and “green supply chains.” This future
was also shaped by concentrated populations in large urban areas that compete economically by what they do well
(or most efficiently). Rural areas under this scenario were viewed as vast empty territories, with a few outposts
and a high level of service and transport automation.

Naftastique
As world trade moves away from a global market, several regional trading blocs emerge. China,
Europe, and South America form their own clusters. The United States leads an effort to make
North America a self-sufficient economic community. In the workshop, the overarching dynamic
driving the discussion of this scenario is the prospect that the traditional east/west or west/east
axis of trade could be turned 90 degrees, resulting in primarily north/south trade. This contrasts with today, where
relatively few major north/south trade Corridors run continuously from Canada through the United States to
Mexico.

Millions of Markets
Through advanced technological breakthroughs, the United States becomes highly self-
reliant in terms of energy, agriculture, manufacturing, and other needs. In this scenario,
people increasingly migrate toward smaller urban areas that are supported by nearby
regional innovation hubs that can manufacture highly customized goods. Workshop participants saw this scenario
as a rural or small town renaissance. The resulting discussion focused on changes in land use, continuing needs
for natural resources to support the localization of manufacturing capabilities, and rethinking the business models
of non-highway transport modes.

                                                                                                    PAGE 2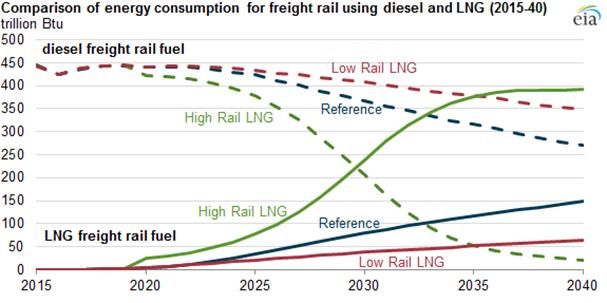
Technical Memo #3: SWOT Analysis

Global Marketplace
This is a highly competitive and volatile world scenario. Open, vigorous trade between
virtually all nations has led to market-based approaches to most contemporary challenges. This
scenario is essentially a continuation of the trend in trade that we have witnessed over the past
several decades – it is today’s global trade environment – but on steroids. Of the four scenarios
discussed during the workshop, Global Marketplace is the most familiar in terms of what we know today. It is the
prediction that freight movements will grow to such vast volumes in the future that freight will command the
attention of policy and infrastructure investment.

The facilitated discussions of the four scenarios during the workshop were intended to help identify common
themes, trends, policies, and general projects that can help prepare for each divergent future. In part, the goal of
the scenario planning workshop was to identify those themes, policies, and projects that are common across a
variety of futures and identify the strengths, weaknesses, opportunities, and threats (SWOT) of the GNC under
each of these alternative futures.

Trends and Issue Impacts on Freight Transport: Effects on
Flows
As part of the original TRB research to create the four future freight flow scenarios, Dr. Caplice and his team at
MIT used a series of workshops with thought leaders and industry experts from around the United States to
examine how the key forces might affect freight transportation in the United States 30-40 years into the future.
One key conclusion of the research team was the following: “There are an unlimited number of potential events,
trends, or occurrences that can happen in the future. It is almost impossible to identify, much less plan for, all of
these potential events. Instead, it is useful to translate these into a finite set of outcome types. (Caplice and
Phadnis 2010)” Given the focus on freight transportation, the research team chose to define a set of outcome
types they reference as flow impacts. A discussion of these flow impacts is presented in Exhibit 2 below.

Exhibit 2: Trends and Potential Flow Impacts

                                                                                                   PAGE 3
Technical Memo #3: SWOT Analysis

The impact of the trends and issues evaluated under the five driving force topic areas can be evaluated using the
five flow impacts across the four alternative futures. For example, using a significant freight trend, such as
containerization, it is possible to examine how using containers to move goods would be affected across each of
the four futures using a SWOT approach based on the drivers identified in Exhibit 2. In this example, the trend
toward containerized freight could be viewed as a weakness or a threat under Naftastique due to GNC’s current
east-west axis compared to the scenario’s north-south trade nexus. However, the population, resources, and
manufacturing strengths of the GNC could retool the Corridor in such a way that it feeds both imports and exports
through additional north-south connections. Thus, current routing is a weakness under this scenario, but it
presents opportunities for new routes and services that could respond to the north-south orientation of the
scenario. Under the Naftastique scenario, containerization is unlikely to have a significant impact on value density
of the cargo.

Under the regulation of the One World Order scenario, the GNC’s efficiency and connections could be viewed as
a strength. This scenario demonstrates the most environmentally friendly and efficient decision making process,
as evaluated by the future powerful international world trade body. Under this scenario, it is anticipated that the
Corridor would continue to grow as currently operated. In this scenario, flow destinations and origins would
change, but volume and value density might not.

Under the Millions of Markets scenario future technology advancement, such as the widespread
commercialization of 3-D printing, a rural or small town renaissance is enabled. The resulting focus becomes
changes in land use, with a continuing need for natural resources to be transported to support localized
manufacturing capabilities. As a result, the trend in non-highway transportation methods is likely to move away
from containerization and back to the bulk transport business models of the early Twentieth Century. The GNC is
well positioned for this scenario because of a diversity of rural and urban locations and the ability to haul bulk
natural resources.

Under the wide-open trade environment of the Global Marketplace, containerized freight movements from GNC
states to international destinations presents new opportunities for GNC shippers. However, depending on the
future development of the international economy, the GNC could experience less robust growth than other
Corridors. Since the GNC has excellent connections across the Pacific Ocean, but less efficient connections to
Europe, the Mediterranean, and Africa, the effect on routing could be significant. Today, though, it is likely that a
Global Marketplace future would help the GNC continue to thrive.

                                                                                                  PAGE 4
Technical Memo #3: SWOT Analysis
Chapter 1: Trends and Issues Facing the Great
Northern Corridor
As part of the Strengths, Weaknesses, Opportunities, and Threats Analysis of the GNC, a white paper was
developed covering trends and issues affecting freight transportation on the Corridor. The foundation for this
effort uses a general framework of five driving forces identified by a national research initiative under a 2008
National Cooperative Highway Research Program (NCHRP) report: Long-Range Strategic Issues Facing the
Transportation Industry.
Demographic and Societal Trends (US Census Bureau)
Aging Population/Aging Work Force
According to US Census Bureau projections, the United States will face dramatic demographic changes over the
next century.
Exhibit 3: US Civilian Work Force by Age
New projections released by the Census Bureau in Group
2012 significantly lowered previous growth
estimates, which had suggested the United States 120,000
would reach 439 million people by 2050. The new
100,000
2012 estimates suggest the United States will fall
80,000
just short of 400 million people by 2050.
60,000
By 2056, people age 65 and over are expected to 40,000
outnumber citizens under the age of 18. 20,000
0
The working age population (18-64) is expected to
1992 2002 2012 2022
increase by 42 million between 2012 and 2060.
However, as a share of total population, the 16 to 24
working age population will decline from 62.7 25 to 54
percent to 56.9 percent. 55 and older
Between 1992 and 2012, the US labor force age 55 and older nearly doubled from 12 percent to 21
percent. By 2022, workers 55 and older will expand to 26 percent of the US labor force.
Amplifying the trend of an aging work force is a concurrent trend in work force participation. During the decades
of the 1970s and 1980s, the work force participation rate surged due to women and baby-boomers entering the
labor market. (The work force participation rate is the proportion of the civilian, non-institutional population that
is in the labor force.) The work force participation rate in the United States peaked in the late 1990s at 67.1
percent. Since that time, the work force participation rate has been declining: During the 2007–2009 recession,
the overall labor force participation rate fell by 0.6 percentage point, from 66.0 percent during 2007–2008 to
65.4 percent in 2009. Then, in 2010, the rate came in at 64.7 percent, a further decrease of 0.7 percentage point.
By 2012, the participation rate had fallen another 1.0 percentage point, to 63.7 percent (Toossi 2013).
PAGE 5
Technical Memo #3: SWOT Analysis
The implication of these trends for states in the Great Northern Corridor could be labor shortages for skilled jobs
and service occupations. An annual survey of professional service businesses in the Ninth District of the Federal
Reserve Bank, which includes Minnesota, Montana, North Dakota, and western Wisconsin, recently found that
skilled labor is becoming harder to find (Madden 2014). Productivity and immigration have historically helped
offset tight labor markets, but new immigrants from Latin America and Asia often have lower educational
attainment, which could slow productivity advances.
Mega-regions and Declining Rural Populations
Mega-region is the term applied to urban area clusters linked by social, economic, demographic, environmental,
and cultural ties. Geographers, planners, and economists argue that mega-regions are becoming the driving force
in the world economy. Ten mega-regions have been identified in the United States with two of these mega-
regions book-ending the GNC (see Exhibit 4) (Regional Plan Assoc. 2006).
The western Cascadia mega-region is anchored by Seattle and Portland.
On the east end of the Corridor, the Great Lakes mega region anchored by Chicago stretches from
Minneapolis/St. Paul across the
Ohio Valley to Rochester, New
Exhibit 4: Emerging Mega-Regions
York.
While big cities are getting bigger, most
rural areas are losing population, including
rural areas of the GNC. However, some
counties along the GNC are not following
this trend. The oil and gas developments in
the Bakken Shale fields of North Dakota
and Montana have caused these rural areas
to grow exponentially-- not lose population-
- as is the experience in other rural areas.
Between 2012 and 2013:
Seven counties in North Dakota
and Montana were among the
fastest growing in the United States
Williams County, North Dakota, was the fastest growing county with a population of 10,000 or more in
the United States
Treasure County, Montana, and Butte and Camas counties in Idaho were among the top counties in
population loss on a percentage basis.
See Exhibit 5 on the following page for a depiction of population change in the GNC.
PAGE 6Technical Memo #3: SWOT Analysis
Exhibit 5: Population Change in the GNC States by County 2010 – 2013 (US Census Bureau)
.
Truck Driver Shortage
While the modal mix in the GNC may be changing somewhat due to high demand for rail movements, trucking
remains the primary goods movement mode across the states making up the Corridor. Commodity data from IHS-
Global Insight in 2012 suggests that one-half of all goods movement in the eight states encompassing the GNC is
moving by trucks when measured by tonnage (TRANSEARCH 2012). Trucking also enables other modes like rail
and water, as many shipments move on trucks to
access rail terminals and water ports. Exhibit 6: Mode Share for GNC States by Tonnage
The American Transportation Research Institute
(ATRI), the not-for-profit research arm of the trucking
industry, conducts an annual survey of critical issues
facing the industry. In 2006, the driver shortage
ranked as the top industry issue; however, following
the onset of the economic recession, it dropped to
sixth on the “top ten” list. By 2013, it had rebounded
to third place. Recent surveys found the driver
shortage to be a polarizing issue in the industry; many
respondents saw it as a major issue, while many others
did not. ATRI notes that hiring challenges may stem
from baby boomer retirements and new federal driver
safety rules (CSA: Compliance, Safety, and
Accountability). However, ATRI recognizes quality of
life issues such as work/family balance and healthy
lifestyles as issues in recruitment. The trucking industry also cites federal regulations that require all interstate
truck drivers to be 21 years of age or older. This restriction, along with carrier insurance policies that may restrict
PAGE 7Technical Memo #3: SWOT Analysis
or place a high cost on young drivers, makes it difficult for the industry to recruit truck drivers out of high school
(Critical Issues 2012).
Finally, trucking is not the only freight transportation service sector that at times struggles to find competent
workers. Due to the work force demands and prevailing wages in the Bakken Region of North Dakota and
Montana, BNSF railway has created a signing bonus program for some hard to fill positions.
E-commerce/Just-in-time (JIT) Home Delivery
E-commerce increased from 0.6 percent of total retail activity in 1999 to 5.5 percent in the first quarter of 2013.
The rapid increase of e-commerce and the related increase of direct home delivery have affected the freight
network. Similar to traditional retailers like Walmart and Target, who implemented distribution warehouses as
part of their supply chain network strategies, e-retailers like Amazon and eBay are constructing smaller more
decentralized distribution centers to increase the reliability of achieving next-day, or even same day, delivery for
their products. As these retailers change their networks to meet consumer demands, carriers serving large retailers
may also have to alter where and how often they replenish distribution warehouse facilities.
The Emerging Global Middle Class (Kharas and Gertz, Yueh
2013, US Bureau of Economic Analysis)
For several decades, US middle income consumers were significant drivers of the world economy. In 2013, global
gross domestic product (GDP) slightly topped $74 trillion (US dollars), while personal consumption expenditures
in the United States approached $11.7 trillion or the equivalent of roughly one-sixth of the world’s economy. The
definition of middle class varies, but, essentially, it means having enough disposable income to purchase
consumer goods beyond those required for mere sustenance. Currently, about one-half of the world’s middle class
resides in Europe and North America; however, the following trends may be seen:
It is estimated that by 2015 the number of Asian middle class consumers will equal those in North
America and Europe.
The Brookings Institute estimates that the current middle class is made up of 1.8 billion people, which is
forecast to grow to 3.2 billion by 2020; nearly all of that growth is expected to occur in Asia where the
middle class will triple to 1.7 billion by the end of this decade.
Latin America’s middle class is expected to grow from 181 million to 313 million by 2030, led by Brazil.
The middle class in Africa and the Middle East is also expected to double by 2030.
The implication of this new middle class is that, in the future, Asia will likely be positioned to import more US
goods via the GNC. Currently, China and Japan are the third and fourth largest importers of US merchandise
trade. Together, China and Japan constitute only 35 percent of the import value from the largest US importers,
Canada and Mexico. However, between 2005 and 2013, China’s imports of US goods grew 196 percent.
PAGE 8Technical Memo #3: SWOT Analysis
Sustainable Transportation
Exhibit 7: Dimensions of Sustainability
Sustainable transportation is the idea that needs of the current
generation should be met without compromising the ability of
future generations to meet their needs. It is a complex and
challenging proposition with many dimensions. Over the past
two decades, significant effort has gone into better defining
sustainability as it relates to transportation and land use policy.
While the basic premise of “do no harm” still holds,
sustainability is also viewed as the balance between
environmental preservation, economic development, and
livability: the “sustainability triple bottom-line.” FHWA has
launched a sustainability evaluation tool called INVEST, which includes a freight and goods movement module.
Recently, Atlantic Northeast Rails and Ports, a group “dedicated to the preservation and extension of the regional
rail network,” developed a draft Code of Best Practices for Siting and Operating Rail Freight Facilities (Atlantic
Northeast Rails & Ports).
Energy and Environmental Trends
Bakken Shale Oil/Canadian Oil Sands Extraction
North Dakota’s oil industry has experienced a boom in the last 5 years using hydraulic fracturing or ‘fracking’ to
extract its massive shale oil resources, from which oil companies are now extracting over 1 million barrels per day
(Shaffer 2013). Much of that oil (over 70 percent and growing) travels by rail to refineries throughout the country
(Hageman 2014). Oil companies shipped 400,000 carloads of oil in 2013 compared to 11,000 in 2009 (McCoy,
Seythe, and Dkeen 2014). North Dakota oil production is projected to continue to grow, further increasing
demand on rail transportation. Fracking activity has dramatically increased truck traffic on connecting highways
as well, with each well requiring approximately 1,000 truck trips to begin extraction.
Canadian oil sands are another source of energy that is growing rapidly. Oil sands can be mined and processed to
extract oil-rich bitumen, which is then refined into oil (About Tar Sands 2012). This oil is increasingly being
shipped by rail. In early 2014, Bloomberg News reported that more than 200,000 barrels a day of crude were
leaving Western Canada by rail, a figure that is projected to reach 500,000 by the end of 2014 (Plenty and Doan
2014).
The higher unit train demands placed on the GNC by the booming crude oil market have resulted in capacity
problems across the Midwest. The US Department of Agriculture reported that, during the winter of 2013-2014,
grain shipments moving between the Midwest and Pacific Northwest took 20-22 days, nearly twice as long as
usual. Extreme winter weather (including snow and cold temperatures) contributed to this delay as well.
Alternative Energy Developments
As the nation’s sources of renewable energy continue to grow and decrease in cost, the energy mix of the country
will continue to adjust. Wind turbines, solar panels, and various other forms of renewable energy will produce a
larger share of the nation’s energy needs, potentially reducing demand for other energy sources like coal and
natural gas. Components for renewable energy systems, specifically wind components, are manufactured and
PAGE 9Technical Memo #3: SWOT Analysis
shipped near and through the GNC. Illinois, Minnesota, Oregon, Washington, and North Dakota are among the
top 12 states in the nation that are responsible for 80 percent of wind generation capacity in the United States
(Current Installed Wind Power Capacity 2014)
Alternative Fuels
Alternative fuels are being pursued for many modes of Exhibit 8: Forecast for Freight Rail LNG Adoption
transportation, rail included. Liquefied Natural Gas, or
LNG, is the leading candidate to replace diesel as the
power source for locomotives. Continued growth in
domestic natural gas production and substantially lower
natural gas prices compared to crude oil prices could
result in significant cost savings for locomotives that use
LNG, as well as the environmental benefit of fewer
greenhouse gas emissions. The US Energy Information
Administration projects that up to 95 percent of freight
rail energy consumption could come from LNG by 2040
(see Exhibit 8) (Chase 2014). Adoption is limited by
large upfront costs for fueling stations and new
locomotives as well as regulatory uncertainty.
Compressed Natural Gas, or CNG, is being considered in some areas for shortline railroad locomotives. While
LNG has a higher energy density, lending itself to long-haul locomotive trips, CNG is cheaper, easier to process
and store, and fills fast, making it an excellent candidate for short-haul trips (Sylvester-Chaudhuri 2013).
Natural Disasters
Natural disasters have and will continue to have major impacts on GNC states and transportation networks.
Disasters occur throughout the GNC, including flooding in the Red River Valley of North Dakota and Minnesota,
Devil’s Lake, North Dakota, the Milk River of Montana, and the Washington coast; avalanches near Glacier
National Park in Montana; and mudslides in Washington. All of these disasters test the resiliency of the region’s
transportation networks—how efficiently and effectively they can respond—which has major impacts on trade,
operational capacity, and disaster response.
PAGE 10Technical Memo #3: SWOT Analysis
Climate Change Impacts on
Exhibit 9: US Winter Wheat Growth Areas
Crop Growing Regions
According to the USDA, the cumulative effect of
climate change on agriculture is not yet known.
However, climate change will affect and is already
affecting agriculture in several ways, including in
GNC states (Walthall et al. 2012). With warmer
temperatures and more rainfall in the north, some
crops could experience nearly two full growing
seasons and larger growing areas, including winter
wheat and other grains able to be grown farther
north (expansion of green area in Exhibit 9).
However, wetter conditions in the spring may make
it difficult for farmers to plant their crops, and more
frequent heat waves, floods, and droughts, as well as larger populations of harmful insects, will likely place
additional stress on the region's agriculture and forestry. Additionally, higher temperatures may stress livestock
(Climate Impacts 2013).
North Dakota Potash
Potash, which are mined salts containing potassium in water-soluble form—and a major input in fertilizer
production—has been studied for years as a major resource in North Dakota (Potash 2014). The state geological
survey estimates that the state has reserves of 50 billon tons, which would be 33 percent of the world’s supply
(Dakota Salts). However, in North Dakota, the mineral is located anywhere from 5,000 to 9,000 feet deep,
requiring solution mining, a process similar to drilling for oil (Froseth 2010). It is expected that a majority of the
North Dakota potash would likely go to China. However, some questions have been raised over the reliability of
the estimates; companies are actively pursuing permits for Potash mining in North Dakota. Potash lends itself well
to long-distance rail transportation and could be another major driver of future demand on the GNC.
Technology Trends
Advanced Manufacturing (About 2012)
Advanced manufacturing, defined as the rapid transfer of science and innovative technology to improve
manufacturing products and processes, is a key driver of economic growth for the country as a whole, including
the GNC. The Corridor combines accessibility to major global markets with a Midwestern industrial base that is
experiencing resurgence with advanced manufacturing techniques and products. Recent trends also indicate that
many companies are choosing to relocate production facilities from Asia back to the United States to improve
their access to consumers, materials, and work force. All of this presents several questions for the GNC:
How can the transportation system be optimized to appeal to advanced manufacturing?
What attributes do companies look for when relocating this type of category?
PAGE 11Technical Memo #3: SWOT Analysis
Who are some of the current advanced/innovative manufacturers on the Corridor, and how do they use the
system?
By answering these and other questions, the GNC and its member states can maximize the benefits of advanced
manufacturing and position the Corridor itself to better serve the transportation needs of these types of
manufacturers.
Dedicated Short-Range Communications (DSRC) (Briggs and
Arnold)
DSRC is two-way short-range wireless communication capability that supports very high data transmission rates
necessary for advanced transportation and safety applications. Transponders used for electronic tolling, or by
commercial vehicle operators belonging to pre-clearance systems like PrePass®, are examples of existing DSRC
technology. DSRC technologies are currently being tested to support advanced safety systems, as well as provide
better traffic and travel information to drivers. USDOT is currently supporting research to advance the use of
DSRC under two umbrella programs:
Vehicle-to-Vehicle (V2V) applications – wireless exchange of data between nearby vehicles that provides
opportunities for significant safety advancements. The vision for this technology is that someday all
vehicles on the roadway will be able to communicate with one another to support active safety systems.
Vehicle-to-Infrastructure (V2I) applications – the wireless exchange of data between vehicles and the
infrastructure. One example of an advance V2I application would be the ability for a vehicle to interact
with traffic signal phase and timing (SPAT) information to support delivering active safety advisories and
warnings to drivers.
Agricultural Research/Crop Genetics
Advances in food and crop research, including genetic modification, are leading to higher yields and productivity
for producers in states throughout the Corridor. While the yield per acre is increasing, crops are also more
resistant to disease and pests and more tolerant of herbicides and extreme weather fluctuations. Several criticisms
have been offered against genetically-modified organisms (GMOs), but, from a transportation perspective, this
translates to increasingly large volumes of crops, specifically grains, being placed on the rail and highway system
every year. Other common related questions involve the transportation and consolidation of agricultural facilities,
the emergence of new markets for US agricultural products, expanding multimodal networks for fresh/refrigerated
foods, and rail equipment availability for agricultural moves.
Longer Trains
Strictly speaking, a train becomes more efficient with each car that is added, achieving economies of scale. In
recent years, railroads have experimented with longer train configurations with some success. On the GNC, the
longest trains are typically unit trains (coal and grain) that fall in the 110-150 car range, which translates to
roughly 1 to 1.5 miles long or longer. Several factors determine train make-up, car placement, and overall length
decisions, but the issue of longer trains presents a unique array of operational considerations:
Are yards, industries, and facilities able to accommodate a higher influx of cars at each end of the trip?
PAGE 12Technical Memo #3: SWOT Analysis
Are there adequate sidings for longer trains on the GNC?
If a longer train needs to stop mid-route, what type of spacing is there between crossings along the route?
The GNC has substantial grade fluctuations, so how might grade affect train handling and performance as
the weight and length increase?
Larger Ships and Ocean Freight Costs
Recent figures indicate that container ship utilization is at approximately 85-90 percent worldwide. One major
factor in this trend is the quick adoption of “very large containerships,” or VLCS, which have forced operating
costs down industrywide, as smaller ships are forced to implement slow steaming to remain cost-competitive.
While only a handful of the major ports are capable of handling VLCS, their presence has had a ripple effect on
the industry: Many trips take longer (because of slow steaming), ships call on fewer ports per trip, and additional
ships have been pulled into action to maintain service levels.
Economic Trends
Free Trade Agreements/NAFTA
NAFTA, the North American Free Trade
Exhibit 10: Top 5 Destinations for GNC Exports
Agreement, is a treaty signed in 1995 that
removed trade barriers between the United
States, Canada, and Mexico and has played a
role in the growing trade relationship among
the countries. For the GNC, many of whose
states share a border with Canada, these
markets are critical for trade. In 2013, Canada
was the GNC states’ largest export destination
by far, receiving over $50 billion worth of
goods. Mexico was third with over $15 billion.
Maintaining strong trade relationships with
Canada and Mexico will be important to the
continued success of the GNC and economies of their member states.
Another free trade agreement, CAFTA-DR (Dominican Republic – Central America Free Trade Agreement), was
signed in 2004 by the United States, Costa Rica, El Salvador, Guatemala, and Honduras. Exports from GNC
states to CAFTA-DR states composed a much smaller share than NAFTA, at only $2.3 billion in 2013, but have
been growing steadily (TradeStats Express).
Emerging Nations
As global trade evolves, US companies are entering into emerging markets across the world where their goods
and services can be sold, accelerating the growth of their company or industry and expanding the reach of US
exports. The ‘BRIC’ countries (Brazil, Russia, India, and China) have been the cornerstone markets of increased
global trade. Africa is also identified as an emerging market, but its impact is often measured on a continent scale
instead of as individual countries. No universal definition exists of an emerging market, but, generally, the most
PAGE 13Technical Memo #3: SWOT Analysis
widely used factors include GDP growth rate and per capita GDP growth rate. By this metric, China’s GDP
growth rate of nearly 8 percent in 2013 (compared to about 3 percent for the United States) characterizes it as a
trade market that continues to emerge, despite the projections of when it will overtake the United States as the
world’s largest economy.
For the GNC, these countries represent significant trade markets. China, specifically, is a destination for many
products from the west and Midwest that travel by rail to Pacific Northwest ports and are shipped across the
Pacific. China is the second largest destination for exports from GNC states, receiving nearly $30 billion of goods
in 2013. The same year, Brazil received over $5 billion in exports from GNC states, India $3.6 billion, and Russia
$2.5 billion (TradeStats Express). Continuing to be able to deliver trade to growing economies, specifically China
and India, will be important to the GNC and its member states.
New Trade Routes
Northwest Passage
A new route for world trade may soon be passable for commercial vessels. The Northwest Passage is a series of
waterways that wind through the Arctic Ocean connecting the Atlantic and Pacific Oceans (see Exhibit 11)
(Northwest Passage). Due to temperatures rising faster in the Arctic than anywhere else in the world, ice is
melting faster, keeping the passage open for
longer periods of time (China 2013). This Exhibit 11: Northwest Passage Route
could provide a shorter, less expensive route
for shipping for many locations, specifically
China, whose travel to Northern Europe
would be significantly expedited. However,
the route may create some international
political challenges, as Canada claims
ownership of the route, while the United
States and European countries maintain it is
an open, international route that should allow
free passage (Northam 2011). As the ice
continues to melt and the area continues to
warm, the Northwest Passage and its international economic and political impact will grow.
Panama Canal
The competition for transporting imports and exports is intense in the Midwestern US In general, intermodal
transportation offers the fastest connection to Asia from the Midwest – that is, shipping to Western US ports like
Los Angeles, Oakland, or the Pacific Northwest and transferring the cargo onto rail. However, the Panama Canal
is currently undergoing a $5.25 billion dollar expansion to increase the size and quantity of ships that it can
accommodate. Myriad factors determine what route cargoes take, including cost, transit time, and reliability, to
name a few. That, combined with disagreement among industry professionals about how the expanded canal will
affect global shipping trends, creates difficulty when projecting route competition into the future (The Far
Reaching Effects 2011). It will be important to monitor what, if any, major changes arise from the expanded
canal.
PAGE 14Technical Memo #3: SWOT Analysis
Re-shoring/Near-shoring
A central theme of the effects of globalization on the American economy over the past decade has been the
migration of domestic manufacturing to overseas markets, most notably China. As the Boston Consulting Group
summarizes, “…China has offered a virtually unbeatable combination of seemingly limitless cheap labor, a
growing pool of engineers, a fixed currency, and local governments willing to offer inexpensive land, free
infrastructure, and generous financial incentives. (Made in American, Again)” Many predict that rising wage
rates, shipping costs, and land costs in China, along with a gaining Yuan, a greater American worker flexibility,
compromised unions, and increased automation, will erode China’s economic advantage for manufacturing within
5 years. This is especially true when comparing manufacturing in coastal Chinese towns and cities against some
areas in the United States such as South Carolina, Tennessee, and Alabama. Interior and secondary Chinese cities
that may still have a wage rate advantage over their coastal countrymen likely suffer from poor infrastructure or
poor supply chains, or they lack sufficient skilled labor.
Industries that are most likely to benefit from reshoring production are those where labor accounts for a small
portion of final cost and where production volumes are relatively small, such as auto parts, white goods
(appliances, etc.), or construction equipment. Industries making labor intensive and mass produced products such
as apparel will likely first be attracted to other low-cost countries in south Asia. Products that are reshored to the
United States will likely be those products sold to the US market. As this trend continues, and manufacturing
grows throughout the country, the usage of rail—especially for items that often travel by rail like auto
parts/automobiles, appliances, and construction equipment—will increase as long as capacity remains sufficient
and rates remain competitive. This industrial manufacturing shift could also mean that manufactured product
imports from Asia through west coast ports may decrease.
Landside Capacity for Larger Ships
As mentioned, most ports have not improved dock and berth depth capacity to accommodate fully laden container
ships. GNC ports account for nearly half of US Pacific Coast ports with Panamax capability. This means that, as
ships continue to grow in size, the ports with improved dock and berth depth capacity are in a strong competitive
position to maintain and grow traffic levels. The GNC ports are well positioned in this regard, given that three of
the five deepwater gateways on the western seaboard are part of/accessible to the Corridor (Vancouver-Canada,
Portland, Seattle-Tacoma). One side effect is that many of the goods are shifted from waterborne freight to a land-
based hub-and-spoke network. The map in Exhibit 12 shows maximum berth depth at US deepwater ports
(Rodrigue).
PAGE 15Technical Memo #3: SWOT Analysis
Exhibit 12: North American Ports by Depth
GNC Port Productivity/ Labor Issues
Productivity at the berth is the metric most closely tied to ship turnaround times. Improving productivity is a
shared goal between the carriers, the terminals, and the customers. Carriers that experience poor productivity look
inward to improve their own operations in addition to seeking improvements from the terminal. However, there
are other issues preventing greater productivity at ports, which in turn limits the efficiency of the entire freight
system. One such issue is labor disruptions occurring at ports in the Pacific Northwest, affecting public perception
in addition to port productivity, and customer confidence.
Even with the additional resources terminals are deploying in the US, vessel productivity at ports continues to lag
productivity at ports in Asia. The customers have choices of ports, terminals, railroads, etc. to get their products to
market. Corridors like the GNC must strategize to provide a great product at a reasonable throughput cost and to
be able to deliver the goods on schedule to retain its market, all while satisfying the needs of its workers and
longshoremen.
Larger ships and bigger alliances will press the capacity of the Corridor’s infrastructure system, another issue
potentially affecting GNC port productivity. It is possible that increasing carrier alliances and larger ships will
cause the largest vessels to only call at certain ports. Those ports may require large investments in equipment,
dockside capacity, dredging and more to stay as productive as ports in other parts of the world preparing for the
same thing. Overall, the following three issues are currently, and will continue to affect, port productivity:
PAGE 16Technical Memo #3: SWOT Analysis
Competitive Pricing
o Investments to accommodate larger ships require higher productivity at the terminals to enable
the reduction of terminal costs, which in turn will produce competitive price for the services
rendered.
Technology Advances
o Under the 2008 ILWU contract, ports/terminals gain the ability to implement improved
technologic solutions, and as such, have been installing more modern systems on the terminals in
the areas of equipment handling, transparency of cargo location, and terminal operating systems
that leverage current electronic solutions.
Work Rules
o Work rules such as manning levels, wages and benefit packages, and bonus packages continue to
be areas of contention both on and off the port terminals.
To remain globally competitive, ports around the nation and globe, including GNC ports, will continue to
compete to improve productivity at their terminals as well as along the whole supply chain, and addressing
these three areas will be critical to succeeding in that arena, and for GNC ports, maintaining the Corridor’s
overall efficiency. GNC ports will also need to continue providing leadership in preparing the workforce for
the future and creating a shared vision for the role of ports in the success of the entire GNC. As a linked
system, GNC ports are critical to the first and last mile of the GNC.
Government and Political Trends
Economic Deregulation: Productivity Gains and New Markets
The containerization of freight, first attempted in the 1950s, revolutionized freight transportation and paved the
way for a trade based global economy. However, during the 1960s and most of the 1970s, freight was a highly
regulated industry. Economic regulations that governed railroads, motor carriers, ocean carriers, and airlines
largely stifled competition and productivity innovations. Beginning with the Railroad Revitalization and
Regulatory Reform Act in 1976, the US Congress passed a series of modal deregulation bills. According to a
2013 white paper from the Association of American Railroads, since passing the Staggers Rail Act (The Impact
2013), the following is true:
Average rail rates have fallen 44 percent.
Train accident rates are down 80 percent.
Rail traffic volume has nearly doubled, and railroads have reinvested $525 billion back into their systems;
the cost of capital has declined, and return on investment has increased.
While private railroads, airlines, and marine modes have all experienced significant productivity gains, freight
productivity on the highway system has remained relatively flat. Data from the US Bureau of Labor Statistics
suggests that, between 1997 and 2011, labor productivity in the long-haul trucking sector increased 38 percent,
versus 149 percent in the railroad industry. Railroad analysts note that many major trucking companies now
PAGE 17Technical Memo #3: SWOT Analysis
partner with railroads to offer bi-modal services. Productivity gains in the rail sector have also driven down the
length of haul wherein intermodal rail service becomes financially viable, especially as fuel costs remain high.
The ability for the Corridor and its businesses and freight stakeholders to be amenable to changing business
patterns is also key to economic competitiveness across the GNC. Many of the sectors that were key to the GNC
in the past will evolve or change into different types of products and services, and amenability and responsiveness
to changing industry trends will be key to economic success of the Corridor. In part, supporting streamlined
project permitting requirements that are harmonious across Corridor states will encourage infrastructure and
business investment.
Emerging Surface Transportation Regulation
Transportation modes in the United States must deal with a host of regulatory agencies such as the Federal Motor
Carrier Safety Administration, the Surface Transportation Board, the Environmental Protection Agency, and the
Federal Railroad Administration to name just a few. Many of the current regulatory issues focus on improving
safety and lessening the impact of transportation on the environment. Due to the structure of the railroad industry,
some shipper groups are also calling for measures to increase competition. Following are some current regulatory
issues facing the railroad industry:
Positive Train Control: In 2008, Congress passed a bill mandating that positive train control be put into
service by the end of 2015 on rail lines used to transport passengers or toxic-by-inhalation materials. It is
estimated that meeting the mandate will cost at least $8 billion.
Safety: Several high-profile derailments in 2013 and 2014 of crude oil rail cars has resulted in calls for
better safety standards for railroad tank cars and more training for disaster responders.
Re-regulation of rail pricing: During the last transportation reauthorization debate, some rail dependent
shippers called for new price controls on the industry.
Mandatory reciprocal switching: Reciprocal switching refers to one railroad switching carload freight to
another railroad, giving captive shippers access to other railroads. The service is performed for a fee, with
charges paid by the receiving railroad. A proposal from the National Industrial Transportation League
(NITL) would require a railroad to offer reciprocal switching services when a customer’s facility is
located within a 30-mile radius of an interchange where regular switching occurs.
Following are some regulatory issues currently facing the trucking industry:
In 2013, the FMCSA implemented revisions to driver Hours-of-Service (HOS) rules. Federal HOS rules
for the trucking industry determine the drive time, on-duty time, break periods, and rest periods for truck
drivers operating in interstate commerce. Many states have adopted the federal regulations for intrastate
commerce. The federal HOS rules underwent a major revision in 2003, with the goal of creating a rule
that aligned on-duty and rest periods with the natural circadian (24 hour) rhythm of the human body.
Several changes to the rules have followed, with a final rule issued by FMCA taking effect July 1, 2013.
The trucking industry believes the new rules will further hurt productivity and believes a more flexible
approach is needed.
PAGE 18Technical Memo #3: SWOT Analysis
In 2010, FMCSA rolled out a new regulatory framework for tracking unsafe carriers and drivers.
Compliance, Safety, Accountability (CSA) uses a new enforcement and compliance model. The trucking
industry has argued that CSA is onerous and does not accurately predict carrier safety. The industry is
litigating some elements of CSA, and recently the General Accounting Office (GAO) issued a report
critical of the Safety Management System (SMS) scoring in CSA.
In 2012, Congress adopted a bill requiring trucking companies to use an electronic logging device to track
hours of service. The Federal Motor Carrier Safety Administration is currently working to implement the
law.
EPA is currently developing rules for new fuel efficiency standards for post model-year 2018 equipment.
Public-Private Partnerships/Additional Funding Strategies
Reserves in the Highway Trust Fund are dwindling — without action by Congress, it was projected that this fund
would have a negative balance by September of 2014. Despite Congress’ recent passing of a 10-month continuing
resolution, delaying a funding crisis, no long term transportation funding solution has been found or agreed upon.
Because of this disagreement and inaction, it is clear that new mechanisms to finance highway and infrastructure
projects are needed (US Department of Transportation). The first strategy being proposed by many is a “fix it
first” policy, directing maintenance and preservation of existing infrastructure over all other projects. Many states
and local governments have already implemented this policy. Nonetheless, current spending levels are not
keeping pace with infrastructure needs. In fact, the American Society of Civil Engineers estimates that the United
States needs to spend $110 billion more each year to maintain the highway system at current performance levels
(Kahn and Levinson 2011).
One strategy that has been under consideration in recent years to augment traditional funding methods is the
concept of a National Infrastructure Bank (NIB). Generally, an NIB would be funded initially by an appropriation
from Congress. The bank would identify projects that lack funding but offer a clear benefit to taxpayers, likely
ranked by benefit-cost analysis. The bank would make loans for projects that leverage contributions from local
governments or the private sector, and the loans would have to be paid back through project revenues with a
specified rate of interest (Compton 2011). Starting an NIB is just one idea of how to achieve additional funding of
the more critical projects that currently fall outside the “fix it first” policy. This vehicle could also fund
multimodal projects, including rail and water projects that currently cannot be funded by Highway Trust Fund
dollars nor can be funded under monies available through the Transportation Investment Generating Economic
Recovery (TIGER) program.
Some regions are developing other public-private partnerships to fund transportation projects outside the current
scope of public funding sources. The Chicago Region Environmental and Transportation Efficiency (CREATE)
Program is a popular example of an innovative partnership. The program is a collaboration of private freight
railroads, the Illinois Department of Transportation, the City of Chicago Department of Transportation, Metra,
and Amtrak. Total project costs exceed $3 billion, including private funding of over $200 million from the
railroads. As of September 2012, 15 projects had been completed, 11 were under construction, and 22 projects
remained unfunded (Innovative Program Delivery ). CREATE is recognized as the first time state and local
governments have partnered with the railroad industry to solve congestion and safety problems on such a large
scale. Public-Private Partnerships and a National Infrastructure Bank are only two strategies being considered to
PAGE 19You can also read