TECO: A deep dive into optimization data yields unexpected savings
←
→
Page content transcription
If your browser does not render page correctly, please read the page content below

TECO: A deep dive into optimization data
yields unexpected savings
Layered efficiencies drive down costs while maintaining reliability
By Michael P. Manoucheri and Ben Erpelding

TECO

Thermal Energy Corporation’s district energy system serves 51 buildings on the campus of Texas Medical Center.

        three-phrase initiative to explore         customer demand for chilled water con-          ing the chiller plant’s electrical demand.

A       and implement cost savings across
        the largest district cooling sys-
        tem in North America has paid off
handsomely – and quickly – bringing sig-
nificant system improvements even in
                                                   tinues to rise.
                                                         TECO, named IDEA's System of the
                                                   Year in 2019, provides chilled water
                                                   and steam to Texas Medical Center in
                                                   Houston, which – as the world's largest
                                                                                                   In the first seven months of optimization
                                                                                                   – from June to December 2020 – TECO
                                                                                                   lowered peak demand by 2 MW, saving
                                                                                                   nearly 10.5 million kWh, and reduced the
                                                                                                   plant’s energy consumption by 6%. Now,
the midst of the COVID-19 pandemic.                medical campus – requires reliable,             TECO can avoid spot-purchasing power
Efficiency gains have been seen in con-            economical heating and cooling and              from the sometimes unreliable public grid
denser management, chiller operations              has growing needs.                              and more easily keep up with customer
and thermal energy storage.                              Peak chilled water demand has             demand. By reducing peak demand, TECO
      The project’s genesis can be traced          increased by 9,000 tons over the past four      also bought time to develop a new mas-
to IDEA’s annual conference in June 2019,          years and is expected to grow by an addi-       ter plan, including how and when to add
when representatives from                                       tional 9,000 tons over the next    power production capacity.
Thermal Energy Corporation                                      three years. TECO has found
(TECO) and Optimum Energy             MAINTAINING               that the most cost-effective       PHASE 1: CONDENSER-SIDE
struck up a conversation about        RELIABILITY,              way to manage district growth      OPTIMIZATION
the pitfalls of drawing electric-     EVEN AS DEMAND            while maintaining its histori-          TECO has two interconnected plants
ity from the grid in the swelter-     RISES, THROUGH            cal reliability of 100%, with no   housing 27 chillers, nine boilers and one
ing heat of a Texas summer.           INNOVATIVE                unplanned outages since 1992,      TES tank, managed by a Toshiba distrib-
      The TECO team wondered          EFFICIENCY                is to layer on new efficiency      uted control system. System capacity is
if the company could decrease         MEASURES.                 measures.                          120,000 tons, with a peak load of 78,600
electrical consumption from                                              Partnering with Opti-     tons and 345 million ton-hours per year
its main site before June 2020,                                 mum Energy, TECO’s engineer-       of annual load. The system’s latest chilled
the start of the next peak demand sea-             ing team developed a three-phase plan.          water expansion, called the East Chiller
son. Customer chilled water demand was             First, for the condenser water system to        Building, consists of four 8,000-ton vari-
growing rapidly enough to soon exceed              conserve more energy and reduce costs;          able-speed York Titan chillers; four
on-site generation resources.                      second, to have the chiller staging pro-        variable-speed, primary-only chilled
      TECO needed a solution that would            cedures better handle changing loads;           water pumps (24,000 gallons per min-
maintain reliability, keep costs down and          and third, to take advantage of real-time       ute, or gpm, 1,000 horsepower (hp), 138
conserve resources. That initial conversa-         electricity pricing for the thermal energy      feet head; four fixed speed condenser
tion, in 2019, turned into a multiphase,           storage (TES) tank dispatch.                    water pumps (16,300 gpm, 600 hp, 112
plant-wide optimization journey that                     Two years down the road, TECO has         feet head) and six variable-speed cooling
now saves TECO $550,000 and 16.1 mil-              improved control over the energy balance        tower fans (16,300 gpm, 101-86 degrees
lion kWh of energy annually – even as              of its CHP system and its TES tank, reduc-      F, 80 F WB, 250 hp).

© 2022 International District Energy Association. ALL RIGHTS RESERVED.                              District Energy | Spring/Summer 2022    25
The East Chiller Building condenser
FIGURE 1. 2019 trends for variable speed chiller #4 efficiency (kW/ton) vs. lift (deg F). water system was considered a low-risk,
ECH B CH4- kW/Ton versus Lift
high-reward starting point. Improvements
1.00
1.00
focused on reducing chiller lift, which is
0.90
0.90 defined as the leaving condenser water
0.80
0.80 temperature minus the leaving chilled
0.70
0.70
• water supply temperature. (High chiller
0.60
0.60
lift reflects hot, humid ambient condi-
y = 0.0106x + 0.0242
0.50
::. 0.50 tions that are typical in the summer, when
kW/ton
>
>
� R2 = 0.9769
0.40
0.40 demand for low-temperature chilled
0.30
0.30 water is high. Conversely, in winter, lift is
0.20
0.20 lower.) For example, a chiller with a sup-
0.10
0.10 ply temperature of 40 F and a leaving
0.00
0.00
condenser water temperature of 95 F
10.0 20.0 30.0 40.0 50.0 60.0 7C would have a design lift of 55 F.
10.0 20.0 30.0 40.0 50.0 60.0 70.0
Chiller Lift (deg F)
Chiller lift Figure 1 shows one of the 8,000-ton
chiller’s trended data for efficiency
Source: TECO
(kW/ton) versus chiller lift. If TECO’s
chiller were operating at 6,500 tons, a
2 degree F reduction in lift would save
FIGURE 2. ECHB Cooling Tower Performance; leaving condenser water temperature vs. outdoor wet 137.8 kW of energy.
bulb temperature at different delta Ts. Conditions were ripe for optimiza-
SPX Cooling Technologies
TRACS Version 6-MAY-09
tion: The four 8,000-ton chillers in the
90 Model F4109-4.0-10B
Number of Cells
Motor Output
10
250 Hp
East Chiller Building were designed for a
Motor RPM 1800
85 Fan
Fan RPM
32 ft HP7 9
112
2 gpm/ton condenser water system. The
(Full Speed)
Design Conditions:
remaining 23 chillers in the two plants
Cold water (F)
Flow Rate 163000 gpm
80 Mass Flow
Hot Water
22509.5 lb/s
101 °F
were designed for a 3 gpm/ton system.
Cold Water 86 °F
Inlet Wet-Bulb
L/G
4 18 F range
80 °F
1.263
Automated balancing valves maintained
75
Curve Conditions:
Fan
3 Pitch
15 F range Constant
design flow through the condenser bun-
Flow Rate 163000 gpm
70
( 100% Design Flow )
2 12 F range
dle on each East Chiller Building running
10 cell, Fans Full
4 205.000017
1 9 F range
chiller. In general, the cooling tower fans
65 3
were often operating at 100%.
Design point
2
q 18 °F Range The Optimum Energy and TECO team
60 1 p 15 °F Range
o
n
12 °F Range
9 °F Range developed a consistent, real-time, digi-
45 50 55 60 65 70 75 80 85 X Design Point
45 50 55 60 65 (°F)
Wet Bulb 70 75 80 85 tal standard operating procedure that
Wet bulb (F) Time: 08:37:03 Date: 12-03-2009 Drawn By: BCS included automation, operator prompts
Source: TECO
and screens, and energy conservation
measures. The plan included increasing
FIGURE 3. 2019 trends for constant speed chiller #9 efficiency (kW/ton) vs. lift (deg F) and two setpoints so that all condenser water bal-
different loading bins. ancing valves were near 100%.
A deliberate commissioning pro-
0.70 cess ensured that condenser water pump
motors did not over-amp as they rode
0.65
down their pump curve, that there was
0.60
no excessive pump/motor vibration, that
header pressures stayed high enough for
kW/ton
6,500 - 7,500 tons
0.55
5,000 - 6,000 tons
other auxiliary equipment served by the
condenser water system, and that the
0.50
flow stayed below the maximum allow-
0.45 able for each chiller. The new operat-
ing procedure includes running as many
0.40 cooling towers as possible while staying
above minimum flow requirements and
10 15 20 25 30 35 40 45 50 55
Lift (F)
implementing power-based relational
control of the cooling tower fan variable
Source: TECO frequency devices (VFDs).
26 District Energy | Spring/Summer 2022 © 2022 International District Energy Association. ALL RIGHTS RESERVED.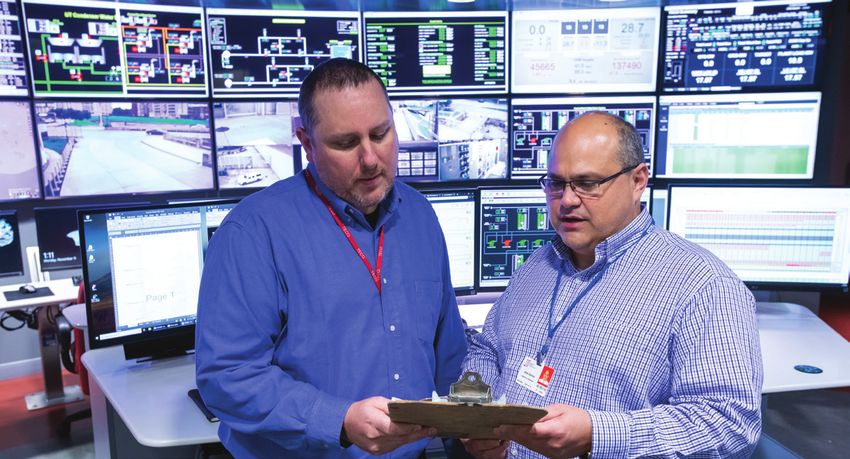
Because of the interdependencies                  Finally, the engineering team              PHASE 2: CHILLER-STAGE OPTIMIZATION
of the energy conservation measures              improved tower fan speed control. While               As the engineering team moved to
(ECMs) above, the energy savings are             conventional cooling tower control involves      the second phase of optimization, it real-
compounded. When the condenser                   delivering a specific condenser water tem-       ized that TECO’s shift operators were
valves are opened to 100%, the 16,300            perature to the chillers, holistic optimiza-     using different ways of staging and run-
gpm pumps produce 19,500 gpm with                tion achieves the best overall total plant       ning the chillers – adding or shedding
no amp or vibration issues. The extra            efficiency when calculated relationships         chillers by looking at the chiller amps,
3,200 gpm in flow results in a 16%               between fan energy and chiller energy are        chiller vanes and district chilled water
reduction in chiller lift and a smaller con-     maintained. The TECO systems employ a            end-of-line differential pressure (DP).
denser water delta T (differential). The         patented speed control method for tower          High amps, vanes near 100% or a low
smaller delta T improved the cooling             fans that is based on chiller power (kW).        DP could trigger the operator to initi-
tower’s performance. Figure 2 shows the                This first phase, from programming to      ate a chiller add; low amps, vanes near
cooling tower leaving condenser water            commissioning, was completed in March            20% or a high DP could trigger the opera-
temperature versus outdoor wet bulb              2020. In just the first year of improved         tor to initiate a chiller shed. They main-
(WB) temperature at 100% flow and                operations, TECO saved 6,656,000 kWh.            tained end-of-line differential pressure
100% fan speed.
     At 70 degrees F WB, for exam-                                                                                           In just the
ple, the cooling tower approach with                                                                                         first year of
a 15-degree F range is 8.7 F, while the                                                                                      improved
approach with a 12 F range is 7.5 F. The                                                                                     efficiencies, the
                                                                                                                             company saved
cooling tower approach also improves                                                                                         6,656,000 kWh.
as flow is reduced. Running more towers                                                                                      TECO can now
creates a larger surface area, and at 80%                                                                                    avoid spot-
flow, the approach at 70 F WB with a                                                                                         purchasing
                                                                                                                             power and
12-degree F range is 4.5 F. The improve-                                                                                     more easily
ment in lift in this example is 8.7 – 4.5                                                                                    keep up with
= 4.2 F. Using the result from Figure 1                                                                                      customer
yields a 0.0445 kW/ton improvement in                                                                                        demand.

efficiency.                                         TECO

  About TECO
  Houston-based Thermal Energy
  Corporation’s 48 MW combined heat
  and power-based district energy system
  provides chilled water and steam to 51
  buildings totaling 24.3 million square feet
  at Texas Medical Center. The chilled water
  system consists of 27 chillers and an 8.8
  million-gallon thermal energy storage
  tank. The equipment is controlled by a
  Toshiba distributed control system.

  Cooling capacity is 120,000 tons at 40 F.
  Annual chilled water production is 345.1          TECO

  million ton-hours.

  Benefits of optimization                       • Cost savings                                 Texas Medical Center
  • Improved plant efficiency                      - Annual operations: $550,000                • 10 million patient encounters annually
    - 7% annually                                  - Simple payback: 1.9 years                  • 180,000+ surgeries annually
  • Energy savings                               • Lower CO2 emissions totaling                 • 9,200 patient beds
    - Electrical: 16.1 million kWh/year            13,685,000 lbs/year                          • $2 billion of annual life science
    - Demand reduction: 2,112 kW                 • Enhanced maintenance prioritization            research

© 2022 International District Energy Association. ALL RIGHTS RESERVED.                            District Energy | Spring/Summer 2022     27
by increasing or decreasing the chillers’          foot, 8.8 million-gallon TES tank, the tall-    TECO’s utility. It then calculates the com-
evaporator flow set points.                        est thermal energy storage tank in the          parative cost of discharging the tank and
      TECO employed several ECMs to                world when it was installed. It has a           using the stored water during the day. This
standardize procedures. First, the team            capacity of 76,000 ton-hours, a maximum         gives TECO the real price of the stored
began automating the chiller add/shed              flow of 16,500 gpm and a maximum out-           energy as it comes in every five minutes.
decision criteria – screen graphics in the         put of approximately 8,250 tons (at a           Done correctly, it is much like successful
Toshiba distributed control system inter-          12-degree F chilled water delta T).             stock trading: buy low, sell high.
face now tell the operators the next chiller            The TES tank allows TECO to serve               If the real-time cost of electricity
to stage on or off, and the optimum flow           its customers with absolute reliabil-           is greater than the trigger cost and the
setpoints on chilled water and                                 ity, even in the case of chiller    time is within the appropriate window of
condenser water. TECO runs                                     plant equipment failure, using      operation, operators will receive a mes-
the older constant-speed chill-         A NEW ALGORITHM        stored energy when it’s less        sage to discharge the tank at a specified
ers as close to full amps and           OFFSETS                expensive and reducing elec-        flow rate.
full vanes as possible. These           INCORRECT              trical demand during peak
machines are served by 900              WEATHER                chilled water usage. TECO           CONTINUOUS IMPROVEMENT, ALWAYS
hp constant-speed condenser             FORECASTS AND          was surprised to discover                 As TECO has discovered, the result of
water pumps and 500 hp and              KEEPS UP WITH          that charging the tank every        chiller plant optimization is not necessar-
600 hp constant-speed chilled           ELECTRICITY            night was much more expen-          ily a one-time gain.
water pumps. Figure 3 trends            RATE CHANGES.          sive than expected – and the              Lasting value often comes from
the 7,000-ton constant speed                                   data showed that significant        implementing standard operating proce-
York chiller efficiency (kW/ton)                               cost savings could be gained        dures, maintaining consistent operations
versus lift (degrees F) at different load-         by using real-time pricing information to       across all shifts and accruing multiple
ing bins (6,500- to 7,500-ton bins and             automatically charge and discharge the          continuous savings, such as the daily trim-
5,000- to 6,000-ton bins). Also, TECO now          tank at optimal times.                          ming of TECO’s electrical bill through pre-
allows the East Chiller Building to modu-               TECO had been following the gen-           dictive TES dispatch.
late chilled water flow to make up the dif-        erally accepted practice of charging the              Progress may start with a big bang –
ference and maintain the end-of-line DP            tank at night when electricity prices are       a revamped chiller plant that immediately
at 7 psi. The district chillers are staged by      lower and discharging it during the day. In     drops cooling costs – but continual data-
looking at the tons, amps and VFD speed            Texas, real-time pricing can change every       driven efficiencies can save hundreds of
of the East Chiller Building chillers.             five minutes. The operations team was           thousands of dollars annually as well.
      Along with the ECMs, TECO inte-              relying on weather forecasts, electricity
grated the Optimum Energy Plant Diag-              market price predictions and manual cal-
nostics tool into its work to help maintain        culations to estimate the most advanta-                        Michael P. Manoucheri,
business continuity. TECO engineers have           geous times for charging and discharging.                      P.E., is TECO’s president and
traditionally collected monitoring data;           Those methods couldn’t offset incorrect                        CEO. He holds a Master of
adding data rationalization and diagnos-           forecasts or keep up with rapid changes –                      Science in mechanical engi-
tics allows the team to mine those assets          but a clever algorithm could.                                  neering from UT Austin and
and prioritize opportunities to increase                Optimum Energy engineers rea-                             a Bachelor of Science in
reliability and efficiency and to track key        soned that the tank could be even more          mechanical engineering from Colorado
performance indicators and monitor each            cost effective with an automated algo-          State University.
piece of equipment in the plant.                   rithm, which would allow the Toshiba dis-       mmanoucheri@tecothermalenergy.com
      Even with Covid-19 restrictions in           tributed control system to automate the
place, the second phase was completed              TES charge/discharge decision criteria.
by June 2020 – in time to maintain oper-           Optimization would also include graphics                        Ben Erpelding, P.E., chief
ational reliability and avoid the high             screens in the Toshiba human-machine                            technology officer at
demand charges of a Texas summer.                  interface that could tell operators when,                       Optimum Energy, has over
      TECO saved 9,491,000 kWh of                  how and why to use the tank. Called eco-                        20 years of experience in
energy in the first year of chiller stage          nomic dispatch, the solution uses histori-                      energy efficiency, chiller
optimization. After completing the first           cal data and actual electric market pric-                       plant optimization, and
two phases, electrical demand was                  ing to calculate the true costs of charging     combined heat and power. He received his
reduced by 2,112 kW.                               the tank at night with power from TECO’s        Master of Science and a Bachelor of Sci-
                                                   local grid and using the stored chilled         ence in mechanical engineering from San
PHASE 3: TES SYSTEM OPTIMIZATION                   water during the day.                           Diego State University and is a registered
      A deep dive into data collected over              The algorithm takes into account the       professional mechanical engineer in the
the first year of operations revealed a            kilowatts needed to charge the TES tank         state of California.
source of additional savings: TECO’s 150-          and the real-time electrical rate from          ben.erpelding@optimumenergyco.com

28     District Energy | Spring/Summer 2022                               © 2022 International District Energy Association. ALL RIGHTS RESERVED.

You can also read