The 2014 U.S. Senate Race in North Carolina
←
→
Page content transcription
If your browser does not render page correctly, please read the page content below
The 2014 U.S. Senate Race in North Carolina:
       Randomized Experiments in an Online Survey of North Carolina Voters
                          September 28 – October 5

                                 SUMMARY OF FINDINGS
The Elon University Poll conducted a series of randomized experiments using a sample obtained
from an opt-in online panel. The online survey was conducted from September 28th to October
5th and obtained a sample of 763 registered voters. The survey was designed to answer several
questions relevant to the 2014 U.S. Senate race in North Carolina.

          1. How do perceptions of the president influence evaluations of Kay Hagan?

The effect the president has on perceptions of Hagan was measured by showing an image of Kay
Hagan to half the respondents and a picture of Senator Kay Hagan with President Obama to the
other half. The results of the experiment show Obama had a negative effect on Hagan’s
favorability rating for all respondents, Republicans, Democrats, and Independents (although the
negative effect for Democrats and Independents was modest and not statistically significant).
Respondents who said they approved of the president’s job performance were slightly more likely
to see Hagan in a more positive light, but the effect was extremely small and not statistically
significant.

 2. How do perceptions of the governor of North Carolina influence evaluations of Thom Tillis?

When North Carolina House Speaker Thom Tillis was shown in a picture with Governor Pat
McCrory his favorability rating also declined, but this negative effect was much smaller than
Obama’s negative effect on Hagan. Even Republican’s viewed Tillis more negatively when seen
with the governor. Independents saw almost no change in their perception of Tillis when he is
depicted in an image with McCrory.

                                                                                                 1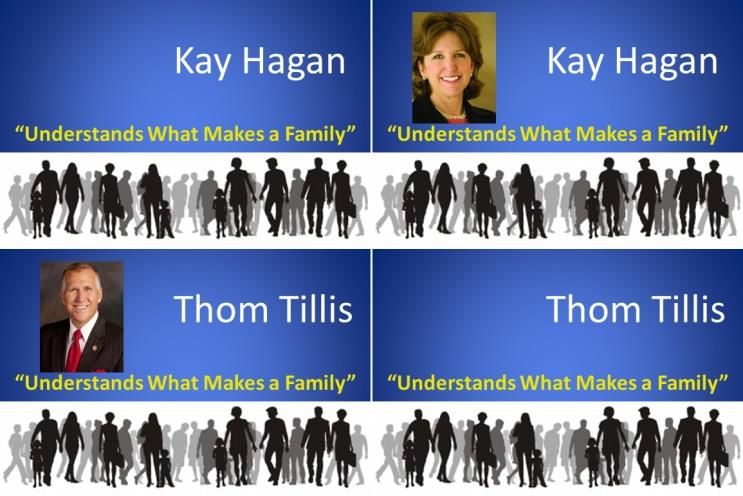
3. Could the presence of the Libertarian Candidate on the ballot influence the Senate race?
The academic literature and past election results strongly suggest public opinion polls frequently
exaggerate the number of votes a third party candidate will receive in an election. But by just
being on the ballot Sean Haugh is guaranteed to get a share of the vote. In 2010 the previous
Libertarian candidate received approximately 2 percent of the vote. In a close race that 2 percent
could make a difference. The survey randomly assigned respondents to the full ballot that voters
will see in the voting booth and a shortened ballot without the Libertarian candidate. The results
show that in a close race Sean Haugh would siphon more votes from Kay Hagan than he would
Thom Tillis, twice as many in fact. Tillis should be thankful that Haugh is on the ballot.
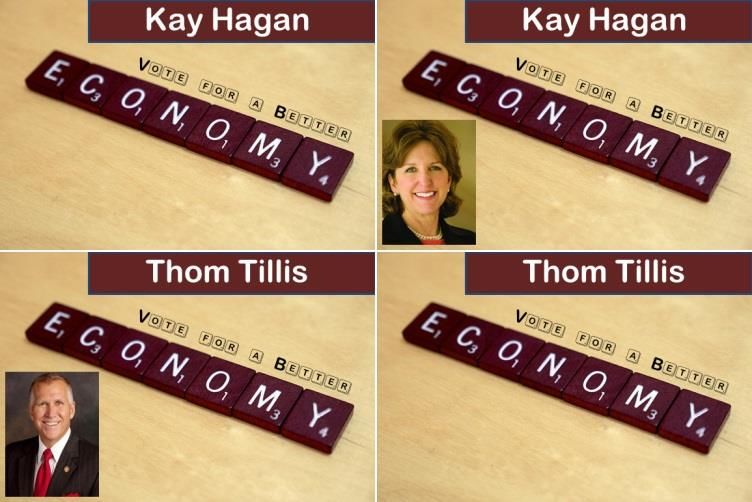
4. Which issues tend to help or hurt Hagan and Tillis?
Respondents were shown different digital postcards with the candidates’ names (and sometimes
images) and a policy message. Each respondent viewed eight policy messages, but only half had
Hagan’s name/image on them and the other half had Tillis’s name/image associated with the
policy message. Overall, Hagan’s favorability was much higher than Tillis’s when respondents
viewed postcards about education and women’s health. Hagan’s advantage over Tillis shrank
considerably when respondents viewed postcards about immigration, national defense, and what
makes a family (gay marriage).
5. Could candidate order on the ballot make a difference in the U.S. Senate race?
The political science literature on ballot order generally has found that being listed first on a ballot
gives a candidate a small advantage, especially in low information elections. In presidential
elections where most people have made up their minds before entering the voting booth, ballot
order may have much smaller effects. Yet past studies have found in some cases being listed
second or last on a ballot gives a candidate the advantage. This is what the experiment in this
study found. Hagan does better against Tillis when Tillis is listed first and Tillis does better when
Hagan is listed first. Hagan gains 6 percentage points when being listed second and Tillis gains 6
percentage points when listed second. State law determines the ballot order in general elections.
Because Pat McCrory won the race for governor in 2012 the Republican candidate will appear first
on the ballot in the 2014 midterm election. The results here suggest that Tillis will lose some votes
because his party won the gubernatorial election in 2012.
An elaboration of the findings and descriptions of the study can be found in the full report that
follows.
-Dr. Kenneth E. Fernandez and Dr. Jason A. Husser
2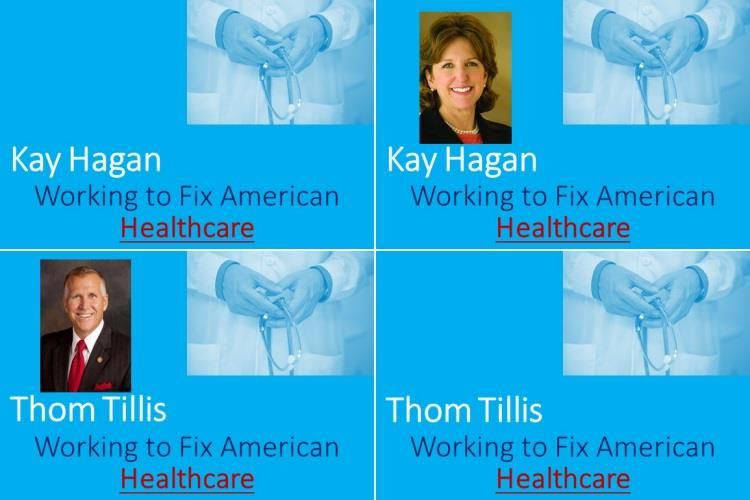
FULL REPORT
Randomized experiments embedded in an online survey
Although social science research sometimes simply aims to describe the world accurately, most
scholarship eventually hopes to provide explanations. Yet such explanations require the
identification of causal relationships which requires certain criteria to be met. Randomized
1
experiments are considered the “gold-standard” for demonstrating cause and effect. Scholars
have traditionally conducted experiments on a readily available population (often college
students). Unfortunately, findings based on such samples might not be generalizable to larger
populations. Embedding randomized experiments inside a population-based survey combines the
2
best aspects of experiments and surveys and can be applied to a large and diverse population.
This can be done using a telephone survey, unless the experiments require respondents to view
different images. In these cases an online survey is usually the most effective method. Potential
voters are given different images and information based on random assignment. This is done to
see if different information will produce different responses to survey questions. The study
collected information from 763 registered voters using an opt-in online panel. Because
respondents were not randomly selected the sample it is NOT a probability sample. Therefore it is
NOT designed to provide an accurate measure of how much of a lead one candidate has over
another. Instead, the study is designed to answer several complex questions which are salient to
the 2014 midterm election in North Carolina. These include:
How do perceptions of the president influence evaluations of Kay Hagan?
How do perceptions of the governor influence evaluations of Thom Tillis?
Could the presence of the Libertarian candidate on the ballot influence the Senate race?
Which issues tend to help or hurt Hagan and Tillis?
Could candidate order on the ballot make a difference in the U.S. Senate race?
These questions are difficult, if not impossible to answer with simple percentages, cross-
tabulations, and even multivariate statistical models. Because a single survey collects information
at a single point in time and doesn’t follow respondents over a period of time, it is difficult to
determine causality. Experiments using random assignment and conducted on large, diverse
samples can overcome some of these limitations. Below are the results from this online survey.
3
How do perceptions of the president influence evaluations of Kay Hagan?

Whether a person approves or disapproves of the president’s job performance is a pretty good
predictor of whether or not that person plans to vote for Kay Hagan. The September 2014 Elon
University Poll found 88% of respondents who approved of Barack Obama’s job performance said
they were planning to vote for Senator Hagan this November. But what about the 12% of the
president’s supporters who don’t plan to
                                                                 Figure 1:
vote for Hagan? And what about the
                                                      Obama's Influence On Hagan's
people who don’t approve of the                                Favorability
president? 19% of them still plan to vote
for Hagan. Perceptions of the president All Registered Voters*                -0.6
influence elections and voters in complex
ways. Very consistently the president’s                Democrats                    -0.3
party loses seats in a midterm election,
but how much of a loss will it be and how
                                                     Independents                   -0.3
does this play out in specific elections?
We designed an experiment to see how
perceptions of Obama might influence                Republicans* -1.2
potential voters. For approximately half of
respondents we show a digital postcard
                                                Obama Approvers                              0.1
with Kay Hagan’s name and image and ask
how they felt about the candidate and for
the other half we showed a postcard with Obama Disapprovers* -1.1
Kay Hagan with the President (see images
                                                                  -1.5   -1.0      -0.5  0.0
above).
                                                   Figure depicts average change when Obama's image is shown
The experiment found that for most to treatment group compared to not shown to a control group.
                                             7-pt scale -3 (much worse) to +3 (much better). * = statistically
respondents, seeing Hagan with Obama significant effect. 763 registered voters via an online panel.
reduced favorability (see figure 1). This
was especially true for Republicans and respondents who said they disapproved of the president’s
job performance. The only group where the presence of Obama increased Hagan’s favorability
score was with respondents who said they approve of the job Obama is doing, and the positive
                                                                                                               4
effect on this group was extremely small and not statistically significant. Given that the
president’s approval rating is fairly low with registered voters (38% in the September 2014 Elon
University Poll), Hagan should continue distancing herself from the president.

      How do perceptions of the governor influence evaluations of Thom Tillis?

Numerous studies have been conducted on how presidential approval ratings and evaluations
influence congressional elections. Yet almost nothing has been published on how gubernatorial
approval influences a U.S. Senate race. According to the September 2014 Elon University Poll 67%
of respondents who approve of Governor McCrory’s job performance said they plan to vote for
Tillis this November. But much of this overlap is likely due to partisan attachments, not the
                                                           evaluation a voter has of the governor.
                         Figure 2:
        McCrory's Image Hurts Tillis Favorability          How do we determine how helpful or
              Less than Obama Hurts Hagan's                harmful the governor is to Thom Tillis?
                        Favorability                       One method is a to conduct a
  All Registered Voters*                  -0.3
                                                           randomized       experiment      which
                                                           presents half of respondents with an
              Democrats*                -0.4               image of Thom Tillis by himself and
                                                           the other half an image of Thom Tillis
             Independents                     -0.1         next to the governor (See images
                                                           above).
            Republicans*                       -0.3               The experiment found that when
                                                                  respondents saw Thom Tillis with
    McCrory Approvers                             -0.2            Governor      Pat      McCrory    their
                                                                  perceptions of Tillis were negatively
McCrory Disapprovers*                        -0.4                 affected. Although the negative effect
                                                                  that McCrory has on respondents was
                            -1.5      -1.0      -0.5      0.0     statistically significant for several
 Source: Elon Poll, October 2014. Figure depicts average change   groups (see asterisks in Figure 2), the
 when a picture of Pat McCrory is shown in a treatment group
 compared to not being shown in a control group. 7-pt scale -3
                                                                  effect was much smaller overall than
 (worst) to +3 (best). * = statistically significant effect       Obama had on Hagan’s favorability.
                                                                                                       5
Tillis should probably also distance himself from the governor but the ramifications of being tied to
McCrory is not as detrimental as being tied to President Barack Obama.

  Could the presence of the Sean Haugh on the ballot influence the Senate race?
Last month the Elon University Poll did not list Sean Haugh’s name when asking about the U.S.
Senate race in North Carolina. Instead the Elon University Poll asked voters the following question:
“If the election for U.S. Senate was held today would you vote for [Republican Thom Tillis,
Democrat Kay Hagan], or someone else? With Tillis’s and Hagan’s names rotated randomly to
avoid ordering bias. The poll found 9% of likely voters said “someone else” but when pressed who
the someone else was most (73%) said they didn’t know and only 4 respondents mentioned the
Libertarian party or Sean Haugh’s name. This is very different from recent polls conducted by
other organizations which find 7% to 9% of likely voters planning to vote for the Libertarian
candidate. These numbers for Sean Haugh should be looked at in a larger context.

Michael Beitler ran for U.S. Senate in North Carolina in 2010 as a Libertarian and received
approximately 2% of the vote. Surveys from PPP and SurveyUSA both had Beitler receiving 6% of
the vote. Elections surveys in the United States which list third party candidates often exaggerate
the proportion of the electorate that will actually
vote for such a candidate. Why is that? Many
political scientists believe it is because voters are
strategic and rational and realize voting for a minor
party candidate would be essentially throwing their
           3
vote away. But there are elections where some
voters are dissatisfied with both candidates. In these
cases these voters can either not vote or cast a
                                            4
protest vote for a third party candidate.

The randomized experiment described here is not designed to estimate how much of the vote
Haugh will receive in November. Instead, it is designed to see which of the two major party
candidates is hurt more by Haugh being on the ballot. Assuming Haugh will receive a similar
proportion of the vote his counterpart did in 2010 (2%), could this small amount influence the
election if the race between Tillis and Hagan is close? Would Haugh take more votes from Hagan
or Tillis? To answer this question we developed an experiment that showed different respondents
different ballots, some with the Libertarian candidate listed and some that excluded the candidate
(see ballot above).

                                                                                                   6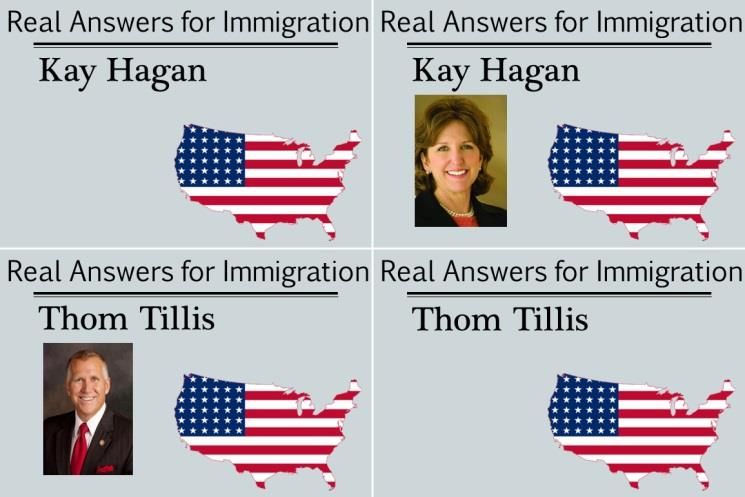
Table 1: Third-Party Candidate Being on the Ballot Helps Thom Tillis

Vote Choice               Haugh Not On Ballot                 Haugh Included On Ballot

Kay Hagan                        59% (205)                             51% (193)

Thom Tillis                      41% (143)                             37% (138)

Sean Haugh                          n.a.                                12% (46)

Total                           100% (348)                             100% (376)

Online Survey 763 Registered NC Voters. Cell sizes in subscripts. Split Ballot Experiment.

The following table presents the results of the experiment to determine which candidate would
likely lose more votes to Haugh. The experiment uses survey data obtained from an opt-in online
panel and was not designed to measure how much of a lead a candidate has (See the September
2014 Elon University Poll which uses a RDD/Wireless telephone sample if interested in how likely
voters plan to vote in November). The experiment found that Hagan is hurt more than Tillis by the
presence of Sean Haugh on the ballot. Hagan loses 8 percentage points to Haugh, while Tillis only
loses 4 percentage points. This suggests that if the race is extremely close, Haugh’s presence on
the ballot could influence the outcome by benefiting one candidate, specifically Tillis.

        Could Candidate Order on the Ballot Make a Difference in the Election?
The order in which the candidates appear on the ballot is determined by a process designated by
state law (G.S. 163-165.6). Candidates are listed on the ballot “in alphabetical order by party
beginning with the party whose nominee for Governor received the most votes in the most recent
gubernatorial election.” Because Pat McCrory won the governor’s race in 2012 Tillis will be listed
first on the ballot. Could this ballot order influence the election outcome?
                                                                                   5
Prior research suggests that for low information races ballot order can matter. Low information
races are races where there is little media attention, such as local elections or nonpartisan
elections. The North Carolina U.S. Senate rate does not resemble a “low information” race and
therefore one might expect that ballot ordering will not influence the outcome of this election. We
                                                 test this hypothesis by conducting a randomized
                                                 experiment within an online survey which
                                                 presents different ballot options to different
                                                 respondents. For one ballot Tillis is listed first,
                                                 for an alternative ballot Hagan is listed first (See
                                                 image).

                                                                                                   7
Table 2: Hagan Benefits from ‘Recency Effects” of Ballot Ordering

          Vote Choice              Hagan 1st on Ballot             Tillis 1st on Ballot

          Kay Hagan                      52% (185)                      58% (213)

          Thom Tillis                    42% (150)                      36% (131)

          Sean Haugh                      6% (21)                        7% (25)

          Total                         100% (356)                     100% (368)

          763 Registered NC Voters. Cell sizes in subscripts. Split Ballot Experiment.

Surprisingly, the experiment found that being first on the ballot is not an advantage but a
disadvantage. Hagan does much better when Tillis is listed first and Tillis does better when Hagan
is listed first. This may seem counter intuitive but other studies have also found evidence of a
                                                                              6
recency effects on ballot order (the benefit of be listed later on the ballot). Recency effects are
thought to be more likely in telephone surveys because respondents tend to remember the last
                                                                                              7
name they hear, but studies have also found recency effects in online environments as well. The
results here suggest Thom Tillis is harmed by being placed first on the ballot.

              Which Issues Help or Hurt the Two Major Party Candidates?
Elections are about choosing candidates but they are also about issues, but it is not always easy for
voters to evaluate a candidate’s stance on a particular issue. Candidates often have an incentive to
remain vague or ambiguous regarding various policy issues, for fear a strong stance on an issue
                             8
could alienate some voters. Because of this it isn’t always easy to observe how policy issues
might influence an election. Complicating matters further is that voters frequently stereotype
candidates based on race, gender, and age. For example women are often seen as more apt at
dealing with issues regarding education, healthcare, and welfare; while men are often seen as
                                                                                                    9
more capable of addressing issues such as national defense, foreign policy, terrorism, and crime.

A randomized experiment was designed and embedded in an online survey to explore which issues
seem to evoke more positive or negative evaluations for each of the two major party candidates.
Furthermore, the experiment was designed to examine if gender influences how potential voters
perceives a candidate’s policy position. Does the gender gap increase or decrease depending on
different policy contexts? Do women perceive Thom Tillis in a more positive light depending on
the issue being discussed?

A battery of digital postcards was shown to respondents. Each respondent was shown one
postcard for each policy area (education, healthcare, national defense, the economy, immigration,
                                                                                                        8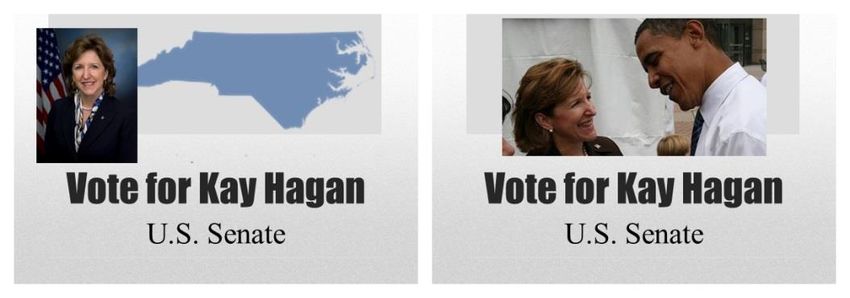
voter identification, women’s health, and family values). For half the respondents a postcard
would only contain the name of the candidate and a brief policy message, the other half the
postcard would also contained the candidates’ image. For example, a respondent would see only
one of the four digital postcards regarding national defense in the image above. The remaining
postcards for the other policy issues can be found in the Appendix B of this report.

Table 3 below presents the results of the randomized experiment. Because the data was not
obtained through a random sample the absolute numbers cannot be interpreted as representing
the size of Hagan’s advantage. Instead, the experiment is designed to see if there are any
differences in evaluations by policy issue. The overall results suggest that Hagan’s favorability
(relative to Tillis) is largest when respondents are primed with the education (.60) and the
women’s health postcards (.56). Hagan’s favorability (relative to Tillis) is not as large when
respondents are shown postcards dealing
with families (.27) and national defense (.27)
and immigration (.23). This suggests that
respondents are less likely to see Tillis in a
favorable view when they are reminded of
education and women’s health. Hagan’s
relative advantage drops when respondents
are reminded of issue related to families,
national defense and immigration.

The overall numbers are useful but
candidates may want to know how Independents see the two candidates when primed with
different policy issues. Hagan again has her strongest advantage when Independent registered
voters are shown the education postcard and the smallest relative advantage when respondents
are shown the economy and voter identification postcards.

Among men Hagan’s advantage disappears when male respondents are shown the national
defense postcard and nearly disappears when shown the family (gay marriage) and the economy
postcard. Hagan’s advantage also declines with women when female respondents were shown the
immigration postcard.

The results suggest that Tillis would benefit by attacking Hagan on issues such as immigration,
national defense, voter identification and the economy. It also suggests that Tillis needs to
improve his image regarding a number of policy issues, but especially with education, and
women’s health.

                                                                                               9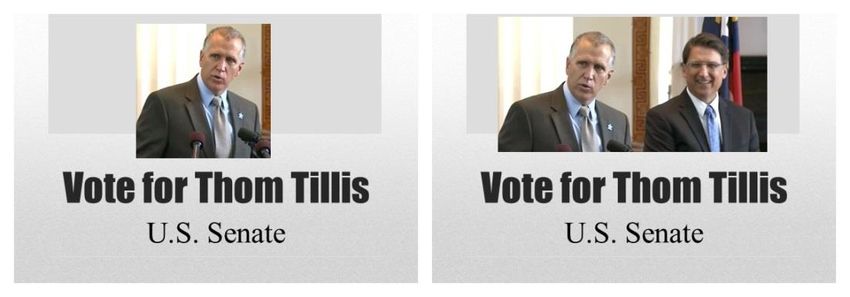
Table 3: Hagan – Tillis Favorability Ratings on Various Policy Issues (Differences)
      Policy Area                                           Party                      Gender
                                                            Democrats* 1.7                  Men 0.0
National Defense                Overall* 0.27             Independents* 0.5              Women* 0.5
                                                           Republicans* -1.8

                                                            Democrats* 1.8                  Men 0.1
Economy                         Overall* 0.34              Independents 0.3              Women* 0.5
                                                           Republicans* -1.6

                                                            Democrats* 1.6                  Men 0.3
Immigration                      Overall 0.23             Independents* 0.4               Women 0.2
                                                           Republicans* -1.8

                                                            Democrats* 2.2                 Men* 0.5
Women's Health                  Overall* 0.56             Independents* 0.5              Women* 0.7
                                                           Republicans* -1.5

                                                            Democrats* 1.8                 Men* 0.5
Education                       Overall* 0.60             Independents* 0.7              Women* 0.7
                                                           Republicans* -1.1

                                                            Democrats* 2.0                  Men 0.2
Healthcare                      Overall* 0.36              Independents 0.4              Women* 0.5
                                                           Republicans* -1.9

                                                            Democrats* 1.9                  Men 0.4
Voter ID                        Overall* 0.36              Independents 0.1              Women* 0.4
                                                           Republicans* -1.2

                                                            Democrats* 1.7                  Men 0.1
"What makes a Family"           Overall* 0.27             Independents* 0.4              Women* 0.4
                                                           Republicans* -1.7

Source: Elon University Poll, October 2014.
Experimental effects of policy primes on (Kay Hagan Evaluation – Thom Tillis) evaluation.
Positive values indicate an advantage for Hagan. Negative values indicate an advantage for Tillis.
Asterisks by label imply the advantage is statistically significant (not due to random chance).
Results are for registered NC voters.

                                                                                                      10
RELEVANT ACADEMIC PUBLICATIONS
1
Remler, D. K., & Van Ryzin, G. G. (2014). Research methods in practice: Strategies for
description and causation: Sage Publications.
2
Mutz, D. C. (2011). Population-based survey experiments. Pinceton, NJ: Princeton
University Press.
3
Fey, M. (1997). Stability and coordination in Duverger's law: A formal model of
preelection polls and strategic voting. American Political Science Review, 135-147.
4
Kselman, D., & Niou, E. (2011). Protest voting in plurality elections: a theory of voter
signaling. Public Choice, 148(3-4), 395-418.
5
Brockington, D. (2003). A low information theory of ballot position effect. Political
Behavior, 25(1), 1-27.
6
Miller, J. M., & Krosnick, J. A. (1998). The Impact of Candidate Name Order on Election
Outcomes. The Public Opinion Quarterly, 62(3), 291-330. doi: 10.2307/2749662
7
Murphy, J., Hofacker, C., & Mizerski, R. (2006). Primacy and Recency Effects on Clicking
Behavior. Journal of Computer-Mediated Communication, 11(2), 522-535.
8
Hersh, E. D., & Schaffner, B. F. (2013). Targeted Campaign Appeals and the Value of
Ambiguity. The Journal of Politics, 75(02), 520-534.
9
Hayes, D. (2011). When Gender and Party Collide: Stereotyping in Candidate Trait
Attribution. Politics & Gender, 7(02), 133-165.
11Basic Methodological Information
Survey Mode: Online using opt-in panel from Survey
Sampling International (with quotas to
balance sample to reflect U.S. Census
information for North Carolina)
Target Population & Sample Area Registered Voters in North Carolina
Dates in the field: September 28 – October 5, 2014
Sample Size of Registered Voters 763
Margin of Error Not Applicable (See Below)
Weighting Variables Age, Race, & Gender
Respondents for this survey were selected from among those who have volunteered to
participate in the opt-in online panel for Survey Sampling International (SSI). A quota
system was used to obtain a balanced sample that reflects the North Carolina adult
population on age, gender and race and then weighted to match U.S. Census
information. Subjects who said they were not registered to vote in North Carolina were
allowed to complete the survey but were excluded from the analysis. Although SSI
goes to great length to produce high quality online panels that can produce samples
that reflect the demographics of the target population, these samples are still
considered nonprobability samples. Because the sample is based on those who initially
volunteered or have been recruited for participation in the online panel rather than
randomly selected from the broader state population, estimates of sampling error
(margin of error) can be misleading. Although opt-in online surveys are used by
numerous organizations and have produced interesting and often accurate results the
American Association of Public Opinion recommends organizations not produce
margins of errors when using opt-in survey data because audiences may interpret the
findings as coming from a probability sample. Information on Survey Sampling
International’s online panel can be found at: http://www.surveysampling.com/who-we-
are/awards. Please direct questions about the survey’s methodology to the Director of
the Elon University Poll, Dr. Kenneth Fernandez at 336-278-6438 or
kfernandez@elon.edu.
12APPENDIX A: SURVEY QUESTIONNAIRE
Because respondents are shown slightly different survey items based on random assignment
the following list of questions is not comprehensive. To view the survey as it appears to a
random respondent you can take the survey yourself at:
http://elon.co1.qualtrics.com/SE/?SID=SV_cvHO0huZ557hFYh
This is a public opinion survey of adults (18 years of age or older) living in North Carolina. The
survey is being conducted on behalf of the Elon University Poll, an independent survey research
center located at Elon University. The survey takes approximately 5 minutes to complete and
consists of questions regarding national and state politics. The survey is completely voluntary
and all of your responses will be kept confidential. If you have any questions about the survey
feel free to contact the director of the Elon University Poll, at elonpoll@elon.edu. For further
information about the Poll and our University you can visit our website: http://elon.edu/elonpoll
Thank you for your time.
Q1. Are you a resident of North Carolina?
o Yes
o No
Q2. Are you registered to vote in North Carolina?
o Yes
o No
Q3. How old are you? [Enter number below]
Q4. What is your gender?
o Male
o Female
Q5. What racial or ethnic group best describes you?
o White
o African American or Black
o Hispanic or Latino
o Asian
o Native American
o Other
Q6. Do you [approve or disapprove] of the way Barack Obama is handling his job as president?
[Responses Rotated]
o Approve
o Disapprove
o Don't Know
13Q7. Do you approve or disapprove of the way Pat McCrory is handling his job as governor?
[Response rotated]
o Approve
o Disapprove
o Don't Know
The next set of questions will ask you to view a series of hypothetical postcards for candidates
for US Senate. Please examine each postcard carefully. Regardless of who you plan to vote for,
please indicate if it makes you feel better or worse about the candidate mentioned in the
question.
[Images Randomly Rotated]
Q8. How do you feel about Kay Hagan after viewing this postcard?
o Much Better
o Somewhat Better
o A Little Better
o Neither Better Nor Worse
o A Little Worse
o Somewhat Worse
o Much Worse
[Images Randomly Rotated]
Q9. How do you feel about Thom Tillis after viewing this postcard?
o Much Better
o Somewhat Better
o A Little Better
o Neither Better Nor Worse
o A Little Worse
o Somewhat Worse
o Much Worse
14Q10. How do you feel about Kay Hagan after viewing this postcard?
How do you feel about Thom Tillis after viewing this postcard?
[Questions and Images Randomly Rotated]
o Much Better
o Somewhat Better
o A Little Better
o Neither Better Nor Worse
o A Little Worse
o Somewhat Worse
o Much Worse
Q11 – 18 POLICY POSTCARDS
How do you feel about Thom Tillis after viewing this postcard?
How do you feel about Kay Hagan after viewing this postcard?
[Questions and Images Randomly Rotated]
o Much Better
o Somewhat Better
o A Little Better
o Neither Better Nor Worse
o A Little Worse
o Somewhat Worse
o Much Worse
*See Appendix B for the remaining digital postcards for the 7 other Policy Issues
15Q19. The next question will present to you candidates appearing on the ballot for U.S. Senate in
November. Please indicate who you plan to vote for in the upcoming U.S. Senate election.
Please respond as if you were in the voting booth.
Q20a. Generally speaking, do you usually think of yourself as a Republican, Independent, or
something else?
o Republican
o Democrat
o Independent
o Something else
o Don't Know
Q20b. Would you call yourself a strong Democrat or not a strong Democrat?
o Strong Democrat
o Not a Strong Democrat
o Don't Know
Q20c. Would you call yourself a strong Republican or not a strong Republican?
o Strong Republican
o Not a Strong Republican
o Don't Know
Q20d. Do you think of yourself as closer to the Republican Party or Democratic Party?
o Republican
o Democrat
o Neither
o Don’t Know
Q21. When it comes to politics, do you usually think of yourself as ... [Responses Rotated]
o Very Liberal
o Liberal
o Slightly Liberal
o Moderate
o Slightly Conservative
o Conservative
o Very Conservative
o Haven't Thought Much about This
16Q21a. If you had to choose, would you consider yourself a liberal, a
conservative, or a moderate?
o Liberal
o Conservative
o Moderate
o Don’t Know
Q22. How much school have you completed?
o Less than high school
o High school diploma or GED
o Vocational or Technical School
o Some college
o College graduate
o Some graduate school
o Professional or graduate degree
Q23. What is your marital status?
o Single
o Married
o Separated
o Divorced
o Widowed
o Other
Q24. What is your annual household income?
o Less than $20,000 $100,000 to $119,999
o $20,000 to $39,999 $120,000 to $139,999
o $40,000 to $59,999 $140,000 to $159,999
o $60,000 to $79,999 $160,000 to $179,999
o $80,000 to $99,999 $180,000 or more
Q25. Do you have a land line phone?
o Yes
o No
Q26. Do you own a cell phone?
o Yes
o No
Q27. For geographic purposes, please enter your 5-digit ZIP code.
17APPENDIX B: DIGITAL POSTCARDS USED IN EXPERIMENTS
18APPENDIX C: Online Sample Demographics
Age
18-30 .................................. 165 ................................... 22%
31-40 .................................. 128 ................................... 17%
41-50 .................................. 126 ................................... 17%
51-65 .................................. 227 ................................... 30%
65+ ..................................... 117 ................................... 15%
Total ................................... 763 ................................ 100%
Gender
Male ....................................375..................................... 49%
Female .................................388..................................... 51%
Total ....................................763................................... 100%
Race
White ...................................557..................................... 73%
Black ...................................166..................................... 22%
Other ....................................40........................................ 5%
Total ....................................763................................... 100%
Party ID
Democrats ...........................274..................................... 36%
Independents .......................247..................................... 32%
Republicans .........................208..................................... 27%
Don't Know / Refused ..........34........................................ 5%
Total ....................................763................................... 100%
19You can also read