TIMBERLAND INVESTING The Basics of - Forecon, Inc. 1890 East Main Street Falconer, New York 14733 (716) 664-5602
←
→
Page content transcription
If your browser does not render page correctly, please read the page content below
The Basics of

TIMBERLAND INVESTING

               by

     Charles Alexander, CPA
               &
     John Gifford, CF, ACF

        Forecon, Inc.
    1890 East Main Street
  Falconer, New York 14733
       (716) 664-5602

      www.foreconinc.com
Investing in Timberland, Page 1 of 9
Investing in Timberland
Although investing in timberland is certainly not a new concept, activities on Wall Street and in
the pension fund world indicate that it is becoming a popular alternative investment. It is
currently estimated that large institutional investors have over nine billion dollars invested
globally in timberland as part of their overall portfolios, and indications are for this trend to
continue to accelerate.
Investors, whether large or small, institutional or
private, have are many reasons to consider
timberland. First, there is the value appreciation
of both the timber and the land components.
There are also periodic cash returns from the sale
of timber and land and the potential for annual
lease income from other natural resources and
recreation.
Investing in timberland offers a good means of
portfolio diversification and as a hedge against
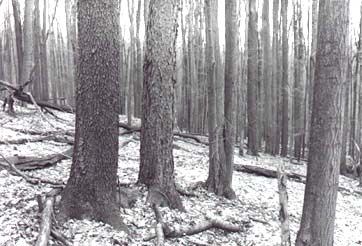
inflation. Timberland is also a “hard” (physical) Allegheny National Forest - Little Arnot
asset with a limited supply. There is a great deal Area - 1927
of satisfaction in owning undeveloped land with
numerous outdoor opportunities which include hiking, camping, hunting, fishing and jogging.
There are also income and estate tax advantages to owning real estate.
Timberland investments offer many opportunities for appreciation in value. These factors can be
broken apart and estimated separately.
Biological growth. As an investment, trees have an interesting attribute – they grow.
Influenced by species type, location and other factors, tree growth adds value to trees on a
consistent basis. The United States Department of
Agriculture’s Forest Service has developed a
growth and yield model applicable to the
northeastern United States called NE TWIGS.
For purposes of this paper, annual growth rates for
the major species have been estimated by entering
timber data collected from almost 200,000 acres
of commercial timberland in northern
Pennsylvania and southern New York into the NE
TWIGS model. Here is a summary of these
annual growth rates by species:
Allegheny National Forest - Little Arnot
Area - 1937
Prepared by: J. Gifford, ACF & C. Alexander, CPA
Forecon, Inc., June 2003Investing in Timberland, Page 2 of 9
Annual
Species Growth Rate
Red Oak 3.75 %
White Oak 3.69 %
Black Cherry 5.11 %
White Ash 5.02 %
Sugar Maple 2.22 %
Red Maple 3.44 %
Poplar 4.20 %
Other Hardwoods 2.22 %
Pine/Hemlock 5.62 %
Composite Average 3.92 %
Sources: Forecon, Inc. and the USDA - Forest Service, Northeastern TWIGS model.
In summary, this growth study indicates a growth rate of between 2.22% for sugar maple and
5.62% for hemlock and pine. Assuming an even mix of volumes among this species list, a
composite average would be 3.92%. In other words, an investment in timberland containing an
equal stocking of timber in the species listed above will appreciate at an average annual rate of
3.92% merely because the trees on the property grow at that rate; this creates a “floor” return for
an investment in timberland. Good forestry management and site conditions will improve these
annual growth rates.
Price appreciation. Though renewable, timber is
still a geographically limited natural resource that
has experienced increased demand. Accordingly,
the price of timber (hardwood timber in
particular) has increased over time. Since the mid
1980’s, the Pennsylvania State University, School
of Forest Resources has published a quarterly
Pennsylvania Woodlands Timber Market Report.
During the period December 1985 through
December 2001, reported timber prices have
increased significantly, with black cherry
experiencing an 830% increase. Other valuable Allegheny National Forest - Little Arnot
hardwood species have seen significant increases Area - 1947
as well.
Below is a table comparing average stumpage prices by species in northwestern Pennsylvania for
December 1985 and December 2001. Total and annually compounded increases are displayed,
which when combined with the annual growth rate yields a Total Annual Increase for each
species.
Prepared by: J. Gifford, ACF & C. Alexander, CPA
Forecon, Inc., June 2003Investing in Timberland, Page 3 of 9
Price per Price per Annual
MBF MBF % Com- Total
(Doyle) (Doyle) Increase pound Growth Annual
Species 12/31/85 12/31/2001 (16 Yrs) Rate Rate Increase
Red Oak $ 261.03 $ 791.57 203 % 7.18 % 3.75 % 10.93 %
White Oak $ 147.47 $ 271.20 84 % 3.88 % 3.69 % 7.57 %
Black Cherry $ 286.46 $ 2,664.54 830 % 14.96 % 5.11 % 20.07 %
White Ash $ 215.27 $ 305.10 42 % 2.20 % 5.02 % 7.22 %
Sugar Maple $ 93.23 $ 608.51 553 % 12.44 % 2.22 % 14.66 %
Red Maple $ 77.97 $ 296.63 280 % 8.71 % 3.44 % 12.15 %
Poplar $ 57.63 $ 183.06 218 % 7.49 % 4.20 % 11.69 %
Misc. Hdwds. $ 49.16 $ 111.87 128 % 5.27 % 2.22 % 7.49 %
Pine/Hemlock $ 52.55 $ 67.80 29 % 1.61 % 5.62 % 7.23 %
Average $ 137.86 $ 588.92 327 % 9.50 % 3.92 % 13.42 %
Source: Pennsylvania State University, School of Forest Resources Pennsylvania Woodlands Timber Market Report
and NE TWIGS Growth Model.
The US Forest Service prepared a similar study of hardwood stumpage prices in all of Eastern
United States from 1965 through 1997. During that period the average price for all eastern
hardwoods increased over 1,000% with an annual internal compound rate of 7.67%.
Using the US Forest Service growth estimates and
the Penn State price data, the combination of
growth and price indicates an annual appreciation
rate of 13.42%. However, both increases actually
enhance each other through compounding, and a
more accurate estimate of annual appreciation in
value due to average growth and price
appreciation is 13.89%.
Below is a table and graph that depicts the annual
value of $100 invested in December 1985 in
Allegheny National Forest - Little Arnot various timber assets and stock indices.
Area - 1958
Annual Value of $100 Invested in 1985 in Various Timber Assets and Stock Indices
Asset/Yr. ‘85 ‘86 ‘87 ‘88 ‘89 ‘90 ‘91 ‘92 ‘93 ‘94 ‘95 ‘96 ‘97 ‘98 ‘99 ‘00 ‘01
Red Oak 100 148 189 191 227 260 298 298 438 463 472 470 571 513 558 721 547
W.Oak 100 145 176 192 206 241 305 305 347 408 345 353 433 402 468 513 329
Cherry 100 129 209 252 219 356 487 487 732 868 688 836 1167 1065 1900 2491 2063
W. Ash 100 127 169 190 219 211 260 260 326 359 392 378 429 294 374 438 310
Hd.Maple 100 126 129 126 157 207 298 298 442 505 385 502 921 656 816 1003 928
Sft.Maple 100 117 135 130 152 184 223 223 359 424 335 410 623 563 625 812 654
Avg.Tbr. 100 133 173 188 201 248 313 313 441 509 448 496 663 565 798 998 801
D.Jones 100 122 125 140 178 205 213 213 243 248 331 417 511 594 743 697 648
S&P 500 100 115 117 141 167 197 206 206 221 217 292 351 459 582 695 625 543
Prepared by: J. Gifford, ACF & C. Alexander, CPA
Forecon, Inc., June 2003Investing in Timberland, Page 4 of 9
Annual Value of $100 Invested in 1985
3,000
2,500
2,000
Dollars
1,500
1,000
500
-
85 86 87 88 89 90 91 92 93 94 95 96 97 98 99 00 01
Year
Black Cherry Average Tbr* Dow Jones S & P 500
Source: Pennsylvania State University, School of Forest Resources Pennsylvania Woodlands Timber Market Report
and NE TWIGS Growth Model.
* Average timber is equal mix of all species reported by Pennsylvania State University
In summary, this data indicates that $100 invested in December 1985 in a portfolio of stocks
comprising the Dow Jones Industrial Average and the S & P 500 would be worth $648 and $543,
respectively, in December 2001. Similarly, a $100 investment in black cherry, hard maple and
red oak would be worth $2,063, $928 and $546 respectively, in December 2001. In fact, $100
invested in 1985 in an equal mix of all species reported by Pennsylvania State University would
have been worth $801 in December 2001.
Grade improvements. Timber also increases in
value because of grade improvements. For
instance, one MBF (thousand board feet) of
twenty-four inch diameter material is worth
considerably more than one MBF of eighteen-
inch diameter material, which in turn is worth
more than one MBF of twelve-inch diameter
material. Furthermore, veneer grade trees are
worth considerably more than sawlog grade trees.
Similarly, a straight tree with little branching is
more valuable than a poorly formed stem.
Allegheny National Forest - Little Arnot
Good forestry produces grade improvements in at Area - 1968
least two ways. First, poorly formed and
unhealthy trees are removed from the stand through intermediate thinnings thereby allowing the
straighter, healthier trees to remain. Second, a well maintained stand grows faster and is more
likely to regenerate in genetically superior trees.
Prepared by: J. Gifford, ACF & C. Alexander, CPA
Forecon, Inc., June 2003Investing in Timberland, Page 5 of 9
One method of estimating this grade appreciation is to consider the reported price range from the
Penn State Market Report. In their quarterly report they indicate price levels both one standard
deviation unit above and below the average price. Statistically, this range of prices includes two-
thirds of all reported prices for that species.
Using this reasoning, if the timber sold from the property can increase in price one standard
deviation unit because of good forest management practices, an additional 2.98% of annual
appreciation over this same sixteen year period would apply.
Species composition. Another means of enhancing the value of a timberland investment is to
improve the species mix on the property. Good forestry often dictates the removal of undesirable
species while retaining species diversification. This factor is difficult and impractical to
estimate. Existing conditions and landowner considerations play major roles in this alteration of
species composition. But obviously, a change from a beech / hemlock stand to a black cherry or
oak stand will yield a considerable change in value per acre.
Vegetation control and integrated pest
management. Proper control of competing
vegetation and pest control will increase the
growth rate and density of timber on a tract.
There may be times during the management of
timber that pest or vegetation control needs to be
considered. A cost benefit analysis can be
performed for the ownership unit to aide in this
decision.
Timber sale administration. Timber sales can
Allegheny National Forest - Little Arnotbe timed and presented to maximize value. A
Area - 1978 prospectus requesting sealed bids can be prepared
and mailed to many potential timber buyers.
With some flexibility, timber sales can be accelerated or delayed to match market conditions.
Sawmills with special needs (shortages, species demands, etc.) can often be matched with the
subject timber offering.
In short, investments in timber are often purchased and subsequently sold in different markets.
In theory, an investor purchases timber at “wholesale” and sells timber at “retail”.
Regeneration. The key to sustainable forestry is in providing for the forests of tomorrow. The
ability to naturally regenerate a forest by using proper silvicultural techniques is the cornerstone
for ensuring that a timberland investment remains productive long into the future. When an
investor harvests and sells timber in the proper manner, one of the many beneficial results is the
natural development of a new stand of trees, with attributes sometimes different than the
previous stand.
Prepared by: J. Gifford, ACF & C. Alexander, CPA
Forecon, Inc., June 2003Investing in Timberland, Page 6 of 9 Summary of timber appreciation. Combining all of these factors - growth, price, quality, management, and proper marketing - indicates an annual appreciation rate of 15% to over 20% for timber in our region. There is also the bare land to consider. Land. Historically, land has been slow to appreciate in value. A few axioms do apply, however, such as “location is the key to value” and “they are not making any more ground”. Proper management of the timberland can enhance the “bare land” value. A well maintained forest with a good road system and identified boundary lines will greatly enhance value. Furthermore, the increased demand for recreation properties and leases has started to improve the market for rural real estate in our region. Costs. Like any investment, timberland costs money. Besides the initial investment, there are also annual costs associated with the ownership of timberland. There are recurring items such as real estate taxes, forest management costs, road development and maintenance and general property maintenance that need to be provided for on an annual basis. Although these annual costs can be sizable, in perspective they appear to be more reasonable. At this time, in our area, we are experiencing “bare land” values of $100 to $600 dollars per acre for timberland. On the other hand, timber values range from $500 to $3,000 per acre with timber values in excess of $7,000 per acre not unusual. In general, annual real estate taxes range from $3 per acre in Pennsylvania to $20 per acre in some areas of New York. Similarly, property maintenance costs can range from $5 per acre to $25 per acre. Accordingly, a high cost property may be nearly $40 per acre per year. If this tract contains $2,500 per acre in timber and the timber is appreciating in Allegheny National Forest - Little Arnot value at 18%, this is a gross annual return of $450 Area - 1989 per acre. Taking these “expenses” into account, a reduction of $40 per-acre yields a net annual appreciation of $410 per acre or a rate of 16.4% rather than 18%. Oftentimes, annual costs are offset by lease income. Annual recreation (hunting) leases range from $3 to $15 per acre. Tax Advantages. There are income tax advantages to owning real estate and timberland in particular. The occasional sale of real estate qualifies for long-term capital gains. Also, the sale of timber qualifies for capital gain treatment, either as the sale of a capital asset or with a Code Section 631 election, which provides capital gain status for the sale of timber, coal and iron ore and ordinary deductions of business expenses if certain requirements are satisfied. The Internal Revenue Code also provides for a reforestation tax credit. This tax credit, which reduces an individual’s tax liability dollar for dollar, is 10% of up to $10,000 per year per Prepared by: J. Gifford, ACF & C. Alexander, CPA Forecon, Inc., June 2003
Investing in Timberland, Page 7 of 9

individual for qualified reforestation expenditures. After reducing the expenditure by one half of
the credit, the balance of the expenditure can be deducted over an eight-year period.

Ownership of real estate also lends itself well to the like kind exchange provisions of Section
1031 of the Internal Revenue Code. Without going into details, Section 1031, provides great
flexibility to taxpayers that want to transfer a property, yet reinvest the proceeds into other real
estate. With the correct steps and intermediaries this “exchange” can be accomplished tax-free.

The Future. The preceding information is largely historical. It is more difficult to look to the
future, but there are numerous long-term trends that support private investment in timberland and
hardwoods in particular.

Our region of Western New York and Northwestern Pennsylvania is blessed with some of the
finest hardwoods in the world. The highest quality black cherry in the world is grown within a
100-mile radius of Kane, PA or roughly from Pittsburgh to Buffalo and Cleveland to Elmira.
Our region is also known for its high quality red oak and sugar maple.

Another favorable trend in hardwood demand and the ownership of timberland is the changing
demographics in the United States. Not only is the U.S. population growing, but, also as we
mature we are more likely to purchase hardwood products in the form of furniture, cabinets and
flooring. Furthermore, technology changes have enabled many people to work out of their
homes, accommodating a more rural lifestyle.

The following chart prepared by the USDA - Forest Service shows data on domestic production
and consumption of hardwood products in millions of cubic feet for the period 1965 through
1997.
                                                       US Hardwood Production and Consumption
                                                                     1965 - 1997

                      8,000
                      7,000
                      6,000
    Mil. Cubic Feet

                      5,000
                                                                                                                                               Production
                      4,000
                                                                                                                                               Consumption
                      3,000
                      2,000
                      1,000
                         0
                          5
                                 7
                                        9
                                               1
                                                      3
                                                             5
                                                                    7
                                                                           9
                                                                                  1
                                                                                         3
                                                                                                5
                                                                                                       7
                                                                                                              9
                                                                                                                     1
                                                                                                                            3
                                                                                                                                   5
                                                                                                                                          7
                           6
                                  6
                                         6
                                                7
                                                       7
                                                              7
                                                                     7
                                                                            7
                                                                                   8
                                                                                          8
                                                                                                 8
                                                                                                        8
                                                                                                               8
                                                                                                                      9
                                                                                                                             9
                                                                                                                                    9
                                                                                                                                           9
                        19
                               19
                                      19
                                             19
                                                    19
                                                           19
                                                                  19
                                                                         19
                                                                                19
                                                                                       19
                                                                                              19
                                                                                                     19
                                                                                                            19
                                                                                                                   19
                                                                                                                          19
                                                                                                                                 19
                                                                                                                                        19

                                                                                   Year

Source: United State Department of Agriculture, Forest Service

Prepared by: J. Gifford, ACF & C. Alexander, CPA
Forecon, Inc., June 2003
Investing in Timberland, Page 8 of 9
This data indicates that hardwood production rose from 3,647 million cubic feet (MMCF) in
1965 to 7,526 MMCF in 1997. Similarly, hardwood consumption rose from 3,865 MMCF in
1965 to 7,263 MMCF in 1997.
Intangible Factors. There are many other
reasons to own real estate and timberland in
particular. An investment in timberland provides
portfolio diversity and reduces risk. Furthermore,
the timberland itself is a diverse asset of many
components.
There is also a high degree of satisfaction in
owning real property; a place to go, woods to visit,
a recreation site, in short - a hard, tangible asset.
Timberland is considered to be environmentally
Allegheny National Forest - Little Arnot
friendly, as trees absorb carbon dioxide (a Area - 1998
“greenhouse” gas). This is called “carbon
sequestration,” and may have financial benefits to timberland owners in the future, as there is
discussion of trading the environmental benefits of reducing greenhouse gases with other
operations that want to increase emissions of greenhouse gases.
Summary. Appreciation and value of a timberland investment is realized in many ways:
Timber growth
Price appreciation
Grade improvement by size
Grade improvement by removal of poorly formed and unhealthy trees
Species enhancement by removal of undesirable competing vegetation
Growth acceleration by
Proper thinning
Pest control
Natural regeneration
Land enhancements
Boundary line maintenance
Sound forestry
Vegetation control
Recreation considerations maximized, hunting, trails, wildlife, etc.
Financial incentives
Capital gain treatment for timber sales
Capital gain treatment for occasional land sales
Reforestation credit and deduction
Tax-free exchange
Basis recovery
Prepared by: J. Gifford, ACF & C. Alexander, CPA
Forecon, Inc., June 2003Investing in Timberland, Page 9 of 9 Allegheny National Forest – Little Arnot Area 1927 – 1998. The photographs in this report were taken by individuals from the United States Forest Service, Allegheny Experimental Station. The site is near Little Arnot Creek in Warren County, PA. The pictures were taken in nearly ten year intervals at the same location. In 1927, the timber was removed in two harvests. The first was a sawtimber removal in the winter of 1927. Later that year most of the remaining trees were removed for use as chemical wood. By 1937, there was extensive regeneration, primarily shade intolerant black cherry. By 1947, within twenty years of the harvests, the forest was reestablished and growth rate differences were apparent. The dominant species were black cherry, hard maple and pin cherry, a short-lived species. During the next fifty years, to 1998, the stand continued to mature. In 1998, there was 8,032 board feet of sawtimber per acre with black cherry comprising 67% of the total. The next most dominant species was hard maple followed by basswood. Today, the sawtimber on this stand is worth over $10,000 per acre. Prepared by: J. Gifford, ACF & C. Alexander, CPA Forecon, Inc., June 2003
You can also read