The best views come after the hardest climbs - Corporate Presentation December 2021 - Crew Energy Inc.
←
→
Page content transcription
If your browser does not render page correctly, please read the page content below

TSX: CR

The best views come
after the hardest climbs

Corporate Presentation
December 2021

TSX: CR

CREW: A NATURAL GAS COMPANY

Constructive Long-Term Outlook                                                                                                  US Energy Production (AEO2020 Reference case)
                                                                                                                                quadrillion British thermal units
Natural Gas Outlook                                                                                                                                     2019
                                                                                                                                                  history projections
                                                                                                                                50
                                                                                                                                                                    Dry Natural Gas
Demand is Increasing                                                                                                            45
                                                                                                                                40
                                                                                                                                35
•   Global LNG demand is forecast to exceed supply by 5.5 BCF/d
                                                                                                                                30                                  crude oil and lease
    to 20231                                                                                                                    25                                  condensate

    •    OPEC forecasting a 24.3% increase in natural gas demand to 2045                                                        20                                  other renewables
                                                                                                                                15
                                                                                                                                                                    coal
    •    EIA forecasting a 33% increase in US natural gas demand to 2050                                                        10                                  natural gas plant liquids
                                                                                                                                 5                                  nuclear
                                                                                                                                                                    hydro
•   In Canada, Intra-Alberta and LNG Canada are expected to add                                                                  0
                                                                                                                                  1990 2000 2010 2020 2030 2040 2050
    demand of 1.5 BCF/d and 2.1 BCF/d, respectively, by 2025
                                                                                                                                The Next Supercycle?
                                                                                                                                S&P Commodity Index / S&P 500 1                   A new commodity
Natural Gas Dynamics                                                                                                                                                            supercycle roughly each
                                                                                                                                 1.00          Gulf War                                decade
•   Expected to provide 25% of the world’s energy2                                                                               0.90
                                                                                                                                 0.80                                   Great Recession
•   Required for critical baseload electricity supply as electrification                                                         0.70
                                                                                                                                 0.60
    accelerates = a foundational pillar of a transition to renewables                                                            0.50
                                                                                                                                 0.40
•   Despite competition in the power markets from renewables,                                                                    0.30
                                                                                                                                 0.20
    industrial gas demand stands alone                                                                                           0.10
                                                                                                                                    -
                                                                                                                                                            Dot-Com Bubble                COVID-19
                                                                                                                                        1990     1995     2000   2005   2010   2015   2020
3    Crew Energy Inc.   Corporate Presentation   1) Source: Raymond James
                                                 2) IEA: World Energy Outlook 2020; https://www.iea.org/reports/world-energy-outlook-2020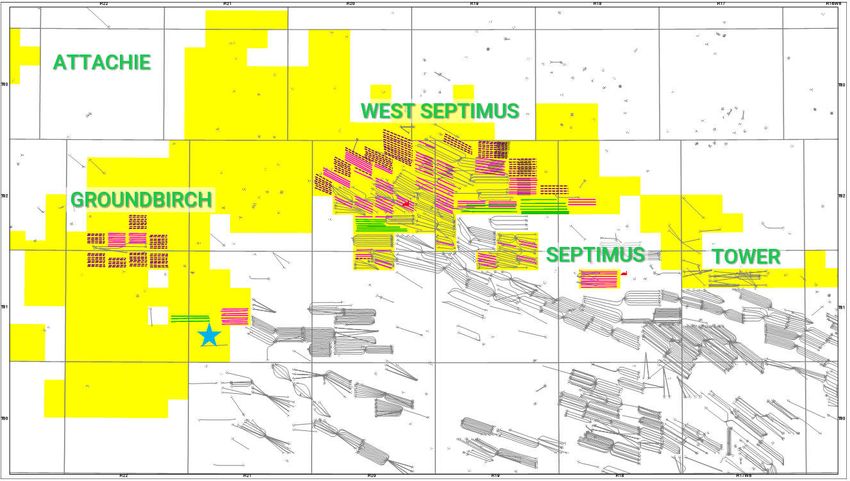
TSX: CR

WHY INVEST IN CREW?
ABOUT CREW (TSX: CR)
“A Team Working Together to Achieve a Common Goal”
Building Momentum in a Strong Natural Gas Market
Strong ESG Commitment
Significant Growth
Building a sustainable business
Estimated Production ~20% per share from 2021 to 2022
Adjusted Funds Flow1 ~55% per share from 2021 to 2022 Shareholder and Bondholder Alignment
10 of top 20 shareholders are insiders (50%)4
2022 AFF
$95 - $140 million in excess of maintenance capital (free AFF1) Distant Tax Horizon
>$1.1 billion in tax pools available to shelter expected future
Liquids Optionality
earnings from current income tax
Next 15 wells planned on production are UCR wells
Excellent Value CAPITAL STRUCTURE SNAPSHOT millions
2P reserves value net of debt – $8.22/share2 Shares issued & outstanding 156.6
Market capitalization1 @ $3.00/share $470
Ample Processing and Transportation Capacity
Capacity of 40,000 boe/d (240 mmcfe/d) Net debt as at September 30, 2021:
Senior unsecured notes due 20245 $297
World Class Montney Resource
>264,000 net acres3 Bank debt + working capital1 $107
Enterprise value1 $874
Robust Liquidity Profile
48% drawn on $150 million line of credit in Q3 2021
5 Crew Energy Inc. Corporate Presentation 1) Free AFF and AFF, Market Capitalization, Working Capital and Enterprise Value are Non-IFRS Measures. See 3) See “Advisories – Information on Reserves & Operational Information”
Reader Advisories – Non-IFRS Measures in Appendix for calculations, reconciliations and assumptions used. 4) As at December 6, 2021; Source: SEDI, IRWIN, InfoSuite.
2) Detailed calculation provided on ‘Exceptional Value’ slide. 5) Net of deferred financing costs of $3.0 million.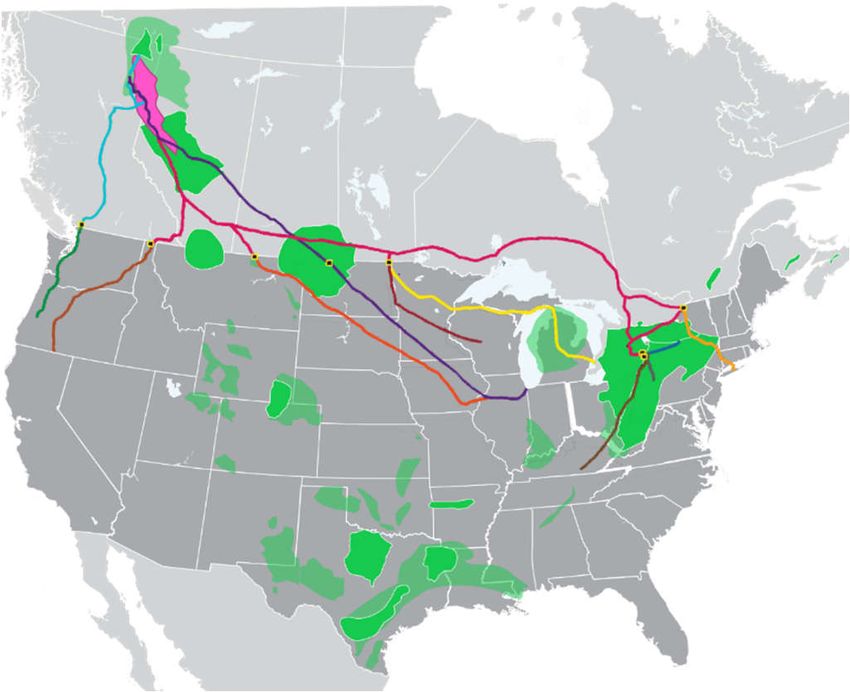
VALUE OPPORTUNITY
                                      Untapped Inherent Value Growth

                                                                                                                                                                                              Peak Value
                                      Crew Share Price (TSX:CR) and Reserves per Share1
                                                                                                                                                                                              Disconnect
                                      $25                                                                                                                                                                            1,800

                                                                                                                                                                                                                             Reserves Per Thousand Debt Adjusted Shares (Boe/mSh)
                                                                                                                                                                                                                     1,600

                                      $20
Monthly Closing Share Price ($ CAD)

                                                                                                                                                                                                                     1,400

                                                                                                                                                                                                                     1,200
                                      $15
                                                                                                                                                                                                                     1,000

                                                                                                                                                                                                                     800
                                      $10
                                                                                                                                                                                                                     600

                                                                                                                                                                                                                     400
                                       $5

                                                                                                                                                                                                                     200

                                       $0                                                                                                                                                                            -
                                          2003    2004     2005    2006     2007        2008     2009          2010         2011          2012         2013   2014     2015    2016    2017    2018    2019   2020

                                                                          Share Price               1P Reserves Per Debt Adjusted Share                              2P Reserves Per Debt Adjusted Share

                                      6     Crew Energy Inc.   Corporate Presentation      1) Per share values are debt adjusted at $3.08 per share.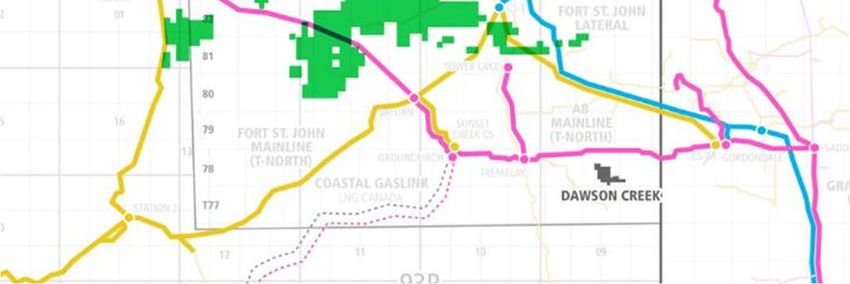
TSX: CR

STRATEGIC GROWTH PLAN
PRODUCTION GROWTH
 Increased Pace of Development to Capture Value From Stronger Commodities Futures

   Infrastructure Supports ≈100% Production Growth                                                                             Robust Two-Year Plan

                                   Target Production Growth2 2020-2022
                           34                                                              33.0
                                                                                      (198 mmcfe/d)
                                                                                                                               • Plan to match production volumes with processing and
                                                                                                                                 transportation capacity
                           32

                           30
                                        ~45%
                                           Increase from                                  31.0
                                                                                                                               • Sets the stage for Crew to increase the pace of
                                                                                                                                 development for our world-class Montney resource
Production (000’s boe/d)

                                                                                      (186 mmcfe/d)
                                            2020 to 2022
                                                                 28.0
                                                               (168 mmcfe/d)
                           28
                                                                                                                               • Ramping up production into an improved commodity price
                                                                                                                                 environment
                           26
                                                   25.5                                                                        • ~42% of 2022 gas production hedged at $3.26/mcf
                                      Q3 2021 YTD Actual
                                                                  26.0
                                                               (157 mmcfe/d)
                           24                                                                                                  • Designed to materially increase AFF1 by increasing
                                                                                                                                 production, reducing unit expenses and increasing margins
                           22
                                            22.0
                                         (132 mmcfe/d)
                                                                                                                               • Targeted to reduce leverage to between 1.3 and 1.5x last
                           20                                                                                                    twelve months’ EBITDA1 by end of 2022
                                       2020 Actual               2021 Estimate         2022 Budget4

                                                                                 1)   AFF, Net Debt, Enterprise Value and Debt Adjusted Cash Flow are Non-IFRS Measures. See Reader Advisories – Non-IFRS Measures.
                                                                                 2)   See Supplemental Information Regarding Product Types in Appendix for breakdown of production by product type.
 8                              Crew Energy Inc.   Corporate Presentation        3)   EV = Enterprise Value; DACF = Debt Adjusted Cash Flow.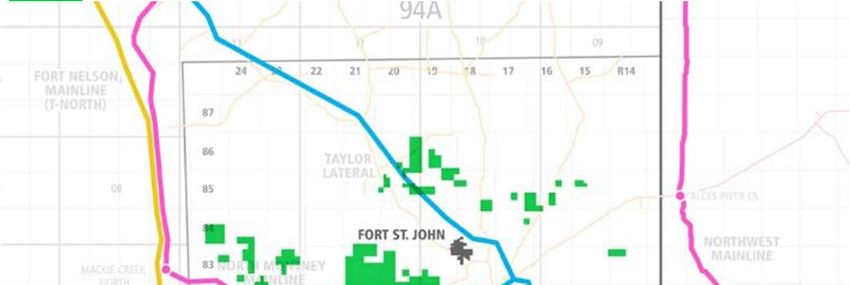
IMPROVING MARGINS
        Lowering per Unit Costs

        Steadily declining unit costs1 improve margins                                                                  Increased production into available capacity
        16
                                                                                                                        • Optimizing production and infrastructure utilization enhances
                                                                                                                          margins, increases AFF2 and drives lower debt metrics

        14
                                                                  >25%Reduction from
                                                                                                                        • Expect to reduce per unit expenses by over 25% from
                                                                                                                          2020 – 2022
                                                                       2020 to 2022
                                     $13.19        12.75
                                                                                                                             •      Operating ≈ 30%
                                   $12.70                                                                                    •      Transportation ≈ 25%
                                                        $12.25
$/boe

        12                 Q3 2021 YTD Actual

                                                   11.75                                                                     •      G&A ≈ 10%
                                                                                                                             •      Interest ≈ 30%

        10
                                                                        10.00
                                                                                                                        • Cost reductions expected to add approximately $41 million
                                                                               $9.50                                      an increase of 25% to AFF2 in 2022
                                                                         9.00

            8
                            2020 Actual          2021 Est.           2022 Est.

                                                             1)   Represents per unit costs, including operating, transportation, general and administrative and
        9       Crew Energy Inc.    Corporate Presentation        interest expenses in aggregate.
                                                             2)   “AFF“, or “Adjusted Funds Flow”, does not have a standardized meaning. See Reader Advisories –
                                                                  Non-IFRS Measures.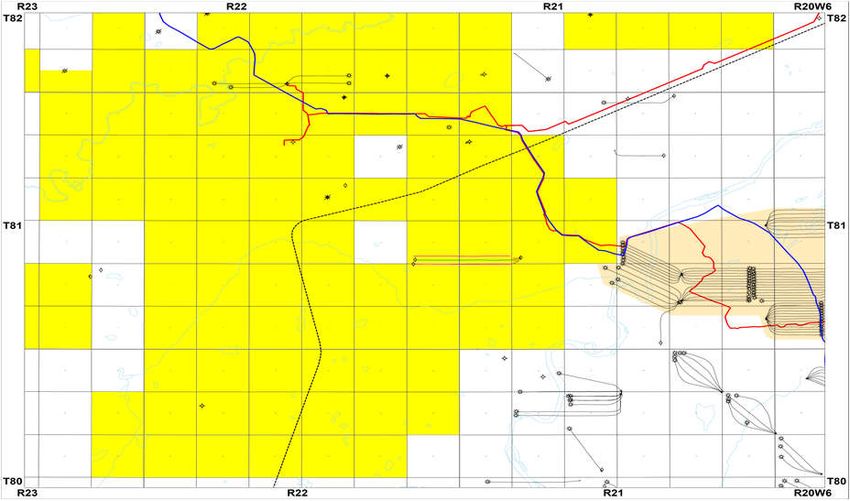
AFF GROWTH
                   Increased Pace of Development to Capture Value From Stronger Commodities Futures

                   Target AFF1 Growth 2020-2022                                                                                         Natural Gas Pricing Sensitivities2,3
                   240                                                                                                                  $460

                                                                            210
                                                                                                                                        $440
                   200                                             $200.0

                                                                                                      2021 - 2022 Combined AFF (C$MM)
                                                                                                                                        $420
                                                                                190
                                                                                                                                                                                                                 $415
                   160                                                                                                                  $400

                                                                                                                                                                                       $385
AFF ($ Millions)

                                                                          >385%
                                                             140
                                                                                                                                        $380
                   120                          $130.0       120
                                                                                                                                        $360
                                                                            Increase from
                                                                            2020 to 2022
                                                                                                                                                              $355
                                                                                                                                        $340
                    80
                                                                        2021:    $0.77 - $0.90                                          $320
                                                                                                                                               $330
                                                                                                                                                               Base Forecast
                    40          $41.2                                   2022:    $1.22 - $1.35                                          $300
                                                                          AFF per share 1,2
                                                                                                                                        $280
                        0                                                                                                                           $3.55                  $4.00                     $4.50                    $5.00
                                       2020 Actual        2021 Est.       2022 Est. 2                                                               Jul 2021 – Dec 2022 Average NYMEX Gas Price (US $/mmbtu)

                                 Target Excess Cash Flow (Free AFF1) to
                                 Reduce Debt or Increase Production in 2022                                                                        Target AFF1 in 2022

                                 $95 to $140MM                                                                                                    $190 to $210MM
                                                                                                 1)                 AFF and Free AFF are Non-IFRS Measures. See Reader Advisories – Non-IFRS Measures.
                   10       Crew Energy Inc.   Corporate Presentation                            2)                 See Reader Advisories – ‘Assumptions’ for sensitivity inputs.
                                                                                                 3)                 AFF sensitivities have been arrived at by adjusting the US $ NYMEX price and holding all other assumptions over the forecast period constant.
IMPROVED LEVERAGE METRICS
Potential Reduction in Leverage Metrics of >55% in 2 Years
Right-Sizing the Balance Sheet Steadily Improving Debt Metrics
$18,000
~ $16,500
8.0 • Goal to be:
$16,000 ~ $14,750 7.0 • Below $10,000 per flowing boe by the
$14,000 end of 2022
6.0
5.5 ~$14,000
$12,000 Q2 2021 Actual
• Debt / LTM EBITDA1 < 1x at a NYMEX
Net Debt / Flowing boe/d
~$9,500 5.0
Net Debt / LTM EBITDA
$10,000 gas price of $5.00/mmbtu by the end
4.0
$8,000 of 2022
3.5 2.7 3.0
$6,000 Q2 2021 Actual
2.5 2.0
$4,000 1.5
$2,000 1.3 1.0
$0 0.0
Q4/20 Q1/21 Q2/21 Q3/21 Q4/21 Q1/22 Q2/22 Q3/22 Q4/22
3.00 4.15 5.00
1
Net Debt / Annual Average Production Net Debt / LTM EBITDA
11 Crew Energy Inc. Corporate Presentation 1) AFF, Free AFF, EBITDA and Net Debt/LTM EBITDA are Non-IFRS Measures. See Reader Advisories – Non-IFRS Measures.SUMMARY OF 2-YEAR PLAN
Production and AFF/SH , UNIT costs and Debt
YoY% YoY%
2020 2021 Change 2022 Change
Average Production (boe/d) 21,955 26,000 - 27,000 21 31,000 – 33,000 21
Production per Share (MM) 144 170 - 175 20 200 - 213 20
Unit Costs per Boe2 ($/boe) 13.19 11.75 – 12.75 (7) 9.00 – 10.00 (22)
AFF1 ($MM) 41.2 120 - 140 216 190 - 210 54
AFF1 per Share ($/sh) 0.27 0.77 – 0.90 209 1.22 – 1.35 54
Debt to EBITDA1 5.5x 2.5x – 2.7x (53) 1.3x – 1.5x (46)
1) Non-IFRS Measure. See “Advisories - Non-IFRS Measures”.
12 Crew Energy Inc. Corporate Presentation 2) Includes operating costs, transportation costs, interest, general and administrative expensesMARKETING DIVERSIFICATION & EXPOSURE TO HIGHER PRICES
Hedging Critical to Protect Balance Sheet and Capital Investment, While Underpinning AFF2 for Next 2 Years
Advantageous Marketing Diversification3
100%
90%
2022
80%
70% 79,400 GJ/d
Percentage Allocation
60%
gas production hedged at
50% $2.67/GJ or $3.26/mcf1
40%
30%
20%
10%
0%
Q1 2022 Q2 2022 Q3 2022 Q4 2022
AECO Fixed Hedge AECO Floating Station 2 Floating ATP Floating Dawn Floating Chicago Floating
13 Crew Energy Inc. Corporate Presentation 1) Calculated using Crew’s heat content factor
2) AFF is a Non-IFRS Measure. See Reader Advisories – Non IFRS Measures.
3) Estimated market allocations are based on current forward market prices and forecasted production levels. See Reader Advisories - Assumptions.TSX: CR OPTIONALITY TO RAISE FUNDS WITH ADDITIONAL TRANSACTIONS
FINANCIAL FLEXIBILITY
Proven Track Record

History of Selling Assets at Attractive Metrics                                     2020 Infrastructure Transactions

•     Crew has sold ~$725 MM of assets and maintains optionality to                 •   Raised $70MM by selling 22% interest
      sell additional assets to further support our Montney development                 in 180 mmcfpd of processing capacity
                                                                                    •   Option to June 30, 2023 to sell 11.43%
                                                     Value   Production     Land        additional interest for $37.5MM
    Date             Area Divested                  ($mm)       (boe/d)   (acres)
    Apr 2010         Edson (Cardium)                  $126        1,700    32,000   Strong Liquidity
    Dec 2012         Kobes (Montney)                  $108         625     15,800
    May 2014         Deep Basin Gas                   $222        7,000   254,000   •   $300MM Senior Notes due in 2024
    Aug 2014         Princess                         $150        3,650   259,230   •   No financial covenants
    Sep 2015         Heavy Oil Package                 $50         225     11,670
                                                                                    •   $150MM Senior secured bank facilities, 52% undrawn
    May 2017         Goose (Montney)                   $49           0     18,400       at Sept. 30, 2021
    Mar 2018         Heavy Oil Package                 $10           0       882
    Oct 2021         Heavy Oil Package                 $10        1,050    36,507
    Total                                             $725       14,250   628,489

15      Crew Energy Inc.   Corporate Presentation
TSX: CR EXCEPTIONAL VALUE
EXCEPTIONAL VALUE
    Adding Reserves at a Low Cost

•    Reserve value of $8.22/share net of debt with no value for 225,733 acres of Montney undeveloped land
•    Montney undeveloped land can be valued at $1,000 to over $5,000 per acre or $1.44 to over $7.20 per share
•    Future prices in the first three years are 7% higher for natural gas and 25% higher for oil versus the same period in the 2020 reserve report

NET ASSET VALUE (December 31, 2020)                                                                                                        Forward Strip vs Year End Price Forecast
                                                                                                                            80.00                                                                          4.00
                                                                                 TP                TPP
                                                                                                                            70.00                                                                          3.50
                                                                  NPV10% ($M)                NPV10% ($M)
                                                                                                                            60.00                                                                          3.00

                                                                                                                                                                                                                  Aeco (Cdn/mmbtu)
                                                                                                            WTI (USD/bbl)
Reserves Value (Before Tax) 1,2                                          $862,903              $1,643,280                   50.00                                                                          2.50

Dec 31, 2020 Debt + Working Capital                                                                                         40.00                                                                          2.00
                                                                       ($357,206)              ($357,206)
Deficiency
                                                                                                                            30.00                                                                          1.50
Net Asset Value (“NAV”)                                                  $505,697              $1,286,074                   20.00                                                                          1.00

                                                                                                                            10.00                                                                          0.50
Outstanding Shares                                                         156,449               156,449
                                                                                                                               -                                                                           -
                                                                                                                                    2022            2023             2024          2025             2026
Corporate NAV / Share                                                        $3.23                $8.22
                                                                                                                                                                                                3
                                                                                                                                    Sproule 2020 Year End WTI Forecast      WTI Forward Strip
         1)   Based on Crew’s independent reserves evaluation effective December 31, 2020.                                          Sproule 2020 Year End Aeco Forecast     Aeco Forward Strip 3
         2)   See “Reader Advisories – Information on Reserves & Operational Information”
         3)   Forward Strip data as of December 3, 2021.

         .

    17   Crew Energy Inc.          Corporate Presentation
LONG TERM VALUE CREATION
Strong Capital Efficiencies
Consistent Reserves Growth1,3 Capital Efficiency Improvements
450
400
>10%
PDP Reserves CAGR
411 411 410
80
• 25% reduction in 1P F&D since 2015 to $5.55/boe
70
from 2015 to 2020 370 • 23% reduction in 2P F&D since 2015 to $4.93/boe
350 330 67
60
63 • In 2020, spent $1 to make $6 on PDP (FD&A) reserves.
1P/2P Reserves (MMboe)
PDP Reserves (MMboe)
60 60
300
261 50 Recycle ratio of 6x
250
46
202 202 40 • Average three-year FD&A cost to find 2P reserves3 of
41
200
169 173 $0.92/boe or $0.15/mcfe
153 30
150
121 • Focus on converting 1P and 2P reserves to production
20
100 with 10% CAGR in PDP reserves since 2015
10
50 • IP 365 Capital efficiency ofTSX: CR MONTNEY: WORLD CLASS RESOURCE
WORLD-CLASS RESOURCE WITH EXCELLENT MARKET ACCESS
Among North American Basins
Montney Competitive Features
Current Unconventional • Montney Formation is predictable in size and thickness
Shales and Tight Gas Plays
(>1,000 feet in thickness)
Montney
Major Montney Gas Export
Pipelines • Excellent reservoir characteristics in an over-pressured regime
= more energy
• Produces like a tight conventional reservoir = exhibits lower production
declines than unconventional reservoirs - “it’s not a shale”
• Crew production declines at 28%
• Shale production declines at >50%
• Deposited in multiple benches and can be accessed from a single pad
• Providing advantaged returns and less surface disturbance
• Generally contains natural gas liquids, enhancing returns
• Competitive royalty structure makes up for transportation expenses
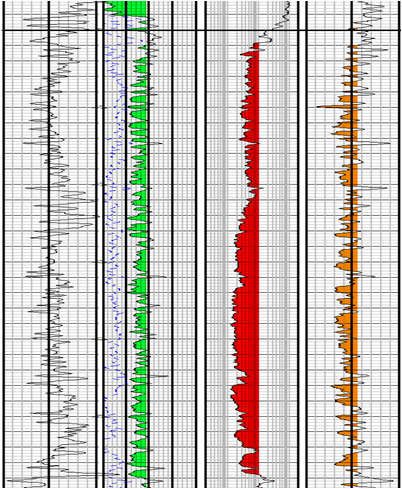
20 Crew Energy Inc. Corporate PresentationWORLD-CLASS RESOURCE BASE
Several Stratigraphic Benches for Future Drilling
2 HZ Wells 4 HZ Wells 5 HZ Wells 109 HZ Wells 87 HZ Wells 10 HZ Wells
West Portage Groundbirch Attachie West Septimus Septimus Tower Doig
Upper Montney
1 AA 3 9 24 3
2 A
67 42
7
B 2
3 23 17
Upper Montney
C 2
7
1,000 Feet
Lower Montney
3
Monias High Lower Montney
2
217 Crew HZ wells
Drilled to Q3, 2021
Developed Offsetting Intervals Belloy
• Crew recognizes four major stratigraphic units in the Upper Montney (AA, A, B, C)
• The majority of Crew horizontals (72%) have been drilled in the “B” unit
• The “Lower B” and “C” units are essentially undrilled
• The Lower Montney unit also has excellent prospectivity, particularly at Septimus, Tower and Attachie
21 Crew Energy Inc. Corporate PresentationSIGNIFICANT UPSIDE TO ADD RESERVES
19% of Land Booked in Upper Montney, 2,200 drilling locations identified1
• >2.4 TCFE of Reserves
Booked2
• 264,600 net acres of
Montney land (>225,000
net undeveloped acres)
• >2,200 Montney drilling
locations identified
• >160 mmcfe/d currently
with >240 mmcfe/d of
infrastructure capacity
2P location
1P location
Drilled 1P booked
22 Crew Energy Inc. Corporate Presentation 1) See “Drilling Locations” in Reader Advisories.
2) See “Reader Advisories – Information on Reserves & Operational Information”SEPTIMUS – A TEMPLATE FOR THE FUTURE
Provides Source of Free AFF1
Field Operating Netback1 > Capex at Septimus Septimus Gas Production
$100 $4.78 $5.00 60,000
$90
~$150 MM $4.50
$4.49 Field operating netback1
‘16 – ’20 exceeds capex2, providing 50,000
$80 funding for continued growth $4.00
$3.57
Stable forecast declines of
$3.47
$70 $3.50 ~11% annualized
40,000
$3.01
$60 $2.80 $3.00
$2.71
$2.53
(Mcf/d)
$2.37
$MM
$50 $2.50 30,000
$2.16 $2.16 $2.23
$2.37
$40 $1.76 $2.12 $2.00
20,000
$30 $1.50
$1.50
$20 $1.00
10,000
$10 $0.50
$0 $0.00 0
3
2013 2014 2015 2016 2017 2018 2019 2020 Sep-16 Sep-17 Sep-18 Sep-19 Sep-20 Sep-21
CR Realized Gas Price ($/mcf) Field Operating Netback1 Historical Production Forecast
AECO Gas Price ($/mcf) Capex2
1) Field operating netback and Free AFF are Non-IFRS measures; See Non-IFRS Measures in Reader Advisories.
2) Area focused capital with infrastructure capital excluded.
23 Crew Energy Inc. Corporate Presentation 3) Septimus 2017 capital excludes line loop for West Septimus debottlenecking.2021 – 2022 GROUNDBIRCH DEVELOPMENT
Crew 4-17 Well Performance (3 Wells Combined)
40,000
12” pipeline
4-17 to 1-31 35,000
Gas rate
30,000
Raw gas rate (mcfd)
Shell
activity
Crew Internal Type Curve
Crew 25,000
4-17 Pad
Crew Producing wells
20,000
Crew Q1/22 drilling
Crew Pipelines
TC Energy NMML Two AA wells 15,000
CN Railway Avg IP6 12mmcf/d
10,000
Crew 4-17-81-21 Pilot Well 5,000
Doig Zone 4-17 Pad
Phase 1 0
0 1 2 3 4 5 6 7 8 9 10 11 12
AA 300m
Months on Production
Upper Montney 146m
• 70,000 acres of contiguous land in the Groundbirch area
A
• Three new 4-17 wells producing to Septimus gas plant following
successful delineation of the AA & Upper B zones in the Upper Montney
B
• Phase 2 drilling planned for Q1/22, completions planned for Q3/22
• Five wells expected to test additional Upper Montney zones
C
Lower
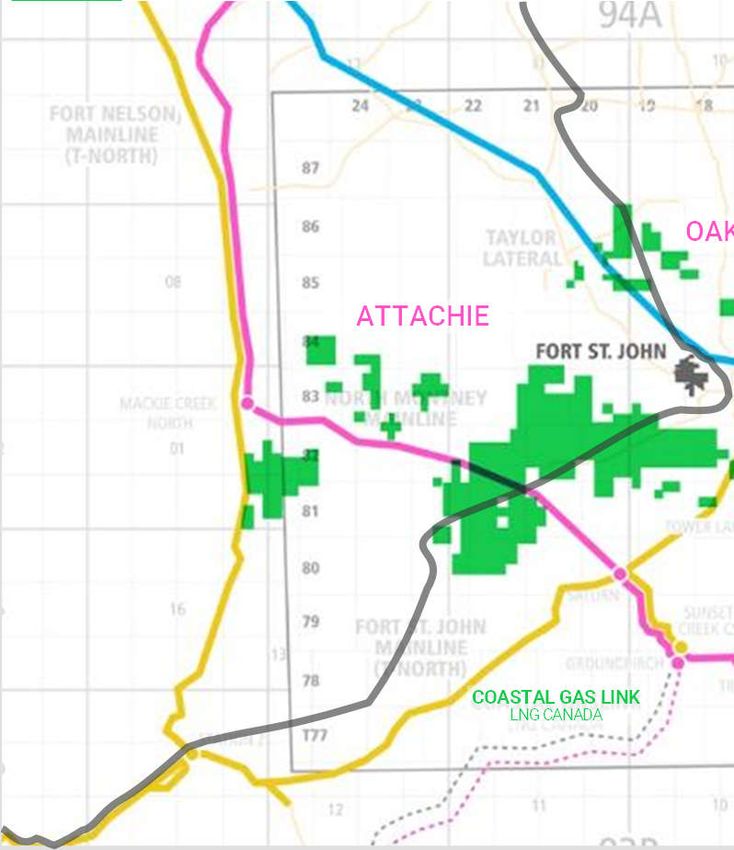
24 Crew Energy Inc. Corporate PresentationEXCELLENT MARKET ACCESS
NE BC Montney Assets are Ideally Situated with Access to Multiple Markets
Crew Montney Land
Crew Montney Land Base Features
NGTL
NGTL Proposed
• Existing access to three export
Westcoast pipelines servicing Canada and the US
Alliance
OAK/FLATROCK TC Energy Proposed TCPL
Coastal Gas Link
CN Rail Line Alliance
ATTACHIE
Enbridge
SEPTIMUS
• Proximal to Coastal Gas Link Pipeline
for potential LNG egress
TOWER
• Positioned on the CN Rail line for
potential coastal liquids egress
GROUNDBIRCH
• Access to Canada / US / LNG end
markets
COASTAL GAS LINK
LNG CANADA
Source: Desjardins
25 Crew Energy Inc. Corporate PresentationTSX: CR COMMITTED TO ESG
SUSTAINABILITY & ESG FOCUSED
Sustainable Leadership is a Priority

Environmental Performance                                                          Safety Performance                                              Strong Governance

57%       reduction 2015 to 2020                                                   1.5
                                                                                                        Workforce TRIF*

                                                                                                                                                   8.3 years
Fresh Water Used for Hydraulic Fracturing
                                                                                                                                  0.62             Average board tenure as of 20212

                                                                Injury Frequency
                                                                                   1.0

76%          reduction 2015 to 2020
Gas Plant Flaring
                                                                                                                                  2020 Peer Avg.

                                                                                                                                                   • Significant officer & director ownership

                                                                                   0.5
                                                                                                                                                   • 10% insider ownership represents 50% of
                                                                                                                                                     top 20 shareholders1
73%         reduction since 2017                                                                                                                   • Senior management are bondholders
Reportable Spills                                                                  0.0
                                                                                           2013 2014 2015 2016 2017 2018 2019 2020                 • Regular shareholder engagement
                                                                                   * TRIF means Total Recordable Incident Frequency
3-32 Pad ESG Metrics – Q1 2021                                                     * Includes employees and contractors

                          First in Canada - Spoolable surface                                                                                          Supporting local charities:
                            pipeline for produced water                            • Zero fatalities

     ~4x
     around the globe
                             ~7,333 two-way trucks removed

                             ~146,660 km of traffic saved
                                                                                   • >1,000 days with no employee OR
                                                                                         contractor lost time injuries
                                                                                   • Only two recordable injuries in 2020
                          ~329tCO2e eliminated                                           across employee and contractor workforce

27     Crew Energy Inc.     Corporate Presentation
ABOUT CREW (TSX: CR)
“A Team Working Together to Achieve a Common Goal”
Building Momentum in a Strong Natural Gas Market
Strong ESG Commitment
Significant Growth
Building a sustainable business
Estimated Production ~20% per share from 2021 to 2022
Adjusted Funds Flow1 ~55% per share from 2021 to 2022 Shareholder and Bondholder Alignment
10 of top 20 shareholders are insiders (50%)4
2022 AFF
$95 - $140 million in excess of maintenance capital (free AFF1) Distant Tax Horizon
>$1.1 billion in tax pools available to shelter expected future
Liquids Optionality
earnings from current income tax
Next 15 wells planned on production are UCR wells
Excellent Value CAPITAL STRUCTURE SNAPSHOT millions
2P reserves value net of debt – $8.22/share2 Shares issued & outstanding 156.6
Market capitalization1 @ $3.00/share $470
Ample Processing and Transportation Capacity
Capacity of 40,000 boe/d (240 mmcfe/d) Net debt as at June 30, 2021:
Senior unsecured notes due 20245 $297
World Class Montney Resource
>264,000 net acres3 Bank debt + working capital1 $76
Enterprise value1 $874
Robust Liquidity Profile
48% drawn on $150 million line of credit in Q3 2021
28 Crew Energy Inc. Corporate Presentation 1) Free AFF and AFF, Market Capitalization, Working Capital and Enterprise Value are Non-IFRS Measures. See 3) See “Advisories – Information on Reserves & Operational Information”
Reader Advisories – Non-IFRS Measures in Appendix for calculations, reconciliations and assumptions used. 4) As at December 6, 2021; Source: SEDI, IRWIN, InfoSuite.
2) Detailed calculation provided on ‘Exceptional Value’ slide. 5) Net of deferred financing costs of $3.0 million.TSX: CR THANK YOU Dale O. Shwed President & CEO John G. Leach Executive Vice President & CFO 800, 250 – 5th Street SW Calgary, Alberta T2P 0R4 crewenergy.com (403) 266-2088 investor@crewenergy.com
READER ADVISORIES
KEY DEFINED TERMS

•     BOE = Barrels of oil equivalent or BOEs1
•     AFF (Adjusted Funds Flow) ≈ Cash flow
•     Free AFF = Adjusted Funds Flow less capital expenditures

•     EBITDA = Calculated as consolidated net income before interest and financing expenses, income taxes, depletion,
      depreciation and amortization
•     Montney = Formation in the Western Canadian Sedimentary Basin in British Columbia and Alberta
•     Mcf = thousand cubic feet of natural gas
•     Mmcf = million cubic feet of natural gas
•     Mmcfe = million cubic feet equivalent of natural gas
•     Mmcfpd or mmcf/d = million cubic feet of natural gas per day
•     Mmcfe/d = million cubic feet equivalent of natural gas per day
•     Bcf = billion cubic feet of natural gas
•     Tcfe = trillion cubic feet equivalent of natural gas
1) 6 mmcf of natural gas = 1 boe

31      Crew Energy Inc.           Corporate Presentation
CAUTIONARY STATEMENT
Forward-Looking Statements
This presentation contains certain forward–looking information and incorrect. Although Crew believes that the expectations reflected in such respect thereof, involve known and unknown risks, uncertainties and other
statements within the meaning of applicable securities laws. The use of any of forward-looking statements or information are reasonable, undue reliance factors that may cause actual results or events to defer materially from those
the words "expect", "anticipate", "continue", "estimate", "may", "will", "project", should not be placed on forward-looking statements because Crew can give no anticipated in such forward-looking information or statements including,
"should", "believe", "plans", "intends" “forecast” and similar expressions are assurance that such expectations will prove to be correct. In addition to other without limitation: the continuing and uncertain impact of COVID-19; changes in
intended to identify forward-looking information or statements. In particular, factors and assumptions which may be identified herein, assumptions have commodity prices; changes in the demand for or supply of Crew's products, the
but without limiting the foregoing, this presentation contains forward-looking been made regarding, among other things: that Crew will continue to conduct early stage of development of some of the evaluated areas and zones the
information and statements pertaining to the following: the volumes and its operations in a manner consistent with past operations; results from drilling potential for variation in the quality of the Montney formation; interruptions,
estimated value of reserves; the volumes and product mix of Crew’s oil and gas and development activities consistent with past operations; the quality of the unanticipated operating results or production declines; changes in tax or
production; the ability to execute on its plan to increase annual average daily reservoirs in which Crew operates and continued performance from existing environmental laws, royalty rates; climate change regulations, or other
production by approximately 45% relative to 2020 and expand adjusted funds wells; the continued and timely development of infrastructure in areas of new regulatory matters; changes in development plans of Crew or by third party
flow by over 385% relative to 2020; as to our plan to optimize production and production; the accuracy of the estimates of Crew’s reserve volumes; certain operators of Crew's properties, increased debt levels or debt service
infrastructure utilization, enhance margins, increase AFF and reduce leverage commodity price and other cost assumptions; continued availability of debt requirements; inaccurate estimation of Crew's oil and gas reserve volumes;
metrics; forecast and target AFF and debt metrics for the years ended 2021- and equity financing and cash flow to fund Crew’s current and future plans and limited, unfavourable or a lack of access to capital markets; increased costs; a
2022 based on current assumptions; execution of Crew's strategy to calibrate expenditures; the impact of increasing competition; the general stability of the lack of adequate insurance coverage; the impact of competitors; and certain
the Company and generate Free AFF estimated between $95 and $140 million economic and political environment in which Crew operates; the general other risks detailed from time-to-time in Crew's public disclosure documents
in 2022, and AFF estimated between $190 and $210 million in 2022, based on continuance of current industry conditions; the timely receipt of any required (including, without limitation, those risks identified in this presentation and
current assumptions; our 2021 and 2022 capital budget range and associated regulatory approvals; the ability of Crew to obtain qualified staff, equipment and Crew's Annual Information Form).
drilling and completion plans and guidance; the estimated annual average services in a timely and cost efficient manner; drilling results; the ability of the The forward-looking information and statements contained in this news
production volumes in 2021 and 2022 and our ability to maintain production operator of the projects in which Crew has an interest in to operate the field in release speak only as of the date of this presentation, and Crew does not
levels throughout 2022, our expectation to increase production per share by a safe, efficient and effective manner; the ability of Crew to obtain financing on assume any obligation to publicly update or revise any of the included forward-
approximately 20% and AFF per share by approximately 55% over 2021; acceptable terms; field production rates and decline rates; the ability to replace looking statements or information, whether as a result of new information,
forecasted AFF for 2021 and 2022; commodity price expectations including and expand oil and natural gas reserves through acquisition, development and future events or otherwise, except as may be required by applicable securities
Crew’s estimates of natural gas pricing exposure; Crew's commodity risk exploration; the timing and cost of pipeline, storage and facility construction laws.
management programs and future hedging opportunities; marketing and and expansion and the ability of Crew to secure adequate product
transportation plans; estimates of processing capacity and requirements; transportation; future commodity prices; currency, exchange and interest rates; This presentation contains future-oriented financial information and financial
estimates of sales points weightings for 2022; future liquidity and financial regulatory framework regarding royalties, taxes and environmental matters in outlook information (collectively, "FOFI") about Crew's prospective capital
capacity; future results from operations and operating and leverage metrics; the jurisdictions in which Crew operates; and the ability of Crew to successfully expenditures, all of which are subject to the same assumptions, risk factors,
anticipated reductions in expenses by over 25% in 2021 and 2022; strong market its oil and natural gas products. limitations, and qualifications as set forth in the above paragraphs. The actual
capital efficiencies and enhanced returns going forward; anticipated reductions results of operations of Crew and the resulting financial results will likely vary
The internal projections, expectations, or beliefs underlying our Board approved from the amounts set forth in this press release and such variation may be
in transportation commitments and costs per unit by 25%; estimated 2021 and 2022 capital budget and associated guidance are subject to change
maintenance capital requirements; our targeted Net Debt to LTM EBITDA ratio material. Crew and its management believe that the FOFI has been prepared on
in light of the impact of the COVID-19 pandemic, and any related actions taken a reasonable basis, reflecting management's best estimates and judgments.
of approximately 1.3 to 1.5x by the end of 2022; the potential impact of by businesses and governments, ongoing results, prevailing economic
government programs associated with COVID-19; world supply and demand However, because this information is subjective and subject to numerous risks,
circumstances, commodity prices, and industry conditions and regulations. it should not be relied on as necessarily indicative of future results. Except as
projections and anticipated reductions in industry spending as a result, and Crew's financial outlook and guidance provides shareholders with relevant
long-term impact on pricing; future development, exploration, acquisition and required by applicable securities laws, Crew undertakes no obligation to update
information on management's expectations for results of operations, excluding such FOFI. FOFI contained in this presentation was made as of the date of this
disposition activities (including drilling and completion plans and associated any potential acquisitions or dispositions, for such time periods based upon the
timing and cost estimates); infrastructure investment plans; the amount and presentation and was provided for the purpose of providing further information
key assumptions outlined herein. Such information reflects internal targets about Crew's anticipated future business operations. Readers are cautioned
timing of capital projects; and anticipated improvement in our long-term used by management for the purposes of making capital investment decisions
sustainability including the expected positive attributes discussed herein that the FOFI contained in this presentation should not be used for purposes
and for internal long range planning and budget preparation. Readers are other than for which it is disclosed herein. For assumptions related to forward
attributable to our calibration strategy and all associated estimated and cautioned that events or circumstances could cause capital plans and
targeted metrics. looking information contained herein, see “Reader Advisories Assumptions”
associated results to differ materially from those predicted and Crew's
The reserve estimates provided herein are estimates only and there is no guidance for 2021, 2022 and beyond, asd may not be appropriate for other
guarantee that the estimated reserves will be recovered. purposes. Accordingly, undue reliance should not be placed on same.
In addition, forward-looking statements or information are based on a number The forward-looking information and statements included in this presentation
of material factors, expectations or assumptions of Crew which have been are not guarantees of future performance and should not be unduly relied
used to develop such statements and information but which may prove to be upon. Such information and statements, including the assumptions made in
32 Crew Energy Inc. Corporate PresentationNON-IFRS MEASURES General References are made in this presentation to use terms that are commonly used in the oil and natural gas industry, but do not have any standardized meaning as prescribed by IFRS and therefore may not be comparable with the calculations of similar measures for other entities. Management believes that the presentation of these Non‐IFRS measures provide useful information to shareholders as the measures provide increased transparency and the ability to better analyze performance. Such metrics have been included herein to provide readers with additional information to evaluate the Company’s performance, however such metrics should not be unduly relied upon. Readers are cautioned that the information provided by these metrics, or that can be derived from the metrics presented in this report should not be relied upon for investment or other purposes. See “Non-IFRS Measures” contained within Crew’s MD&A for applicable definitions, calculations, rationale for use and reconciliations to the most directly comparable measure under IFRS. The non‐IFRS measures contained in this presentation include "adjusted funds flow” or “AFF”, “free adjusted funds flow”, “EBITDA”, “net debt” and “payout”. Non-IFRS measures should not be considered in isolation or as a substitute for measures prepared in accordance with IFRS. Adjusted Funds Flow Crew uses adjusted funds flow (“AFF”) to evaluate its performance, a term that is not defined in IFRS but is commonly used in the oil and gas industry. This measure does not have any standardized meaning prescribed by IFRS, and therefore may not be comparable with the calculation of similar measures by other entities. Forecasted AFF presented herein is equivalent to cash flow provided by operating activities, which is an IFRS measure, adding the change in non- cash working capital, decommissioning obligation expenditures, excluding grants, and accretion of deferred financing costs on the senior unsecured notes. The Company considers this metric as a key measure that demonstrate the ability of the Company’s continuing operations to generate the cash flow necessary to maintain production at current levels and fund future growth through capital investment and to service and repay debt. Crew also presents AFF per share in this presentation whereby per share amounts are calculated using fully diluted shares outstanding. EBITDA EBITDA is calculated as consolidated net income (loss) before interest and financing expenses, income taxes, depletion, depreciation and amortization, adjusted for certain non-cash, extraordinary and non-recurring items primarily relating to unrealized gains and losses on financial instruments and impairment losses. Crew utilizes EBITDA as a measure of operational performance and cash flow generating capability. EBITDA impacts the level and extent of funding for capital project investments. This measure is consistent with the EBITDA formula prescribed under the Company's Credit Facility and allows Crew and others to assess its ability to fund financing expenses, net debt reductions and other obligations. Net Debt to LTM EBITDA Net Debt to LTM EBITDA is calculated as net debt at a point in time divided by EBITDA earned from that point back for the trailing twelve months. Free AFF Free AFF is calculated by taking adjusted funds flow and subtracting capital expenditures. Management believes that free adjusted funds flow provides a useful measure to determine Crew’s ability to improve sustainability and to manage the long-term value of the business. 33 Crew Energy Inc. Corporate Presentation
NON-IFRS MEASURES
Operating Netback and Field Operating Netback

Management uses certain industry benchmarks such as operating netback and field operating netback to analyze financial and operating performance. This benchmark as presented does not have any standardized meaning prescribed by
IFRS, and therefore may not be comparable with the calculation of similar measures for other entities. Operating netback equals petroleum and natural gas sales including realized gains and losses on commodity related derivative
financial instruments, marketing income, less royalties, net operating costs and transportation costs calculated on a boe basis. Management considers operating netback an important measure to evaluate its operational performance as it
demonstrates its field level profitability relative to current commodity prices. The calculation of Crew’s netbacks can be seen in the section entitled “Operating Netbacks” of Crew’s most recent year ended and quarterly MD&A.

Working Capital and Net Debt

The Company closely monitors its capital structure with a goal of maintaining a strong financial position in order to fund current operations and the future growth of the Company. Crew monitors working capital and net debt as part of its
capital structure. Working capital and net debt do not have a standardized meaning prescribed by IFRS and, therefore, may not be comparable with the calculation of similar measures for other entities.

Market Capitalization

Management considers market capitalization an important measure of the market value of Crew's equity. Market capitalization is calculated by the Company as the Company's current share price multiplied by the current number of
shares outstanding as at September 30, 2021.

Enterprise Value

Management considers enterprise value an important measure to evaluate changes to the market value of the Company. Enterprise value should not be considered as an alternative to or more meaningful than total capitalization as
determined in accordance with IFRS as an indicator of the Company's performance.

34      Crew Energy Inc.          Corporate Presentation
ASSUMPTIONS
The assumptions used throughout this presentation are provided below:

 KEY BUDGET ASSUMPTIONS                                                           2021            2022
 Capital Expenditures ($MM)                                                    150-170           70-95
 Annual Average Production (boe/d)                                      26,000 – 28,000   32,000-34,000
 AFF ($MM)                                                                     120-140         190-210
 EBITDA ($MM)                                                                  145-165         214-234
 Oil price (WTI)($US per bbl)                                                   $66.00          $65.00
 Natural gas price (AECO 5A) ($C per mcf)                                        $3.40           $3.50
 Natural gas price (NYMEX) ($US per mmbtu)                                       $3.35           $4.00
 Natural gas price (Crew est. wellhead) ($C per mcf)                             $4.60           $4.00
 Foreign exchange ($US/$CAD)                                                     $0.80           $0.78
 Royalties                                                                        5-7%            4-6%
 Net operating costs ($ per boe)                                           $4.75-$5.25      $4.25-$4.75
 Transportation ($ per boe)                                                $3.50-$4.00      $2.25-$2.75
 G&A ($ per boe)                                                           $0.90-$1.10      $0.80-$1.00
 Interest rate – bank debt                                                        6.0%            6.0%
 Interest rate – high yield                                                       6.5%            6.5%

1   Reflects a pricing premium given Crew’s higher heat content gas

35       Crew Energy Inc.         Corporate Presentation
2022 SENSITIVITIES                                AFF ($MM)                           AFF/Share                                     FD AFF/Share

 100 bbl per day Condensate1                         $2.8                                  $0.02                                            $0.02

 C$1.00 per bbl WTI                                  $1.3                                  $0.01                                            $0.01

 US $0.10 NYMEX (per mmbtu)                          $1.1                                  $0.01                                            $0.01

 1 mmcf per day natural gas                          $1.5                                  $0.01                                            $0.01

 $0.10 AECO 5A (per GJ)                              $2.4                                  $0.02                                            $0.02

 $0.01 FX CAD/US                                     $1.8                                  $0.01                                            $0.01

                                                               1) Condensate is defined as a mixture of pentanes and heavier hydrocarbons recovered as a liquid at the inlet of a gas processing plant before the gas is processed
36   Crew Energy Inc.     Corporate Presentation               and pentanes and heavier hydrocarbons obtained from the processing of raw natural gas.
INFORMATION ON RESERVES & OPERATIONAL INFORMATION
General - All amounts in this presentation are stated in Canadian dollars unless otherwise specified. Throughout this presentation, the terms Boe (barrels of oil equivalent), Mmboe (millions of barrels of oil equivalent), and Tcfe (trillion
cubic feet of gas equivalent) are used. Such terms when used in isolation, may be misleading. In accordance with Canadian practice, production volumes and revenues are reported on a company gross basis, before deduction of Crown
and other royalties and without including any royalty interest, unless otherwise stated. Unless otherwise specified, all reserves volumes in this presentation (and all information derived therefrom) are based on "company gross reserves"
using forecast prices and costs. Our oil and gas reserves statement for the year-ended December 31, 2020 includes complete disclosure of our oil and gas reserves and other oil and gas information in accordance with NI 51-101 (the
"Sproule Report"), and is contained within our Annual Information Form available on our SEDAR profile at www.sedar.com. The recovery and reserve estimates contained herein are estimates only and there is no guarantee that the
estimated reserves will be recovered. In relation to the disclosure of estimates for individual properties, such estimates may not reflect the same confidence level as estimates of reserves and future net revenue for all properties, due to the
effects of aggregation. The Company's belief that it will establish additional reserves over time with conversion of probable undeveloped reserves into proved reserves is a forward-looking statement and is based on certain assumptions
and is subject to certain risks, as discussed previously under the heading "Forward-Looking Statements". The information contained in this corporate presentation does not purport to be all-inclusive or to contain all information that a
prospective investor may require. Prospective investors are encouraged to conduct their own analysis and reviews of Crew and of the information contained in this corporate presentation. Without limitation, prospective investors should
consider the advice of their financial, legal, accounting, tax and other advisors and such other factors they consider appropriate in investigating and analyzing Crew.
Reserves are estimated remaining quantities of oil and natural gas and related substances anticipated to be recoverable from known accumulations, as of a given date, based on the analysis of drilling, geological, geophysical and
engineering data; the use of established technology; and specified economic conditions, which are generally accepted as being reasonable. Reserves are classified according to the degree of certainty associated with the estimates as
follows:
• Proved Reserves are those reserves that can be estimated with a high degree of certainty to be recoverable. It is likely that the actual remaining quantities recovered will exceed the estimated proved reserves.
• Probable Reserves are those additional reserves that are less certain to be recovered than proved reserves. It is equally likely that the actual remaining quantities recovered will be greater or less than the sum of the estimated proved
plus probable reserves.
Oil & Gas Metrics - This presentation may contain metrics commonly used in the oil and natural gas industry, such as “NPV10” and “IRR”. These terms do not have standardized meanings or standardized methods of calculation and
therefore may not be comparable to similar measures presented by other companies, and therefore should not be used to make such comparisons. Management uses oil and gas metrics for its own performance measurements and to
provide shareholders with measures to compare Crew's operations over time. Readers are cautioned that the information provided by these metrics, or that can be derived from the metrics presented in this presentation, should not be
unduly relied upon. The following oil and gas metrics have the following meanings as used in this presentation:
• IRR – Defined as the discount rate that sets the net present value of an investment equal to zero.
• NPV10 – Defined as the net present value of the future net revenues expected to accrue in such reserves during the remaining expected economic lives of such reserves, discounted at 10% per annum. It should not be assumed that the
net present value of the estimated future net revenues of the reserves of Crew included in this presentation represent the fair market value of the reserves. There is no assurance that the forecast prices and cost assumptions will be
attained and variances could be material.
37 Crew Energy Inc. Corporate PresentationINFORMATION ON RESERVES & OPERATIONAL INFORMATION
Type Curves/Wells - The Septimus, West Septimus and 9-5 Pad type curves referenced herein reflect the average per well proved plus probable undeveloped raw gas assignments (EUR) for Crew's area of operations, as derived from the
Company's year end independent reserve evaluations prepared in accordance with the definitions and standards contained in the COGE Handbook. Unless otherwise stated, the type wells are based upon all Crew producing wells in the
area as well as non-Crew wells determined by the independent evaluator to be analogous for purposes of the reserve assignments. Internal Forecast curves referenced herein reflect the estimated average per well proved plus probable
undeveloped raw gas assignments (EUR) for the associated wells, as derived from internal forecasts prepared by a qualified reserves evaluator, and incorporate the most recent data from actual well results and would only be
representative of the specific drilled locations; such a type curve does not reflect the type curves used by our independent qualified reserves evaluator in estimating our reserves volumes. There is no guarantee that Crew will achieve the
estimated or similar results derived therefrom. In each case the type curve presented is that which Management feels best represents the expected average drilling results based upon Crew producing wells in the area as well as non-Crew
wells determined by Management to be analogous for the purpose of the type curve assignments. There is no guarantee that Crew will achieve the estimates or similar results and therefore undue reliance should not be placed on them.
Such information has been prepared by Management, where noted, for purposes of making capital investment decisions and for internal budget preparation only.
Estimated Well Economics - In this presentation, Crew has included estimated well economics for selected types of wells in its key areas. These estimates have been provided for illustrative purposes and are useful in understanding
management’s assumptions of well performance and costs in making investment decisions in relation to future drilling and for assessing the performance of future wells. However, there is no certainty that such results will be achieved or
that Crew will be able to achieve the economics, productions rates and estimated ultimate recoverable volumes assumed in the well economics described in this presentation. The estimated well economics included in this presentation are
based on expected type curves that were constructed by completing appropriate reservoir and statistical analyses of analogous wells in analogous areas over the past 12 to 24 months that are most representative of the reservoirs being
developed and the completion methods to be utilized by Crew over the next 12 to 60 months of drilling. The reserves associated with these type curves and associated estimated ultimate recoverable volumes are proved plus probable
reserves estimates. The reservoir engineering and statistical analysis methods utilized is broad and can include various methods of technical decline analyses and reservoir simulation, all of which are generally prescribed and accepted by
the Canadian Oil and Gas Evaluation Handbook and widely accepted reservoir engineering practices. These type curves were generated internally and validated by our internal qualified reserves evaluator. Such type curves do not
necessarily reflect the type curves used by our independent qualified reserves evaluator in estimating our reserves volumes. The type curves used by Sproule for Crew’s most recent independent reserves evaluation as of December 31,
2020 may have different estimated ultimate recovery than the type curves upon which the economics presented herein are based; however, this is expected as Sproule’s estimates are primarily based on only historical results whereas
Crew’s internal type curves utilize historical and analogous information to provide an estimate of productivity and reserves in the future.
Test Results and Initial Production Rates - A pressure transient analysis or well-test interpretation has not been carried out and thus certain of the test results provided herein should be considered to be preliminary until such analysis or
interpretation has been completed. Test results and initial production (“IP”) rates disclosed herein, particularly those of short duration may not necessarily be indicative of long term performance or of ultimate recovery. Initial Production
("IP") rates indicate the average daily production over the indicated daily period.
38 Crew Energy Inc. Corporate PresentationINFORMATION ON RESERVES & OPERATIONAL INFORMATION
Analogous Information - Certain information in this document may constitute "analogous information" as defined in National Instrument 51-101 - Standards of Disclosure for Oil and Gas Activities ("NI-51-101"), including but not limited to,
information relating to the areas in geographical proximity to lands that are or may be held by Crew. Such information has been obtained from government sources, regulatory agencies or other industry participants. Crew believes the
information is relevant as it helps to define the reservoir characteristics in which Crew may hold an interest. Crew is unable to confirm that the analogous information was prepared by a qualified reserves evaluator or auditor. Such
information is not an estimate of the reserves or resources attributable to lands held or potentially to be held by Crew and there is no certainty that the reservoir data and economics information for the lands held or potentially to be held by
Crew will be similar to the information presented herein. The reader is cautioned that the data relied upon by Crew may be in error and/or may not be analogous to such lands to be held by Crew
Drilling Locations - This presentation discloses “ERH Undeveloped 2P Locations" in the Company's Greater Septimus area of operations and “Montney Drilling Opportunities” which are comprised of: (i) proved locations; (ii) probable
locations; and (iii) unbooked locations. Proved locations and probable locations are derived from the Sproule Report and account for drilling inventory that have associated proved and/or probable reserves assigned by Sproule. Unbooked
locations are internally identified potential drilling opportunities based on the Company's prospective acreage and an assumption as to the number of wells that can be drilled per section based on industry practice and internal review.
Unbooked locations do not have reserves or resources attributed to them and are not estimates of drilling locations which have been evaluated by a qualified reserves evaluator performed in accordance with the COGE Handbook. There is
no certainty that the Company will drill any of these potential drilling opportunities and if drilled there is no certainty that such locations will result in additional oil and gas reserves, resources or production. The drilling locations on which
we actually drill wells will ultimately depend upon the availability of capital, regulatory approvals, seasonal restrictions, oil and natural gas prices, costs, actual drilling results, additional reservoir information that is obtained and other
factors.
The following table provides a detailed breakdown of current Crew gross potential drilling opportunities presented herein:
Identified Drilling Opportunities
Total Drilling Locations Proved Locations Probable Locations Unbooked Locations
Montney Total Drilling Locations 2,240 168 169 1,903
West Septimus ERH Undeveloped 2P Locations 49 20 29 0
BOE equivalent - Barrel of oil equivalents or BOEs may be misleading, particularly if used in isolation. A BOE conversion ratio of 6 mcf: 1 bbl is based on an energy equivalency conversion method primarily applicable at the burner tip and
does not represent a value equivalency at the wellhead. Given that the value ratio based on the current price of crude oil as compared to natural gas is significantly different than the energy equivalency of 6:1, utilizing a 6:1 conversion
basis may be misleading as an indication of value.
39 Crew Energy Inc. Corporate PresentationINFORMATION ON RESERVES & OPERATIONAL INFORMATION
Supplemental Information Regarding Product Types - References to gas or natural gas and NGLs in this presentation refer to conventional natural gas and natural gas liquids product types, respectively, as defined in National Instrument
51-101, Standards of Disclosure for Oil and Gas Activities ("NI 51-101"), except where specifically noted otherwise. This presentation includes references to forecast and target average daily production volumes for 2021 and 2022. The
following is intended to provide the product type composition for each of the production figures provided herein, where not already disclosed within tables above:
Target Production Volume Breakdown
Crude Oil1 Natural gas liquids3 Condensate Conventional Natural Gas Total Range (boe/d)
2020 Annual Average 1,549 bbl/d 2,070 bbl/d 2,583 bbl/d 94,519 mcf/d 21,995
2021 Q3 YTD Average 1,230 bbl/d 2,442 bbl/d 2,691 bbl/d 115, 016 mcf/d 25,532
2021 Annual Average 5% 10% 10% 75% 26,000-28,000
2022 Annual Average 0% 9% 11% 80% 31,000-33,000
Notes:
1 Crude oil is comprised primarily of Heavy crude oil, with an immaterial portion of Light and Medium crude oil.
2 With respect to forward looking production guidance, given the potential for variability in actual product type results, the issuer approximates percentages for budget planning purposes based on management's reasonable assumptions including, without limitation,
historical well results.
3 Excludes condensate volumes which have been reported separately.
40 Crew Energy Inc. Corporate PresentationINFORMATION ON RESERVES & OPERATIONAL INFORMATION
Supplemental Information Regarding Corporate Reserves1,2,5 Supplemental Information Regarding Capital Program Efficiency
Light Crude Including FDC 2020 2018-2020 Avg.
Oil and Barrels of PDP 1P 2P PDP 1P 2P
Medium Heavy Crude Natural Gas Conventional oil Exploration and Development
Crude Oil Oil Liquids Natural Gas3 equivalent4 Expenditures1
(mbbl) (mbbl) (mbbl) (mmcf) (mboe) ($ thousands) 86,260 86,260 86,260 303,573 303,573 303,573
Proved Acquisitions/(Dispositions)1
261 808 13,806 313,475 67,120 ($ thousands) (58,150) (58,150) (58,150) (87,039) (87,039) (87,039)
Developed Producing
Change in Future Development Capital1
Developed Non-producing 10 633 283 7,035 2,099
($ thousands)
Undeveloped 3,222 1,791 27,202 606,328 133,269
- Exploration and Development (4,100) (94,579) (179,332) 3,072 21,181 (156,294)
Total Proved 3,493 3,232 41,291 926,838 202,488 - Acquisitions/Dispositions 0 0 (525) 0 (50) (575)
Total Probable 3,484 3,071 45,064 935,232 207,490 Reserves Additions with Revisions and
Total Proved plus Probable 6,977 6,302 86,354 1,862,069 409,978 Economic Factors (mboe)
- Exploration and Development 12,033 8,592 7,594 32,172 58,318 65,114
1 Reserves have been presented on a “gross” basis which is defined as Crew’s working interest (operating and non-operating) share before - Acquisitions/Dispositions 0 (50) (154) 0 (117) (254)
deduction of royalties and without including any royalty interest of the Company. 12,033 8,542 7,440 32,172 58,201 64,860
2 Based on Sproule’s December 31, 2020 escalated price forecast.
3 Reflects 100% Conventional Natural Gas by product type.
4 Oil equivalent amounts have been calculated using a conversion rate of six thousand cubic feet of natural gas to one barrel of oil.
5
Including FDC 2020 2018-2020 Avg.
Columns may not add due to rounding.
PDP 1P 2P PDP 1P 2P
Finding & Development Costs2,3
($ per boe) 6.83 (0.97) (12.26) 9.53 5.57 2.26
Supplemental Information Regarding Reserves Values1,2,3,4 - with revisions and economic factors
Finding, Development & Acquisition Costs2,3
(m$) 0% 5% 10% 15% 20% ($ per boe) 2.00 (7.78) (20.40) 6.83 4.08 0.92
Proved - with revisions and economic factors
Developed Producing 630,840 491,026 397,521 335,513 292,261 Recycle Ratio3 (F&D) 1.77 (12.48) (0.99)
Developed Non-producing 22,168 16,169 12,760 10,570 9,028 Reserves Replacement4,3 150% 106% 93%
Undeveloped 1,524,984 794,096 452,622 273,132 169,004
1 The aggregate of the exploration and development costs incurred in the most recent financial year and the change during that year in estimated future
Total Proved 2,177,992 1,301,291 862,903 619,216 470,293
development capital generally will not reflect total finding and development costs related to reserve additions for that year.
Total Probable 3,373,888 1,470,649 780,378 470,395 309,922
2 F&D and FD&A costs above are calculated including changes in FDC required to bring proved undeveloped and developed reserves into production, by
Total Proved plus Probable 5,551,880 2,771,941 1,643,280 1,089,611 780,215
dividing the identified capital expenditures by the applicable reserves additions.
3 Recycle ratio is defined as operating netback per boe divided by F&D costs on a per boe basis. Operating netback is a Non-IFRS Measure and is
1 Based on Sproule’s December 31, 2020 escalated price forecast
calculated as revenue (including realized hedging gains and losses) minus royalties, operating expenses, and transportation expenses. Crew’s operating
2The estimated future net revenues are stated prior to provision for interest, debt service charges, general administrative expenses, the impact netback in fourth quarter 2020, used in the above calculations, averaged $12.08 per boe, while the Company’s full year 2020 operating netback averaged
of hedging activities, and after deduction of royalties, operating costs, ARC associated with the Company’s assets and estimated future capital $9.03 per boe. These amounts are estimates and subject to audit verification.
expenditures. 4 “Reserves Replacement”, “FD&A Cost”, “F&D Cost”, “Operating Netback” and “Recycle Ratio” are Non-IFRS Measures. See Reader Advisories – Non IFRS
3 The after-tax present values of future net revenue attributed to Crew’s reserves are included in the Company’s 2020 AIF. Measures.
4 Columns may not add due to rounding.
41 Crew Energy Inc. Corporate PresentationYou can also read