The Boeing Company - Student Managed Fund 2015 2016 Equity Report Written by: Brian Wilczynski, Yijun Li, Anthony Mancini
←
→
Page content transcription
If your browser does not render page correctly, please read the page content below
The Boeing Company Student Managed Fund 20152016 Equity Report Written by: Brian Wilczynski, Yijun Li, Anthony Mancini
1

Company Information

Company Name: Boeing Co.
Ticker: BA
Sector: Industrials
CEO: Dennis A Muilenburg, at Boeing since 1985
CFO: Greg Smith, at Boeing since 2008

Current Price: $131.16
Target Price: $168.63
Margin of Safety: 29%
Recommendation: BUY

Market Cap: $85.9B
52 Week H/L: $154.09/$102.10
Dividend Yield:2.77%
P/E Ratio:14.28
FCF Yield:7.74%
Beta: 1.05

5 Year Normalized Stock Performance vs S&P 500:
2
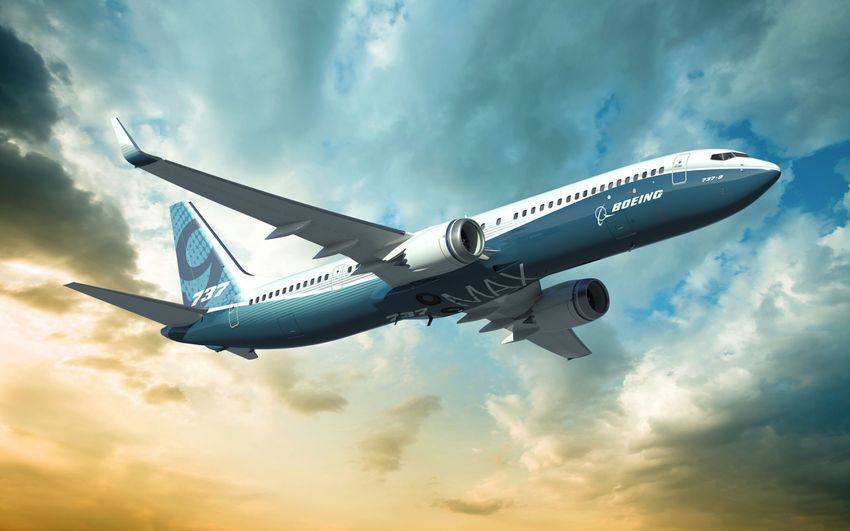
Business Model: How Does Boeing Make Money?
Boeing designs and assembles airplanes for airline companies and governments. They service all
of the major players in the US Airline industry such as Southwest Airlines, American Airlines,
United Airlines, and Delta Airlines. In addition, the firm offers aircraft modifications, spare parts,
and technical consulting.
They also make defense systems, satellites, and military aircraft for the United States (primarily
NASA and the US Air Force) as well as foreign governments.
The company also provides financing services for their clients through Boeing Capital
Corporation.
Company Segments:
1. Commercial Airlines: develops/manufactures commercial airplanes.
2. Boeing Defense, Space, and Security: researches/develops military aircraft, information
systems, and space systems.
3. Boeing Capital Corporation: provides financing and leasing services to Boeing’s clients.
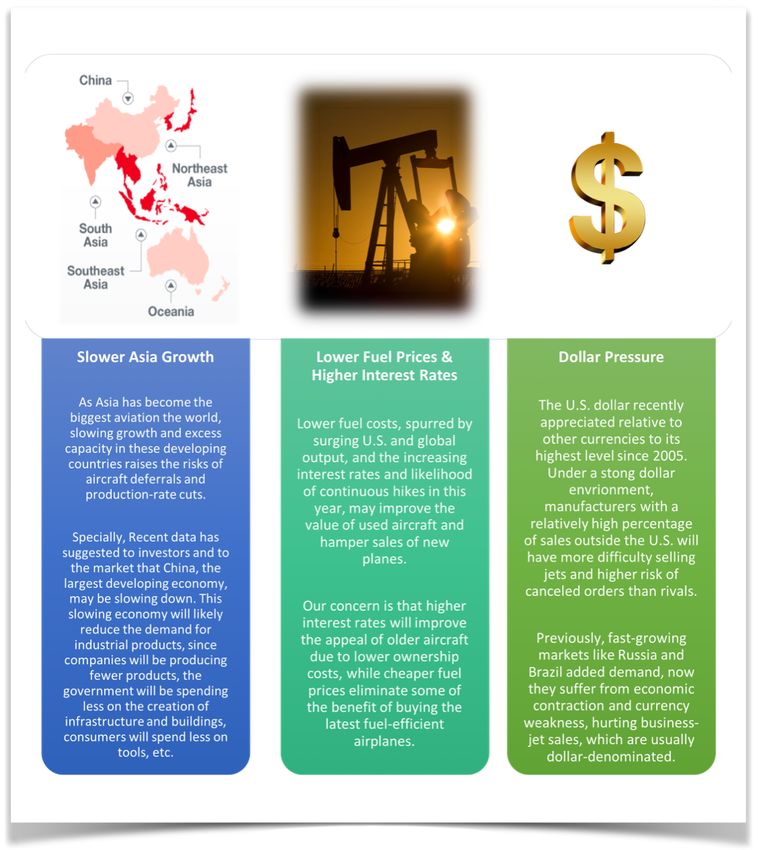
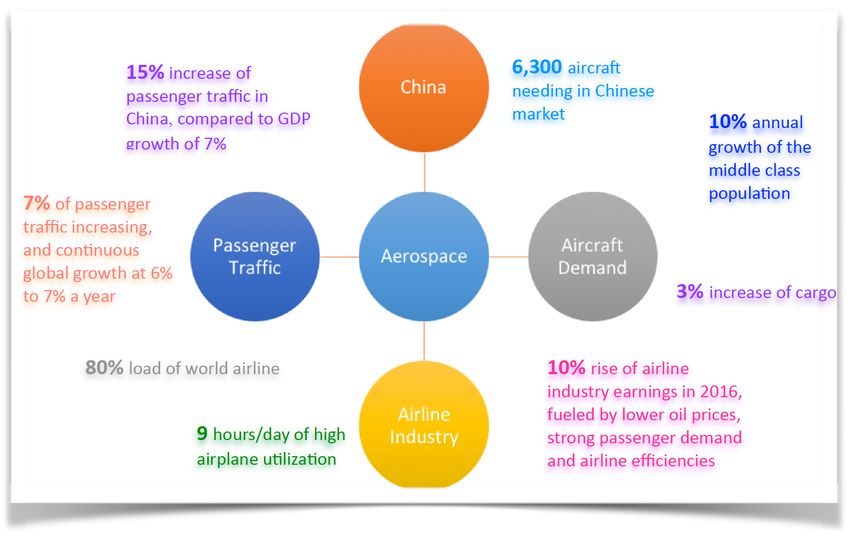
Why Will Boeing Continue to Make Money?
Boeing has a strong market share (approximately 44%) in a growing industry. Global air traffic is
expected to grow by 5% annually over the next 20 years, and Boeing forecasts that there will be
about 35,000 aircraft deliveries over that time, compared to about 19,000 over the past 20 years.
In China, one of Boeing's most important growth opportunities, the global air traffic grew
at about 15% last year, despite the wellpublicized slowdown of the Chinese economy.
About 12% of Boeing’s revenue comes from China.
The company estimates that the size of the airline industry in Southeast Asia is
approximately $550B over the next 20 years.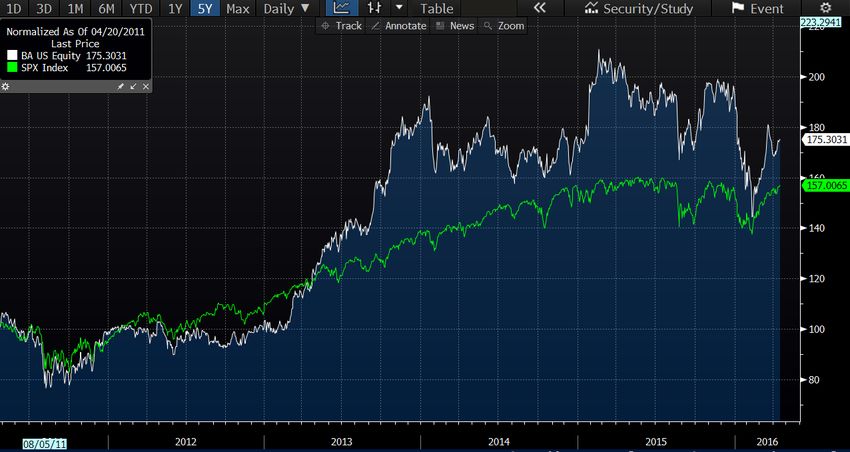
3
In Boeing’s most recent earnings report, the company noted that, despite the slow recovery
of the air cargo market, there will be about 240 large freight airlines that will need to be
replaced starting in 2019.
Boeing’s backlog currently contains about 5,800 airplane orders, which represents about 7
years of production.
The recent reinstatement of the Export Import Bank also helps Boeing to sell its products to
emerging market buyers. The ExportImport Bank is responsible for insuring foreign purchases of
US goods; helping to absorb credit risk from Boeing Capital Corporation.
Industry Outlook
The Industrials sector contains a
broad spectrum of companies that
produce goods or provide services to
both consumers and business for
mainly industrial use. The whole
sector currently holds a weight of
10.11% (or about $1.91 trillion in
market cap) of the S&P 500. Among
its subindustries, Aerospace &
Defense is the largest representing
more than 25% of the sector’s market
value of which Boeing is
positioned.
Today, passengers have access to a wider range of destinations. Rapidly evolving aviation services
in emerging regions are broadening the geographical balance of airplane demand, spurring a
worldwide requirement for 38,050 new jet airplanes, valued at $5.6 trillion. We continue to see a
generally healthy commercial airplane marketplace driven by improving airline profitability, solid
passenger traffic growth, and meaningful replacement. Boeing as one of the big players has
benefited and delivered more and more commercial aircraft. Its backlog is massive at 5,800 planes
valued at $432 billion. Additional bookings should also be on the horizon, thanks to a number of
airlines being on better financial footing due to reduced fuel prices and vigorous demand for
flights. Against this backdrop, more carriers will probably look to replace their aging fleets with
new Boeing aircraft.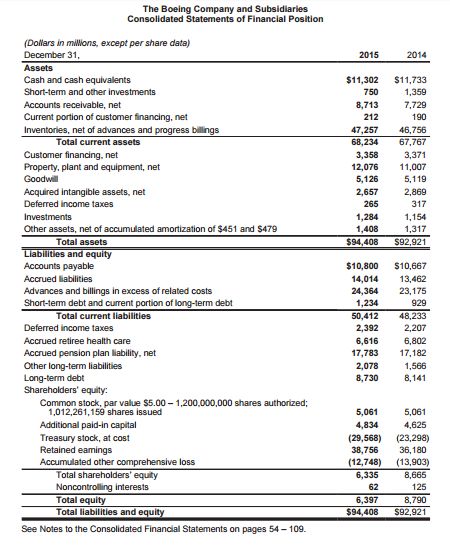
4 Looking ahead, we are bullish in regard to industry’s prospects. In general, global GDP is forecast to increase 2.7% in 2016, a healthy level for the industry. The biggest factor that will likely come into play in determining the performance of industrials in the upcoming years will be global growth. Efforts in technology services and expansion are required of companies that continue to dominate the middle ground. To control midfield, Boeing has begun introduction of new automation technology on the 777 production line and make sure they have the right plan related to engine technology. Meanwhile, the reauthorization of the U.S. ExportImport Bank restores competitive balance in international trade and enables American exporters to compete on a level playing field in tough global markets.
5

Competitive Advantage: Why is Boeing Superior to the Competition?

From a product specification perspective, we compared Boeing’s 787 Dreamliner against the
Airbus A380; the companies’ major intercontinental aircrafts.The major factors we compared were:

       As you can see, the Boeing 787 has superior fuel efficiency and engine power per unit of
       weight than the Airbus A380. Despite being significantly cheaper, the 787 also has
       comparable Max Cruise Altitude, Range, and Cruise Speed. Without comparing every
       model offered by the companies, this comparison signals to us that Boeing creates quality
       products that can compete with any other company.

In addition, the company has very strong relationships with its supply chain as well as its
competition. They partners with companies such as Lockheed Martin in the US Space Alliance as
well as Northrop Grumman in various joint missile programs. They also work with international
suppliers such as Mitsubishi and Kawasaki; helping them to penetrate foreign markets.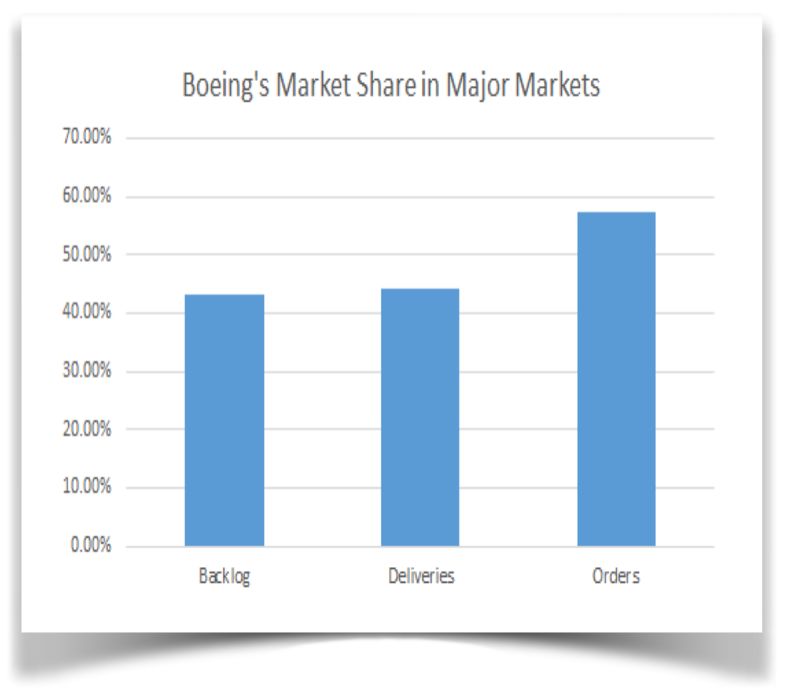
6

Risk Factors:
7

Company Financials

Strong Growth since 2005 in:
Revenue:

Net Income:
8 Profitability Figures: Operating Margin:7.74% Net Income Margin:5.39% Return on Assets:6.82% Return on Equity: 85.20% Return on Invested Capital: 33.51% Balance Sheet Figures: Current Ratio:1.35 Net Debt/EBITDA: .23 Debt/Enterprise Value: .11 Dividends: Dividend Yield: 2.77% December 2015: Board of Directors approved a 20% increase in dividend/share Share Buybacks December 2015: Board of Directors approved a new $14B share buyback over the next 23 Years Industry Financials As you can see, Boeing is priced attractively with respect to earnings in its industry, in addition to having a superior Free Cash Flow Yield and Dividend Yield. Its Return on Equity and Return on Assets are superior to the industry, and they have a strong balance sheet indicated by their current ratio and Net Debt/EBITDA.
9

Valuation
10
Our valuation of Boeing was derived using the industry standard Discounted Cash Flow method.
This method was implemented by looking at historical Free Cash Flows, making reasonable
assumptions of how they would grow into perpetuity, and then discounting all of these future cash
flows into the present.
The above Discounted Cash Flow model required two main assumptions: discount rate and growth
rate. The discount rate we used was 10%. It is generally the case that in the longrun, the WACC
for most companies is 10%. Furthermore, Boeing’s current WACC was far below 10%, largely
due to low interest rate environments. Thus, the 10% WACC assumption is both conservative and
appropriate.
Our short term growth rate assumptions came from our positive outlook of both the airline
industry and Boeing’s competitive advantages. The airline industry, in terms of air traffic is
expected to grow by 5% annually over the next 20 years, and commercial jet orders are expected to
increase rapidly, as noted above. There are also numerous emerging markets for commercial planes
such as in China and Southeast Asia. This combined with Boeing strong backlog and product
specifications give us confidence that Boeing will be able to grow earnings at a fairly consistent
compound annual growth rate of about 6.22% over the next 10 years, and at 3% in perpetuity.
After calculating the present value of Boeing’s cash flows, we subtracted Net Debt from the value
of the firm, and divided by the number of shares outstanding to estimate an intrinsic value of
$168.63 per share.
References:
Value Line Investment Survey (2014, March). Boeing Stock Report. Retrieved from
http://www.valueline.com/
Bloomberg L.P. (2015, January 25). Widebody Challenges in 2016. BI Analyst Briefing. Retrieved
from Bloomberg database.
Richard Y, (2016, January 1). The Orange Book CEO Economic Comments From Earnings
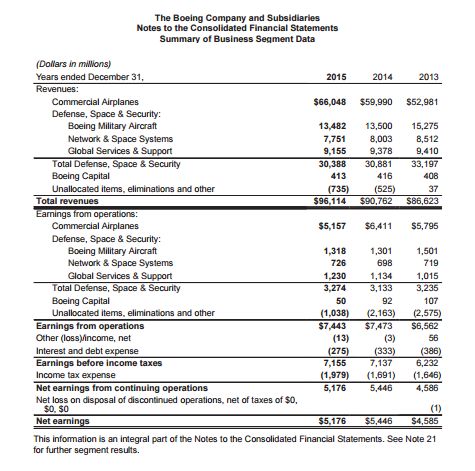
Statements. Bloomberg L.P. Retrieved from Bloomberg database.11 Appendix Consolidated Financial Statements (Annual Report 2015)
12
You can also read