THE BRITE-SONG OF ALDEBARAN - STELLAR MUSIC IN THREE VOICES - Universität Wien
←
→
Page content transcription
If your browser does not render page correctly, please read the page content below
Stars and their variability observed from space
C. Neiner, W. W. Weiss, D. Baade, R. E. Griffin, C. C. Lovekin, A. F. J. Moffat (eds)

        THE BRITE-SONG OF ALDEBARAN – STELLAR MUSIC IN THREE VOICES

     P. G. Beck1,2, 3 , R. Kuschnig 4 , G. Houdek 5 , T. Kallinger 6 , W. W. Weiss6 , P. L. Palle2,3 , F.
    Grundahl5 , A. Hatzes 7 , H. Parviainen2,3 , C. Allende Prieto2,3 , H. J. Deeg2,3 , A. Jiménez2,3 , S.
    Mathur2,3 , R. A. Garcia 8 , T. R. White5 , 9 , T. R. Bedding9,5 , D. H. Grossmann1 , S. Janisch1 , T.
              Zaqarashvili1 , A. Hanslmeier1 , K. Zwintz 10 and the BRITE & SONG teams

        Abstract.       Solar-like oscillations in red-giant stars are now commonly detected in thousands of stars
        with space telescopes such as Kepler. Parallel radial-velocity and photometric measurements would help us
        understand better the physics governing the amplitudes of solar-like oscillators, but most stars targetted for
        space photometry are too faint for light-demanding ground-based spectroscopy. The BRITE-Constellation
        provides a unique opportunity of monitoring in two colours the flux variations of bright luminous red giants.
        Those stars are also bright enough to be monitored with high-resolution spectrographs on small telescopes,
        such as the SONG Network. This contribution provided a first overview of our comprehensive, multi-year
        campaign to use both BRITE and SONG to characterize Aldebaran (one of the brightest red giants in the
        sky) seismically. Because luminous red giants can be seen at large distances, when characterized well they
        will serve as valuable benchmark stars for Galactic archeology.

        Keywords:    stars: pulsation, evolution, individual: Aldebaran

1    Introduction

Space missions such as NASA’s Kepler or TESS (Borucki et al. 2010; Ricker et al. 2015, respectively) have
enabled the detection of solar-like oscillations in tens of thousands of main-sequence and red-giant stars (e.g.
Hon et al. 2018; Garcı́a & Ballot 2019; SilvaAguirre et al. 2019). While such satellites can provide ultra-precise
monochromatic photometry, typical target stars are too faint for light-demanding ground-based complementary
techniques. Simultaneous multi-colour photometry and parallel radial-velocity (RV) monitoring of solar-like
oscillating stars would provide crucial information for understanding the physics governing the oscillations and
their amplitudes. So far, the only solar-like oscillators for which such simultaneous data have been acquired
and analysed are the Sun itself (Jiménez et al. 1999) and the mid-F sub-giant Procyon (Arentoft et al. 2008).
    The 3-cm telescopes of the five BRITE-Constellation satellites (BRIght Target Explorer, Weiss et al. 2014),
with their blue and red photometric filters, have enabled multi-colour space photometry of very bright targets
since the launch of the the first pair in 2013. While the primary science case for BRITE satellites does not
include solar-like oscillations on the main sequence, or evolved stars, it was shown by Kallinger et al. (2019) that
red-giant stars with oscillation frequencies below 10 µHz (R? >∼25R ) exhibit oscillation amplitudes that are
large enough to be detected by the BRITE satellites. Such targets are also accessible by spectrographs mounted
on 1-m-class telescopes, such as SONG (Stellar Observations Network Group, Grundahl et al. 2017), which was
designed for the acquisition of high-quality spectroscopic time-series for asteroseismology. The first telescope
of that telescope network was commissioned in 2014 and is installed at the Teide observatory (Tenerife). It is

    1 Institute of Physics, University of Graz, NAWI Graz, Universitätsplatz 5/II, 8010 Graz, Austria
    2 Instituto de Astrofı́sica de Canarias, 38205 La Laguna, Tenerife, Spain
    3 Departamento de Astrofı́sica, Universidad de La Laguna, 38206 La Laguna, Tenerife, Spain
    4 Inst. of Communication Networks & Satellite Communications, Graz University of Technology, Infeldgasse 12, 8010 Graz,

    Austria
    5 Aarhus University, Department of Physics and Astronomy, Ny Munkegade 120, 8000 Aarhus C, Denmark
    6 Institut für Astrophysik der Universität Wien, Tärkenschanzstr. 17, 1180 Vienna, Austria
    7 Thüringen Landessternwarte Tautenburg, Sternwarte 5, D-07778 Tautenburg, Germany;
    8 AIM, CEA, CNRS, Université Paris-Saclay, Université Paris Diderot, Sorbonne Paris Cité, F-91191 Gif-sur-Yvette, France
    9 Sydney Institute for Astronomy (SIfA), School of Physics, University of Sydney, NSW 2006, Australia
    10 Institut fur Astro- und Teilchenphysik, Universität Innsbruck, Technikerstrasse 25, A-6020 Innsbruck, Austria

                                                                                                           c Stars from Space
76 Stars and their variability observed from space
r Fractional changes of Radial velocity Intensity
Intensity maximum
Radial velocity = systemic velocity
To the mean value
Rela,ve varia,on
Mean
d
u
quantity
u r d u
.
Fig. 1. Conceptual illustration of the behaviour of an oscillation mode near the surface of a star. Left panel: A wave
coming from the interior (u) reaches regions of lower density and gets reflected back (r) into the deeper and denser layers
again (d). Right panel: Two sine curves approximate the variations in radial velocity and intensity field (black and
red, respectively). This sketch assumes ideal adiabatic conditions in the outer atmosphere, with the velocity field leading
to an intensity variation shifted by 90o .
equipped with a high-resolution spectrograph (with a resolving power of 77000 ≤ R ≤ 112000) and is capable
of simultaneous wavelength calibration providing metre/sec RV precision.
This project is using a combination of multi-colour BRITE photometry and SONG spectroscopy to inves-
tigate solar-like oscillations in the luminous red-giant star Aldebaran (α Tau) wwhich has a visual brightness
of +0.9 mag and a luminosity of 439±17 L (Heiter et al. 2015). Photometry obtained for Aldebaran by Farr
et al. (2018) with Kepler shows intensity variations of ∼5.7days, corresponding to an oscillation frequency of
∼2 µHz. They concluded that the star has a mass of 1.16±0.07 M . Interferometric radii are also available
(Richichi & Roccatagliata 2005), thus providing an opportunity to test seismic scaling relations for luminous
RGBs, which are suspected to depart significantly from well-established seismic scaling relations (Yu et al.
2020). More technical details are provided in Section 3. More than three decades of RV measurements (Hatzes
et al. 2015) have revealed the presence a quasi-periodic modulation with a period of ∼700 days, which is not
reflected in the variation of the strength of the emission lines in the cores of the Ca ii H & K lines, which are a
classic activity indicator in cool stars. The authors suggested that this signal could originate from a planetary
companion of 6 Jupiter masses, but also urged caution as the signal is not stable over decades as expected for a
planet, and over-stable convection could serve as an alternative explanation. As is discussed further in Section 4,
this candidate planet has been debated heavily in the literature.
2 Variations in the intensity vs. velocity field
When an oscillation mode reaches the near surface layers, it is reflected back to deeper, denser layers. Such
modes at the surface lead to periodic distortions of the surface temperature and velocity field, described typ-
ically by the degree ` of the spherical harmonics (see Aerts et al. 2010, and references therein). The surface
temperature variations lead to fractional variations of the stellar luminosity. Spectroscopy measures the surface
field component along the line of sight. Oscillation modes therefore manifest themselves observationally as
variations in the mean brightness and the systemic radial velocity of the star, respectively. At the point of
reflection an oscillation mode exhibits its maximum brightness, as it is then least obscured by overlying layers.
Coincidentally, the perturbation of the velocity field is changing its direction of propagation. The velocity field
for a given mode therefore shows no perturbation and is equal to the systemic radial velocity of the star. As
illustrated in Fig. 1, that leads to a phase shift of –90 deg in the ideal case.
The two parameters describing the differences between the velocity and intensity variations in Fourier space
are (i) amplitude ratio and (ii) the phase difference. The quantities provide two important diagnostic constraints.
The information contained in these parameters allows us to test stellar oscillation and atmospheric models
beyond the possibilities of classic asteroseismology. Nevertheless, owing to the lack of appropriate simultaneous
data, such studies have only been carried out for two solar-like oscillators.
As demonstrated by Houdek & Gough (2002) and Houdek (2010), a calibrated amplitude ratio between
intensity and velocity variations provides strong constraints on the stellar atmosphere that are independent
of the excitation model. While the RV amplitude is determined by the velocity fluctuations from oscillations
and granulation along the line of sight, and therefore enables a direct comparison with models, the case of
photometric variations remains challenging Kjeldsen & Bedding (2011). The intensity variations correspond
primarily to the temperature fluctuations of the atmosphere over the whole oscillation cycle, but need to beBRITE-SONG of Aldebaran in three voices 77
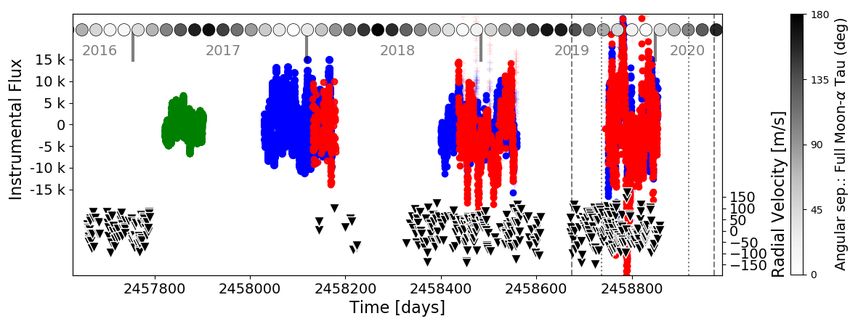
Fig. 2. Data from the ongoing observing campaign on Aldebaran. The red and blue points depict the mean orbital
values of the photometric flux measured by BRITE/Lem (blue filter) and BRITE/Toronto (red filter), respectively. The
80 days of K2 photometry (Farr et al. 2018) are shown in green. Radial velocities measured with SONG are depicted as
black triangles; the long-period trend has been removed. The duration of the ongoing SONG and BRITE observations in
the 2019/20 season are indicated by dashed and dotted lines, respectively. Years are noted at the top, and are juxtaposed
with measures of the angular distance between the star and the Moon at the moment of full moon (indicated in the grey
scale on the right). Owing to stray-light contamination, data points taken with the Moon closer than 35 degrees are
shown as semi-transparent plusses.
translated into fractional changes of the bolometric luminosity. However, to compare observations and models,
observational aspects such as the photometric passband and the colour-dependent quantum efficiency of the
detector of the space telescope need to be taken into account. In that respect, simultaneous multi-colour
photometry provides different measures of the same quantity and increases the robustness of the experiment.
The phase shift between oscillation modes seen in these two observables is a relevant parameter for constrain-
ing pulsation eigenfunctions and eventually models of stochastic excitation (Houdek 2010). Were the oscillations
purely adiabatic, the RVs would be expected to lead the intensity variations with a phase shift of –90 deg when
normalised by the oscillation period. The solar case has been found to be close to this value (Jiménez et al.
1999). Any departure from it reveals heat transfer between the stellar background and the oscillation modes
(Christensen-Dalsgaard & Frandsen 1984; Jiménez et al. 1999), with a maximal lag of –180 deg in the isothermal
case.
3 Experimental data: 2016–2020
The multi-technique campaign described in this contribution (see Fig. 2) was started in the visibility season
2017/18 of Aldebaran, with observations from BRITE/Lem, which is equipped with a blue photometric filter
(λ 4000–4500 AA). At the end of the same observing season, Aldebaran was added to the observing programme
of BRITE/Toronto, which is equipped with a red filter (λ 5000–7000 AA). Each data point shown in Fig. 2
represents the mean of all the individual measurements obtained during a satellite orbit; we discard orbits with
less than 15 individual measurements. The orbital period of the BRITE satellites is about 90 minutes, resulting
in 14–15 photometric measurements per day.
Towards the end of that season we also attempted simultaneous spectroscopic observations with SONG. The
standard observing programme was comprised of 1 or 2 pointings a night, taking three consecutive spectra with
a resolving power of 90,000 and an iodine cell for simultaneous wavelength calibration. However, unfortunately
we experienced adverse weather conditions that were extreme in both intensity and duration for Tenerife.
Since observing season 2018/19, all three instruments have become well coordinated. A typical observing
season with BRITE lasts for about 140 days (September–March), while SONG can obtain at least one set of
spectra per night for about 300 consecutive days; That time series is only interrupted between May and July,78 Stars and their variability observed from space
though periodic gaps are introduced into the dataset by the Moon. Given the low ecliptic latitude of Aldebaran
of about 5 deg, photometric observations are contaminated by, and eventually interrupted by, the full moon
once every ∼28 days. Scattered light from the Moon is not an issue for spectroscopic observations.
The complete dataset of the ongoing campaign is depicted in Fig. 2. It also shows the complementary dataset
of 80 days of K2 photometry, obtained by Farr et al. (2018) using the photometric technique of Halo-photometry
to counteract the effects of partial saturation White et al. (2017). In 2016 and prior to K2 photometry, Farr
et al. (2018) obtained 125 days of RV with SONG, which is also included in our analysis.
4 The controversy over the planet orbiting Aldebaran
The possibility of the presence of a planetary companion around Aldebaran was originally proposed by Hatzes
et al. (2015), who interpreted the long-period trend present in the RV signal as a possible indication of a massive
Jupiter-like planetary companion. However, they were cautious about declaring it firmly as a planet, as the RV
signal was not as stable as would be expected from an exoplanet. They also considered an alternative possibility
that the signal originated from overstable convection, which can occur under extreme non-adiabatic conditions
in a stellar atmosphere (Saio et al. 2015).
Three years later (and parallel to the start of our campaign), numerous studies on Aldebaran or the nature
of the long-period variations were published. First, Hatzes et al. (2018) showed that the RV in the luminous
red giant γ Draconis initially exhibited a similar behaviour. However, the RV signals disappeared in 2013–16
and then reappeared with a phase-shift, so were not compatible with a planetary origin. The authors concluded
that the finding also supported a non-planetary explanation for the long-period signal in Aldebaran. Farr et al.
(2018), who presented a first seismic analysis based on K2 photometry and SONG RVs, used their results
to improve the parameters of the planetary companion. In addition, they argued that both Aldebaran b and
γ Draconis b must be planets, stating that: “it would be a cruel conspiracy of nature if red giants support a
type of oscillation that is common and closely resembles a planetary signal. We believe this cannot be the case”,
(Farr et al. 2018, incipit of paragraph 3, Appendix D). Reichert et al. (2019) then presented an analysis of the
stability of the dataset of Hatzes et al. (2015), complemented with their own spectroscopic observations from
Lick Observatory. They tested a two-planet model, which reduced significantly the large RV scatter in the
residuals, but found that such solution was very unlikely to be stable dynamically.
5 Current status of the analysis, conclusions & Outlook
The ongoing photometric and spectroscopic observations obtained by the BRITE satellites and the SONG
telescope are building a unique, multi-year data set for studying amplitude and phase differences between
velocity and intensity variations. Combining the RV from SONG with multi-colour space photometry from
BRITE offers a rare possibility to characterise the outermost layers of luminous red giants and to provide
crucial diagnostics to test the physics of the stellar atmosphere. Those parameters give access to layers in the
star that are not well probed by normal oscillation modes. Luminous red giants like Aldebaran are of added
interest in that they enable us to study the asteroseismic scaling relations and the stellar structure of objects
with increasing departure from the adiabatic conditions in the atmosphere (Yu et al. 2020; Kallinger et al. 2018).
As is visible in Fig. 2, the observing project is still ongoing and the data we have shown for analysis are
only preliminary. That affectsthe photometric amplitudes in particular We therefore refrain from quantifying
the parameters discussed above.
The comparison of photometric and spectroscopic datasets shows clearly that the variation in RV is leading
the variation in intensity. Visual inspection in the time domain suggests a phase difference which is much
larger than the –90 degrees predicted in the adiabatic case. This is not surprising, but one needs to be cautious
because the interference from granulation, which has amplitudes and periods comparabe to the oscillation signal
of Aldebaran, could lead to an overestimated phase difference. The final value will therefore be determined from
the frequency domain. However, the frequency resolution of a full season of BRITE observations is not sufficient
to resolve individual oscillation modes.
The long-period modulations previously reported in the literature are also present in the SONG dataset.
However, it is too early to arrive at concrete conclusions about their origin. The long time-base and the
high sampling rate of the RV measurements will help us decide if those variations are caused by a planetary
companion or by an unidentified physical process. We note that they are on different times-scales than were
found for secondary clump stars of the Hyades and which were likely to originate from rotational modulation
(Beck et al. 2015; Arentoft et al. 2019).BRITE-SONG of Aldebaran in three voices 79
Constraining the origin of the signal is essential for disentangling actual planets around red giants from
spurious detections due to intrinsic effects and activity. The observations reported clearly demonstrate that a
firm detection of planets around red giants requires RV monitoring that extends over at least several decades.
Understanding benchmark stars like Aldebaran, γ Draconis or Arcturus is of high importance, since luminous
red giants can also be seen at greater distances in the Milky Way (e.g. Mathur et al. 2016). Such stars can
therefore serve as highly-needed probes for understanding extreme phases of stellar evolution, the distribution
of exoplanets, and (eventually) the evolutionary history of our Galaxy.
The authors gratefully acknowledge the work of the BRITE-constellation and SONG science and technical teams. This work
was based on data collected by the BRITE Constellation satellite mission, designed, built, launched, operated and supported by
the Austrian Research Promotion Agency (FFG), the University of Vienna, the Technical University of Graz, the University of
Innsbruck, the Canadian Space Agency (CSA), the University of Toronto Institute for Aerospace Studies (UTIAS), the Foundation
for Polish Science & Technology (FNiTP MNiSW), and National Science Centre (NCN). We would like to acknowledge the Villum
Foundation, The Danish Council for Independent Research – Natural Science, and the Carlsberg Foundation for support to build
the SONG prototype on Tenerife. We thank the SOC/LOC of the “Stars and their Variability” conference for organizing an
inspiring meeting.
References
Aerts, C., Christensen-Dalsgaard, J., & Kurtz, D. W. 2010, Asteroseismology (Springer)
Arentoft, T., Grundahl, F., White, T. R., et al. 2019, A&A, 622, A190
Arentoft, T., Kjeldsen, H., Bedding, T. R., et al. 2008, ApJ, 687, 1180
Beck, P. G., Kambe, E., Hillen, M., et al. 2015, A&A, 573, A138
Borucki, W. J., Koch, D., Basri, G., et al. 2010, Science, 327, 977
Christensen-Dalsgaard, J. & Frandsen, S. 1984, Mem. Soc. Astron. Italiana, 55, 285
Farr, W. M., Pope, B. J. S., Davies, G. R., et al. 2018, ApJ, 865, L20
Garcı́a, R. A. & Ballot, J. 2019, Living Reviews in Solar Physics, 16, 4
Grundahl, F., Fredslund Andersen, M., Christensen-Dalsgaard, J., et al. 2017, ApJ, 836, 142
Hatzes, A. P., Cochran, W. D., Endl, M., et al. 2015, A&A, 580, A31
Hatzes, A. P., Endl, M., Cochran, W. D., et al. 2018, AJ, 155, 120
Heiter, U., Jofré, P., Gustafsson, B., et al. 2015, A&A, 582, A49
Hon, M., Stello, D., & Yu, J. 2018, MNRAS, 476, 3233
Houdek, G. 2010, Ap&SS, 328, 237
Houdek, G. & Gough, D. O. 2002, MNRAS, 336, L65
Jiménez, A., Roca Cortés, T., Severino, G., & Marmolino, C. 1999, ApJ, 525, 1042
Kallinger, T., Beck, P. G., Hekker, S., et al. 2019, A&A, 624, A35
Kallinger, T., Beck, P. G., Stello, D., & Garcia, R. A. 2018, A&A, 616, A104
Kjeldsen, H. & Bedding, T. R. 2011, A&A, 529, L8
Mathur, S., Garcı́a, R. A., Huber, D., et al. 2016, ApJ, 827, 50
Reichert, K., Reffert, S., Stock, S., Trifonov, T., & Quirrenbach, A. 2019, A&A, 625, A22
Richichi, A. & Roccatagliata, V. 2005, A&A, 433, 305
Ricker, G. R., Winn, J. N., Vanderspek, R., et al. 2015, JATIS, 1, 014003
Saio, H., Wood, P. R., Takayama, M., & Ita, Y. 2015, MNRAS, 452, 3863
SilvaAguirre, V., Stello, D., Stokholm, A., et al. 2019, arXiv e-prints, arXiv:1912.07604
Weiss, W. W., Rucinski, S. M., Moffat, A. F. J., et al. 2014, PASP, 126, 573
White, T. R., Pope, B. J. S., Antoci, V., et al. 2017, MNRAS, 471, 2882
Yu, J., Bedding, T. R., Stello, D., et al. 2020, MNRAS (subm.)You can also read