Modern Astronomy: An Introduction to Astronomy - Presented by Dr Helen Johnston School of Physics
←
→
Page content transcription
If your browser does not render page correctly, please read the page content below
Modern Astronomy:
An Introduction to Astronomy

Presented by
Dr Helen Johnston
School of Physics

Spring 2018

The University of Sydney       Page
This course is an introduction to modern astronomy, showing what
         we know about our place in the Universe and how we know it.
           1. The Universe: a guided tour
           2. The Sun and planets
           3. The birth of stars
           4. The evolution of stars
           5. Stellar graveyards: white dwarfs, neutron stars and black holes
           6. Miscellany: Binaries, clusters and variables
           7. Our galaxy: putting the pieces together
           8. Galaxies: normal galaxies to quasars
           9. Cosmology: the universe as a whole
           10. Modern astronomy: exoplanets, the "new astronomies", dark energy...
The University of Sydney                                                             Page   !2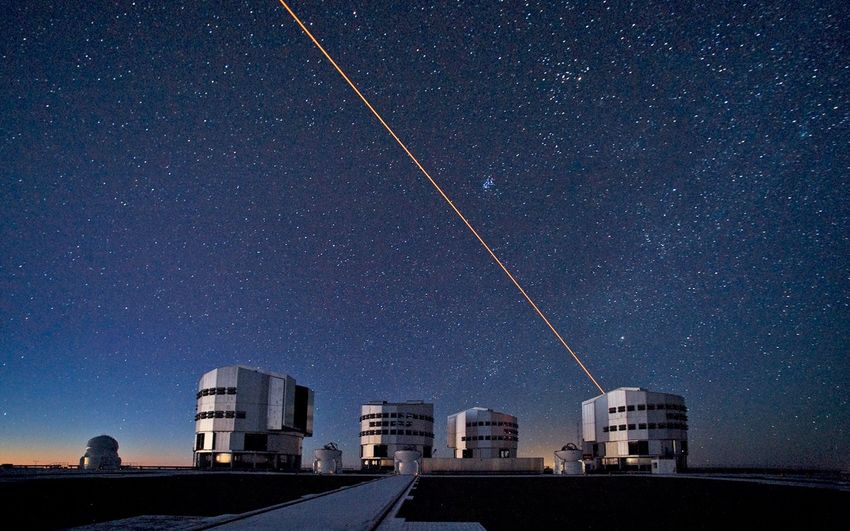
There is a course web site, at

             http://physics.usyd.edu.au/~helenj/IntroductiontoAstronomy.html

             where I will put
                  •   PDF copies of the lectures as I give them
                  •   lecture recordings
                  •   copies of animations
                  •   links to useful sites

             Please let me know of any problems!

The University of Sydney                                                       Page
                                                         !3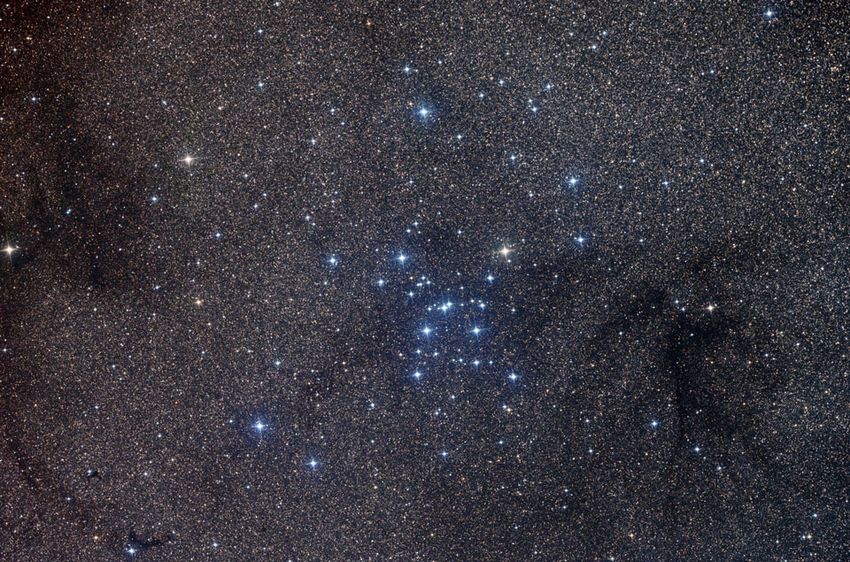
Lecture 1:
The Universe: a guided tour
In tonight’s lecture

     • A quick tour
            – set the scene of where we are
     • The scales of astronomy
          – just how big is the universe?
     • Electromagnetic radiation
          – how do we find out about the universe?

The University of Sydney                             Page   !5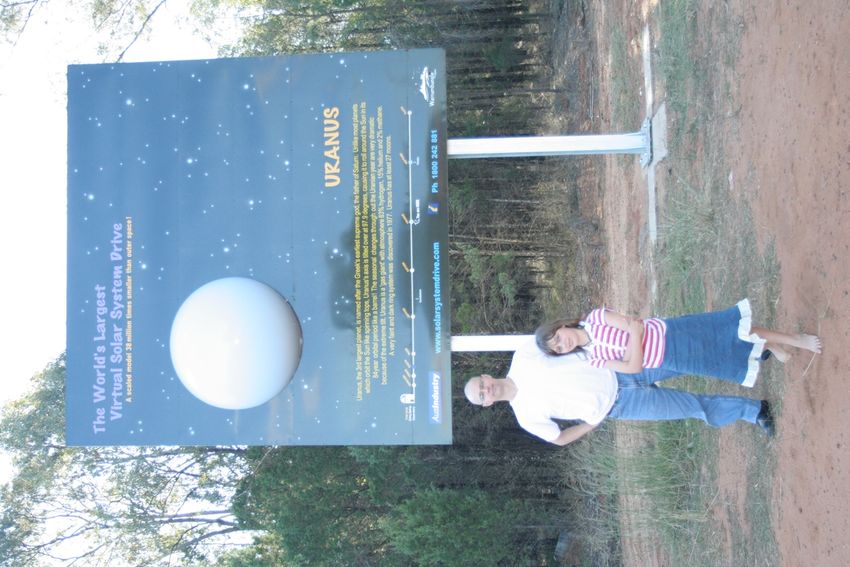
A quick tour

                                  We are on a small
                                  planet...

The University of Sydney                              Page
                             !6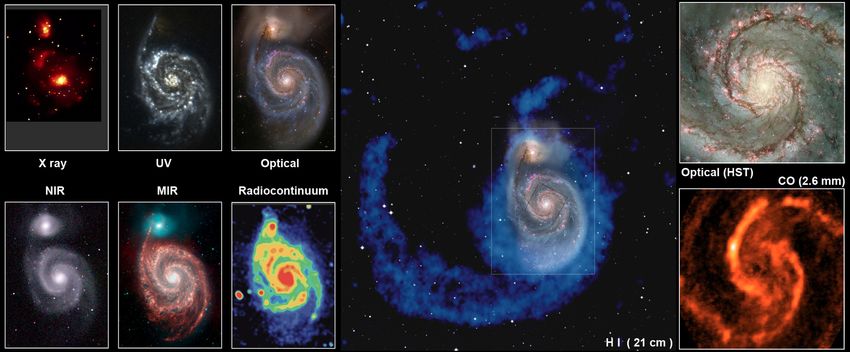
......orbiting withwith
                                        orbiting   eighteight
                                                         seven
                                other planets...
                                 seven other planets...

The University of Sydney                                         Page
                           !7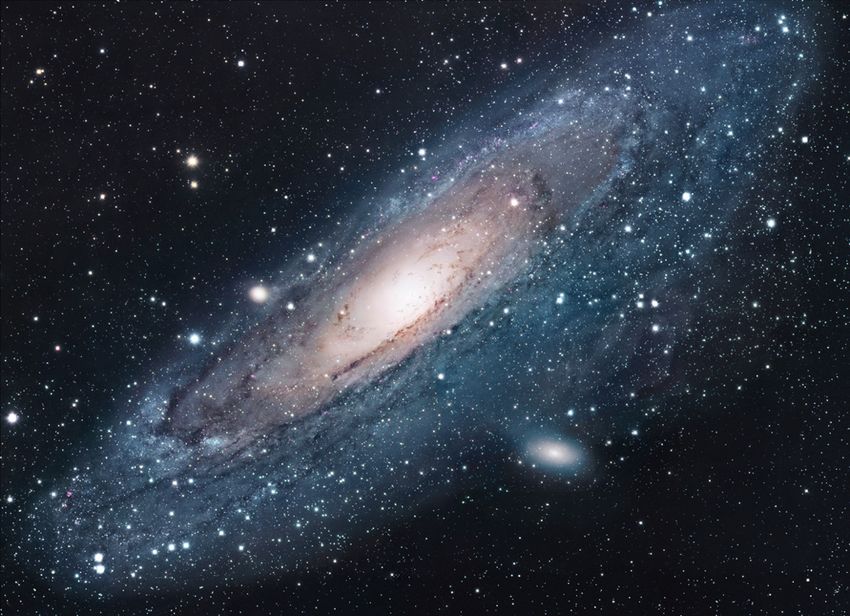
... orbiting with eight seven
                                other planets...

The University of Sydney                                        Page
                           !8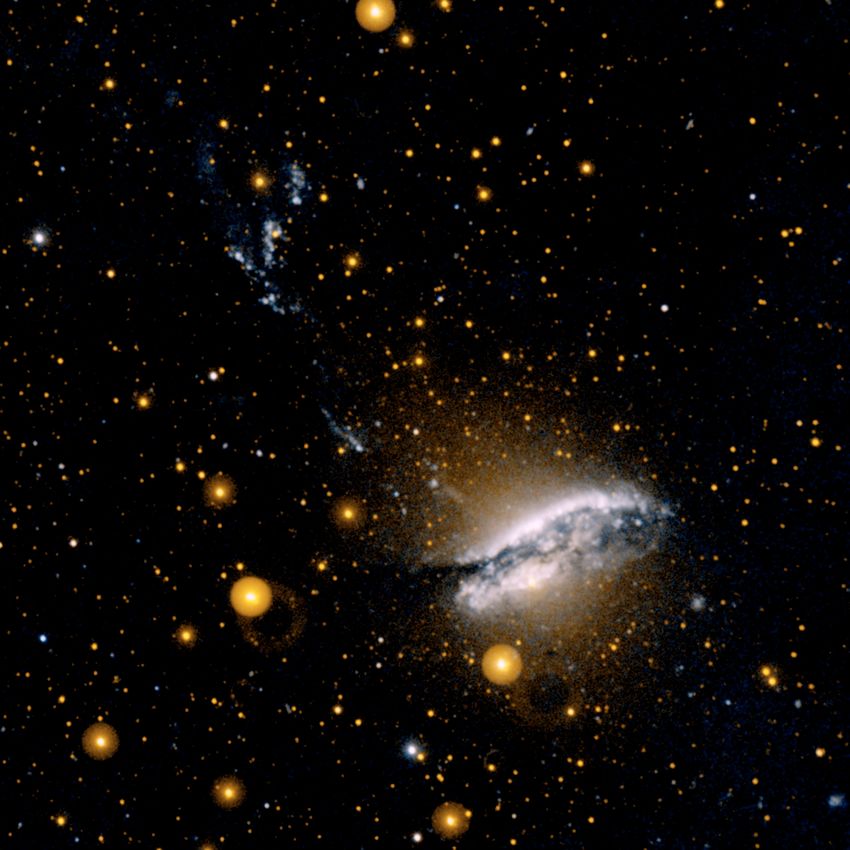
...
                                ...and
                                    anda a
                                         host of of
                                           host  smaller
                                                    smaller
                                bodies...
                                bodies...
The University of Sydney                             Page
                           !9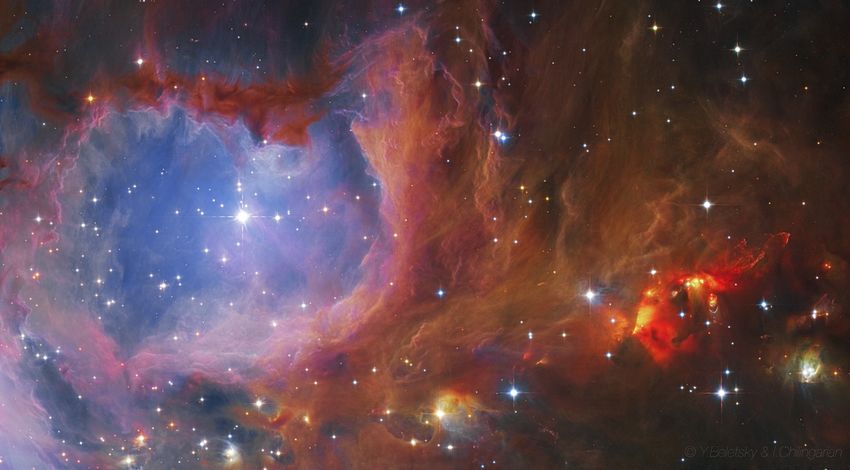
...around a medium-
                                 size orange-yellow
                                 star...

The University of Sydney                          Page
                           !10
...which was born out of the
interstellar gas about 5
billion years ago...
The University of Sydney Page
!11...which was born out of the
interstellar gas about 5
billion years ago...
The University of Sydney Page
!12...which was born out of the
interstellar gas about 5
billion years ago...
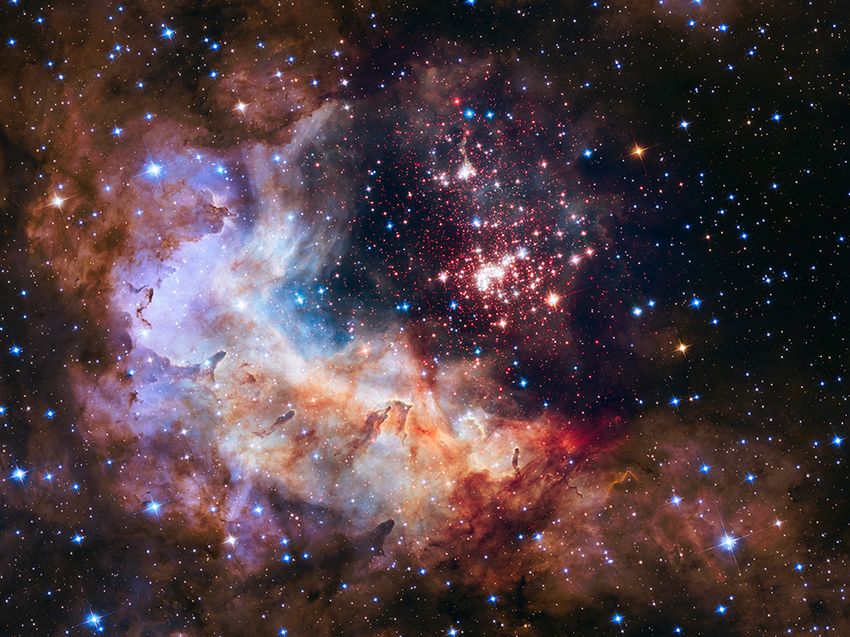
The University of Sydney Page...in a young
cluster of stars.
The University of Sydney Page...in a young
cluster of stars.
The University of Sydney Page
!15Our Sun will eventually expire
in a fiery conflagration
The University of Sydney Page
!16OurOur
SunSun
willwill
eventually
eventually
expire
in aexpire
fiery conflagration
in a fiery
conflagration, spilling its gas
back into interstellar space...
The University of Sydney Page
!17...leaving only a white dwarf
behind, doomed to cool
slowly into a black cinder.
The University of Sydney Page
!18Our Sun is one of billions
of other stars
The University of Sydney Page
!19Our Sun is one of billions
of other stars
The University of Sydney Page
!20Our Sun is one of billions
of other stars, about two-
thirds of the way out along
a spiral arm in a galaxy
rather like this one...
The University of Sydney Page
!21... which is one of the
biggest galaxies in a
small group of
galaxies...
The University of Sydney Page
!22... which is in turn part
of a much larger
group called the Local
Supercluster...
The University of Sydney Page
!23... which is just one of billions of clusters of
The University of Sydney
galaxies... Page !24... which are part of large
sheets and bubbles of
galaxies in the universe.
The University of Sydney Page
!25The University of Sydney Page
!26The scales of astronomy
“Space is big. Really big.You just won’t believe how vastly, hugely, mind-
          bogglingly big it is. I mean, you may think it’s a long way down the
          street to the chemist, but that’s just peanuts to space.”
                                                  – Douglas Adams,The Hitchhiker’s Guide to the Galaxy (1978)

The University of Sydney                                                                                  Page !28
Space is really big. Start with the
solar system. This is a view you
often see, but it totally
misrepresents the relative sizes of
the planets.
The University of Sydney Page
!29Here it is with the sizes to scale.
Earth
The University of Sydney Page
!30This shows the relative sizes of the planets, and how small the Earth
is. But this shows us nothing about the scale of the orbits: the solar
system.
The best way to visualise the distances is with a scale model.
The University of Sydney Page !31http://solarsystemdrive.com/
Object    Size                        Distance from
                                                                 Sun

                           Sun       23 cm (soccer ball)         -

                           Mercury   0.08 cm (pinhead)           10 m

                           Venus     0.2 cm (peppercorn)         18 m

                           Earth     0.2 cm (peppercorn)         25 m

                           Mars      0.1 cm (pinhead)            38 m

                           Jupiter   2.4 cm (walnut)             130 m

                           Saturn    2.0 cm (macadamia)          238 m

                           Uranus    0.9 cm (peanut)             478 m

                           Neptune   0.8 cm (peanut)             749 m

                           Pluto     0.04 cm (pinhead)           983 m

The University of Sydney                                                         Page
                                                           !33
Pluto’s orbit: 1 km
Sun
The University of Sydney Page
!34Voyager 1: 3.3 km away
X
The University of Sydney
Sun !35
PageOne light year: 1600 km
Sun
The University of Sydney Page
!36Nearest star: 6700 km
Sun
The University of Sydney Page
!37On this scale, the nearest star, Alpha Centauri, is at a distance of
6,700 km = the distance to Singapore.
There is not a single object approaching the size of a soccer ball
between here and Singapore.
Remember this scale: we’ll refer to it again.
The University of Sydney Page !38“The chief characteristic of the universe is, I
would say, emptiness. There is infinitely more
nothing in the universe than anything else.”
– John Updike, The Poorhouse Fair
The University of Sydney Page !39Because of these ridiculous distances, astronomers have defined
some special units to make the numbers more manageable:
• An astronomical unit (AU) is the average Earth-Sun distance: 1 AU
= 149.6 million km
• A light year (ly) is the distance light travels in a year: 1 ly =
9,461,000,000,000 km = 63,000 AU
• A parsec (pc) is about 3.26 ly; we’ll find out where this comes from
in a few lectures
The University of Sydney Page !40The finite speed of light, combined with these enormous
distances, means that when we look out into the universe, the
light we see was emitted some time ago – a long time ago, if
the object is very distant. When we look out into the Universe,
we are looking back in time.
384,400 km
1.3 s
The University of Sydney The Moon Page !41The finite speed of light, combined with these enormous
distances, means that when we look out into the universe, the
light we see was emitted some time ago – a long time ago, if
the object is very distant. When we look out into the Universe,
we are looking back in time.
150,000,000 km
8m
The University of Sydney The Sun Page !42The finite speed of light, combined with these enormous
distances, means that when we look out into the universe, the
light we see was emitted some time ago – a long time ago, if
the object is very distant. When we look out into the Universe,
we are looking back in time.
39.5 AU 5.5 h
Pluto
The University of Sydney Page !43The finite speed of light, combined with these enormous
distances, means that when we look out into the universe, the
light we see was emitted some time ago – a long time ago, if
the object is very distant. When we look out into the Universe,
we are looking back in time.
40 trillion km
4.3 y
The University of Sydney The nearest star, alpha Centauri Page !44The finite speed of light, combined with these enormous
distances, means that when we look out into the universe, the
light we see was emitted some time ago – a long time ago, if
the object is very distant. When we look out into the Universe,
we are looking back in time.
168,000 ly
168,000 y
The University of Sydney
The Large Magellanic Cloud Page !45The finite speed of light, combined with these enormous
distances, means that when we look out into the universe, the
light we see was emitted some time ago – a long time ago, if
the object is very distant. When we look out into the Universe,
we are looking back in time.
2,000,000 ly
2 million y
The University of Sydney The Andromeda galaxy Page !46The finite speed of light, combined with these enormous
distances, means that when we look out into the universe, the
light we see was emitted some time ago – a long time ago, if
the object is very distant. When we look out into the Universe,
we are looking back in time.
2.4 billion ly; z=0.158
2.4 billion y
The University of Sydney Nearest quasar, 3C273 Page !47The finite speed of light, combined with these enormous
distances, means that when we look out into the universe, the
light we see was emitted some time ago – a long time ago, if
the object is very distant. When we look out into the Universe,
we are looking back in time.
z = 8.6
13.1 billion y
The University of Sydney Most distant object: UDFy-38135539 Page !48One problem we have is that when we look at the sky, we
have no notion how far away objects are.
The stars of the Southern Cross and the Pointers have similar brightnesses, but very different distances.
The University of Sydney Page !49The coloured object is the asteroid Ceres (distance ~3 AU) passing near the galaxy group NGC 3607 (distance 60 million light years)
star
               ~300 ly
                                                         quasar
                                                         12 billion ly

                                  quasar
                              25 billion ly

galaxy
5 billion ly

                         A field from the Sloan Digital Sky Survey, which happens to contain
                         stars, galaxies, and one of the most distant quasars in the universe:
                                                            SDSS J033829.31+002156 (z=5).
We will be discussing how we find the distances to astronomical
objects later in the course.
The University of Sydney Page !52Electromagnetic radiation – our eye on the sky
Astronomy is not an experimental science: astronomers can’t get
          their hands on their subject matter. Everything we know about the
          cosmos, we know by remote sensing.

          Visible light is the most obvious means by which we can observe
          the universe. But there are many other sorts of radiation we can’t
          see with our eyes: these include radio waves, infrared, ultraviolet,
          X-rays and gamma rays. Together, all these forms of radiation
          make up the electromagnetic spectrum – the complete spectrum of
          radiation.

The University of Sydney                                                         Page
                                           !54
Wavelength Frequency
10 km (shipping) 30 kHz
1 km (aircraft) 300 kHz
300 m (AM) 1000 kHz = 1 MHz
50 m (shortwave) 6 MHz
3m (FM radio) 100 MHz
50 cm (TV) 600 MHz
1 cm (microwave)
10 micron
0.5 micron = 500 nm
100 nm
1 nm
The University of Sydney 0.001 nm = 1pm Page
!55Visible light makes up only a tiny fraction of the electromagnetic
spectrum. Our eyes can see less than an octave of the spectrum,
from wavelengths of 400 nm to 700 nm. Astronomical
observations cover more than 65 octaves of the spectrum, from
low-frequency radio waves to ultra-high-energy gamma rays.
From now on, when we use the word “light”, we mean
“electromagnetic radiation”, not just visible light.
All electromagnetic radiation travels at the speed of light, which
is usually written as c = 300,000 km/s.
The University of Sydney Page
!56The wavelength at which an object radiates most depends
principally on its temperature.
Cool objects radiate most at long wavelengths,
hot objects at short wavelengths.
The Sun radiates most at the wavelength of visible light.
The University of Sydney Page
!57All forms of EM radiation are the same, but they seem very
different because of the very different scales involved.
Radiation can pass around objects which are much smaller than the
wavelength.
The University of Sydney Page
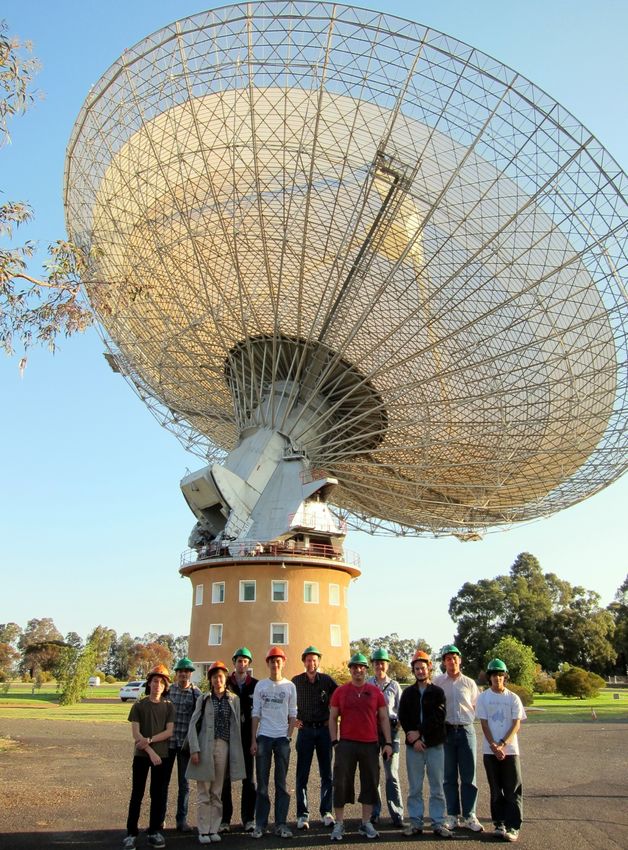
!58Radiation doesn’t “see” objects (or
holes) which are much smaller than the
wavelength – which is why you can see
through the door of your microwave,
and why you can build a radio
telescope out of chickenwire.
The University of Sydney Page !59The Earth’s atmosphere is opaque to nearly all parts of the EM
spectrum.
Only visible and radio waves can reach the surface.
The University of Sydney Page
!60So we need to go outside the Earth’s atmosphere in order to see
many parts of the electromagnetic spectrum. And even for regions
which we can see from Earth, like visible light, going into space has
advantages, like removing the twinkle the atmosphere produces.
Here are the most important past and present astronomical
satellites*
* plus a couple of ground-based missions
The University of Sydney Page
!61NASA’s “Great Observatories” missions
1991–2000 1990–now
1999–now 2003–nowAstronomy has been revolutionised by the ability to observe the
sky at different wavelengths. Here is the galaxy Centaurus A at
different wavelengths.
The optical image shows a
bright elliptical galaxy
obscured by a dark dust lane.
The University of Sydney Page !64Astronomy has been revolutionised by the ability to observe the
sky at different wavelengths. Here is the galaxy Centaurus A at
different wavelengths.
In the ultraviolet image the galaxy
has almost disappeared: all we see
is the dark dust lane shrouding the
bright centre.
The University of Sydney Page !65Astronomy has been revolutionised by the ability to observe the
sky at different wavelengths. Here is the galaxy Centaurus A at
different wavelengths.
The infrared image shows that
the dust lane is actually the
remains of a spiral galaxy.
The University of Sydney Page !66Astronomy has been revolutionised by the ability to observe the
sky at different wavelengths. Here is the galaxy Centaurus A at
different wavelengths.
The radio image is a surprise! We
see a totally new structure,
looking like jets shooting out of
the centre and spreading out.
The University of Sydney Page !67Astronomy has been revolutionised by the ability to observe the
sky at different wavelengths. Here is the galaxy Centaurus A at
different wavelengths.
The X-ray image also shows a jet,
this time only pointing in one
direction. We believe it is emanating
from a supermassive black hole at
the centre of the galaxy.
The University of Sydney Page !68Here are all those images together.
X-ray ultraviolet optical infrared radio
short long
wavelength wavelength
The University of Sydney Page !69Composite X-ray (blue), radio (pink and green), and optical (orange and yellow) image of the galaxy Centaurus A
Another example: the galaxy M51,
from X-ray to radio.
Why do these images look so different?
   Since objects of different temperatures emit light of different
   wavelengths, then observing at different wavelengths allows us to “see”
   objects of different temperatures, which means very different conditions.
                            Characteristic
        Type of radiation                    Typical objects emitting this radiation
                            temperature
        Gamma-ray           > 108 K          Neutron stars, accretion disks around black holes

        X-ray               106–108 K        Shocked gas; neutron stars; supernova remnants

        Ultraviolet         104–106 K        Supernova remnants; very hot stars; quasars

        Optical             1000–10,000 K    Stars; galaxies; emission nebulae; reflection nebulae

        Infrared            10–1000 K        Cool stars; interstellar gas; planets

         Radio              < 10 K           Cosmic background; cold interstellar gas; supernova
The University of Sydney
                                             remnants !73                                            Page
Spectra: separating light
Almost every source of EM radiation produces photons of many
wavelengths at once.
A spectrometer is a device for sending light of different
wavelengths in different directions.
The University of Sydney Page
!74Many objects when heated show the same shape to their spectrum,
called a blackbody spectrum. A black body gives off radiation at
many wavelengths, but has a strong peak at a particular wavelength.
The hotter the object, the shorter the wavelength: hotter objects have
bluer spectra.
The University of Sydney Page
!75Joseph Fraunhofer, in 1814, discovered that the solar
spectrum was not just a continuous band of colour, but was
crossed by numerous dark bands, which never changed
their position.
The University of Sydney Page
!76Gustav Kirchhoff, in 1859, discovered that a heated substance
produced a series of coloured lines, and that this pattern was
unique for each chemical element.
He found that there are three
different types of spectra:
● Continuous spectrum (hot, high pressure gas or
solid)
● Bright emission lines (hot, low pressure gas)
● Dark absorption lines (cool, low pressure gas)
The University of Sydney Page
!77H
He
Na
Mg
Fe
The University of Sydney Page
!78High resolution solar spectrum
Each element produces a unique fingerprint.

          In many ways, this represents the beginning of astronomy as a
          science. Suddenly it was possible to study the composition of
          heavenly bodies using nothing but light!

The University of Sydney                                                  Page
                                         !80
Because light is made of waves, the wavelength will change if the
emitting object is moving: the Doppler effect. A source moving
towards you has a shorter wavelength (blueshift), a source moving
away has a longer wavelength (redshift).
The University of Sydney Page
!81This is how police speed radars work: the shift in frequency
gives the speed of the car.
The University of Sydney Page
!82Blueshifted, approaching you
Stationary
Redshifted, receding from you
The amount of shift you get depends on the velocity: faster objects
have the spectral lines shifted further from the rest wavelength.
The University of Sydney Page
!83So astronomers have to use a lot of inference to understand
what is going on:
• images: the shape of an object
• spectra: what it’s made of, how fast it’s moving...
• multi-wavelength images: how it works
The University of Sydney Page !84Case study: Hanny’s Voorwerp
In 2007, Hanny van Arkel, a Dutch school teacher and volunteer
for the Galaxy Zoo project, discovered a giant green object near
an ordinary spiral galaxy.
Nothing like it had ever been seen before.
Original SDSS image of Hanny’s Voorwerp
The University of Sydney Page !85Astronomers all over the world
used many telescopes at
different wavelengths to try to
understand it.
Spectra of the object showed
that it is at the same distance as
the nearby galaxy, and is about
the same size. The light is
produced by hot glowing gas:
the green colour is produced by
ionised oxygen atoms.
The University of Sydney Hubble image of Hanny’s Voorwerp Page !86Our best guess is that the gas, ripped from another galaxy, is glowing
because it was illuminated by a quasar which has since switched off.
The University of Sydney Page !87Next week
... we’ll take a look at our Solar System,
and what it’s made of.
The University of Sydney Page
!88Further reading
For the whole course:
• For astronomical images, you can’t do better than the “Astronomy Picture of the Day” website, http://
antwrp.gsfc.nasa.gov/apod/astropix.html. Not only does this have a fabulous archive of the most amazing pictures (and a
new one every day), each image also has links to many other interesting sites where you can follow up the topic. I’ve used
APOD as the source for many of the images here, mostly because it’s so convenient. If you prefer to have your pictures in a
form you can hold (and show off to friends), a selection has been published as a book, in “Universe: 365 Days” by R. J.
Nemiroff and J. T. Bonnell (Harry N. Abrams, 2003), with a follow-up volume called “Astronomy: 365 Days” (2006)
• There are many excellent introductory-level texts which cover the material in this course. A good example is “Horizons:
Exploring the Universe” by Michael A. Seeds (Brooks/Cole, 2000); or the text we use for our first-year introductory
astronomy course is “The Cosmic Perspective” by Bennett et al. (Pearson, 2010)
• NASA has a site called “Imagine the Universe”, http://imagine.gsfc.nasa.gov/index.html which is a good place to start
for finding out about all things astronomical. It also has excellent links to other places on the Web to find information.
The University of Sydney Page
!89For tonight’s lecture:
• “Imagine the Universe” has a nice page about the electromagnetic spectrum:
http://imagine.gsfc.nasa.gov/docs/science/know_l1/emspectrum.html
• For more galaxies and other objects in many wavelengths, take a look at IPAC’s “The Multiwavelength Astronomy
Gallery”, http://coolcosmos.ipac.caltech.edu/cosmic_classroom/multiwavelength_astronomy/multiwavelength_museum/ ; or
the “Multiwavelength Milky Way”, http://mwmw.gsfc.nasa.gov/
• Mike Brown, the discoverer of Eris, has an excellent blog about scale in the Solar System, and how hard it is to depict
planetary scales accurately, at http://www.mikebrownsplanets.com/2009/08/planetary-placemats.html
• There’s a lovely book on the same topic: “Sizing up the Universe: The cosmos in perspective” by J. Richard Gott and Robert
J. Vanderbei (National Geographic, 2011). It’s like a meditation about size and scale, and the centrepiece is their
“Logarithmic Map of the Universe” – a version of which can be found at http://www.astro.princeton.edu/universe/ (though
not as pretty). xkcd has a similar idea in the cartoon just called “Height” http://xkcd.com/482/
• The Galaxy Zoo project is a “citizen science” project where members of the public assist in research by classifying galaxies
observed in the Sloan Digital Sky Survey: http://www.galaxyzoo.org/. There are other associated projects: classifying
features on the Moon (https://www.zooniverse.org/project/moonzoo), finding planets around other stars (https://
www.zooniverse.org/project/planethunters), and classifying Hubble galaxy pictures (https://www.zooniverse.org/project/
hubble)
• Hanny van Arkel has her own blog, where she talks about the discovery of her voorwerp: http://www.hannysvoorwerp.com/
The University of Sydney Page
!90Sources for images used:
• Title image: The barred spiral galaxy NGC 613, taken by ESO's Very Large Telescope. From ESO Press Release, 19 December 2003
http://www.eso.org/public/outreach/press-rel/pr-2003/phot-33-03.html
• Eta Aquarid & Milky Way Reflections: image by Mike Taylor, from APOD 2014 May 9 http://apod.nasa.gov/apod/ap140509.html
• Earth: View of the Earth from space, Eastern hemisphere, from "The Blue Marble: True-color global imagery at 1 km resolution"
http://earthobservatory.nasa.gov/Newsroom/BlueMarble
• Valles Marineris hemisphere of Mars: from NASA Planetary Photojournal,http://photojournal.jpl.nasa.gov/catalog/PIA00407
• Cassini view of Jupiter: from NASA Planetary Photojournal, http://photojournal.jpl.nasa.gov/catalog/PIA02873
• Asteroid Ida and its moon Dactyl: from Views of the Solar System by Calvin J. Hamilton http://www.solarviews.com/cap/ast/idamnclr.htm
• Callisto (second largest moon of Jupiter): from NASA Planetary Photojournal, http://photojournal.jpl.nasa.gov/catalog/PIA03456
• Hyperion (moon of Saturn): from APOD 2013 Jun 30 http://apod.nasa.gov/apod/ap130630.html
• Comet 67P/Churyumov-Gerasimenko: from the JPL Rosetta site http://rosetta.jpl.nasa.gov/gallery/images/comet-67p/churyumov-gerasimenko
• Comet: Comet Hale-Bopp in 1997, from APOD 2000 December 27 http://antwrp.gsfc.nasa.gov/apod/ap001227.html
• Sun: APOD 2003 July 29 http://antwrp.gsfc.nasa.gov/apod/ap030729.html
• Eagle nebula: APOD 1997 January 19 http://antwrp.gsfc.nasa.gov/apod/ap970119.html
• Star forming region M43, APOD 2015 Jul 10 http://apod.nasa.gov/apod/ap150425.html
• Keyhole Nebula: Hubble Heritage Project, http://heritage.stsci.edu/2000/06/index.html
• Cluster and Starforming Region Westerlund 2 APOD 2015 April 25 http://apod.nasa.gov/apod/ap150425.html
• Open cluster: M11 APOD 2003 January 22 http://antwrp.gsfc.nasa.gov/apod/ap030122.html
• Planetary nebula: The Helix Nebula APOD 2014 Oct 12 http://apod.nasa.gov/apod/ap141012.html
• Cat's Eye Nebula: APOD 2014 Oct 12 http://apod.nasa.gov/apod/ap141012.html
• Artist's interpretation of the white dwarf star H1504+65: from “Naked White Dwarf Shows its Dead Stellar Engine”
http://www.space.com/scienceastronomy/mystery_monday_040705.html
• Stars in Scorpius: from APOD 2012 September 12, http://apod.nasa.gov/apod/ap120912.html
• Stars and dust in the Milky Way: from Astronomy Picture of the Day, 2003 September 28, http://antwrp.gsfc.nasa.gov/apod/ap030928.html
• Spiral galaxy: M51, from the Hubble Heritage Project, http://heritage.stsci.edu/2005/12a/index.html
• Group of galaxies: the Hickson Compact Group HCG 87; APOD 1999 September 6 http://antwrp.gsfc.nasa.gov/apod/ap990906.html
• Virgo cluster: APOD 2015 Aug 4 http://apod.nasa.gov/apod/ap150804.html
• Hercules cluster: APOD 2014 June 25 http://apod.nasa.gov/apod/ap140625.html
• Sheets and bubbles of galaxies: from the Illustris Project http://www.illustris-project.org/explorer/
• Distance ladder: from Spitzer mission pages http://www.nasa.gov/mission_pages/spitzer/multimedia/pia15818_prt.htm
• Nine planets: Solar system montage, PIA01341 from the NASA Planetary Photojournal http://photojournal.jpl.nasa.gov/catalog/PIA01341
• Planets and sun to scale: from IAU Draft Definition of “planet” http://www.iau.org/public_press/news/detail/iau0601/
• Scale model of the Solar System: from “The Thousand-Yard Model” by Guy Ottewell http://www.noao.edu/education/peppercorn/pcmain.html
The University of Sydney Page
!91• Updike: quoted in Hirshfeld, “Parallax: The Race to Measure the Cosmos”, p. 68
• Quasar image: from “High Redshift Quasars in the ING Wide Field Survey”, http://www.ing.iac.es/PR/newsletter/news4/science1.html
• Distances of stars in the Southern Cross: from “Distances” by Peter Caldwell, http://users.netconnect.com.au/~astronet/dist.html. Used with permission
• Electromagnetic spectrum: from “Imagine the Universe” http://imagine.gsfc.nasa.gov/docs/science/know_l1/emspectrum.html
• Wavelength: from “Cool Cosmos”, http://coolcosmos.ipac.caltech.edu/cosmic_classroom/cosmic_reference/emspec.html
• Wavelength as a function of temperature: from Astro11230 by Richard McCray http://cosmos.colorado.edu/cw2/courses/astr1120/text/chapter1/lesson1.html
• Atmospheric transmission from Wikipedia: Space observatory http://en.wikipedia.org/wiki/Space_observatory. Current astronomical missions: from
http://nssdc.gsfc.nasa.gov/astro/astrolist.gif. NASA Great Observatories: from Chandra http://chandra.harvard.edu/resources/illustrations/elec_mag_spec.html
• Wavelength scales: from “Cool Cosmos” page, http://coolcosmos.ipac.caltech.edu/cosmic_classroom/cosmic_reference/emspec.html
• Multi-wavelength images of Cen A: from “The Many Faces of Centaurus A”, http://www.mpe.mpg.de/~hcs/Cen-A/cen-a-pictures.html
• Multi-wavelength images of M51: from Angel Lopez-Sanchez http://oldweb.aao.gov.au/local/www/alopez/multiwave.html
• Prism: from "How Stuff Works" http://science.howstuffworks.com/question41.htm
• Blackbody spectrum: from "Explorations" by Thomas T. Arny, Fig. 3.6 http://www.mhhe.com/physsci/astronomy/arny/instructor/graphics/ch03/0306.html
• Fraunhofer lines: from "Quantum Physics" by S. Raychaudruri, http://home.iitk.ac.in/~sreerup/BSO203.html
• Types of spectra: from "Explorations" by Thomas T. Arny, Fig. 3.15 http://www.mhhe.com/physsci/astronomy/arny/instructor/graphics/ch03/0315.html
• Doppler shifts: from "Explorations" by Thomas T. Arny, Fig. 3.18 http://www.mhhe.com/physsci/astronomy/arny/instructor/graphics/ch03/0318.html
• Red and blue shifts: from "Above the Skies: An exploration into our universe through animated spectroscopy", http://hea-www.harvard.edu/~efortin/thesis/html/index.shtml
• Hanny’s Voorwerp: from APOD 2008 June 25 http://apod.nasa.gov/apod/ap080625.html and 2011 February 10 http://apod.nasa.gov/apod/ap110210.html. Explanation
sketches from HubbleSite release STScI-2011-01 http://hubblesite.org/newscenter/archive/releases/2011/01/.
The University of Sydney Page
!92You can also read