THE CASHMORE FILES Your guide to profiting from the Australian property cycle, from Australia's best buyer's advocate.
←
→
Page content transcription
If your browser does not render page correctly, please read the page content below
THE
CASHMORE
  FILES
   Your guide to profiting from
the Australian property cycle, from
 Australia’s best buyer’s advocate.

        By Catherine Cashmore
Contents
Introduction.......................................................................................... 1

The Corruption of Economics.............................................................. 2

The Big Money in Little China............................................................ 10

The Law of Absorption....................................................................... 21

The Suburban Land Rush Happening Now...................................... 27

                                                   2i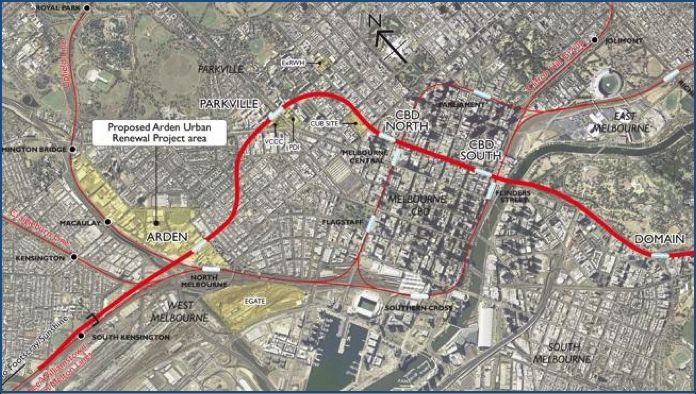
Introduction
Dear Reader,

I’ve been in real estate for over a decade now. I can tell you from personal experience the
information in the document you’re about to read simply cannot be found anywhere else.

Very few people understand the real estate (land) market the way Cycles, Trends and
Forecasts teaches you.

It’s important to understand the history and politics behind the real estate cycle. That’s why
the first piece in this report deals with this.

Once you ‘see the cat’, you’ll finally understand the dynamics behind real estate as so few
do.

Certainly most real estate agents don’t have a clue. I can assure you of that.

Phillip J Anderson and the real estate cycle will hold you in good stead in the coming years
as a property investor.

Phil will teach you to see the cycle and why it happens.

In this report I show you how to play it, with actionable suggestions.

Best of luck for this cycle (and the next one...and the next one...)

Catherine Cashmore
Contributing Editor,
Cycles, Trends and Forecasts

                                                1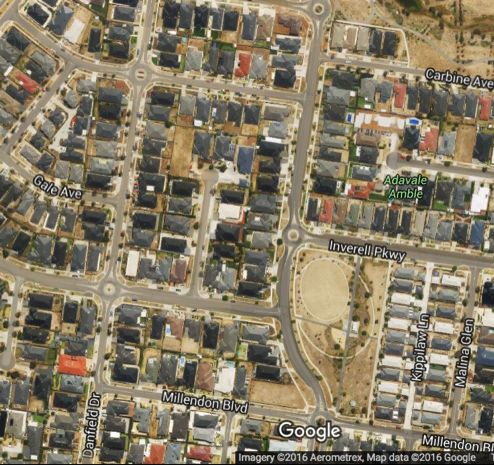
The Corruption of Economics
       Why Most Investors Are Blind to What They Need to See
                                     By Catherine Cashmore

In the 1880s Judge James G. Maguire of the Superior Court of the city and county of San
Francisco gave a speech to the New York Anti-Poverty Society. He said;

  ‘I was one day walking along Kearney Street in San Francisco when I noticed a crowd
    in front of a show window...I took a glance myself, but I saw only a poor picture of an
    uninteresting landscape.

                                       Source: henrygeorge.org

  ‘As I was turning away my eye caught these words underneath the picture:
  ‘“Do you see the cat?”
  ‘...I spoke to the crowd, “Gentlemen, I do not see a cat in the picture; is there a cat there?”
  ‘Someone in the crowd replied, “Naw, there ain’t no cat there! Here’s a crank who says he
    sees a cat in it, but none of the rest of us can...’
  ‘Then the crank spoke up. “I tell you,” he said, “there IS a cat there. The picture is all cat! ...
  ‘...and then, there it was! Sure enough, just as the crank had said;

                                                 2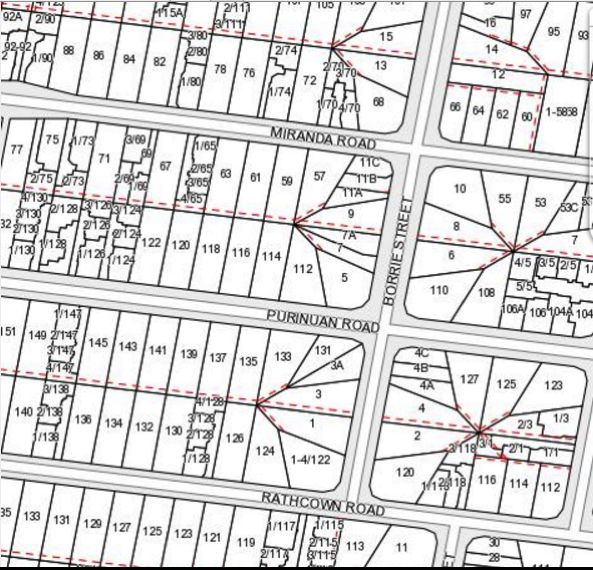
‘But now that I saw the cat, I could see nothing else in the picture!...and I was never
    afterwards able, upon looking at that picture, to see anything in it *but* the cat.’
Maguire’s story was intended as a parable for land’s role in the economy.

Like the cat in the picture, it is blindingly obvious once it becomes clear — so obvious in
fact, it is hard to see anything *but* the land.

                       The man who electrified the world
Maguire had been inspired by a passage in the nineteenth century political treatise
‘Progress and Poverty’ the American journalist Henry George wrote.

One of his famous passages was;

  ‘That as land is necessary to the exertion of labour in the production of wealth, to
    command the land which is necessary to labour, is to command all the fruits of labour
    save enough to enable labour to exist.’
George had no formal education to speak of.

He had left school at the age of 14, drifting in an out of poverty until securing steady
employment as a typographer for the newly created San Francisco Times — later going on
to edit his own newspapers.

However, George was an avid reader. He had studied the great classical economists such as
David Ricardo and Adam Smith.

He understood the relationship between the three factors of production — land, labour, and
capital — and he used these tools to dissect the system.

He wrote:

  ‘Take now...some hard-headed businessman, who has no theories, but knows how to make
    money. Say to him:
  ‘“Here is a little village; in ten years it will be a great city—in ten years the railroad will
    have taken the place of the stage coach, the electric light of the candle; it will abound
    with all the machinery and improvements that so enormously multiply the effective power
    of labour.”

                                               3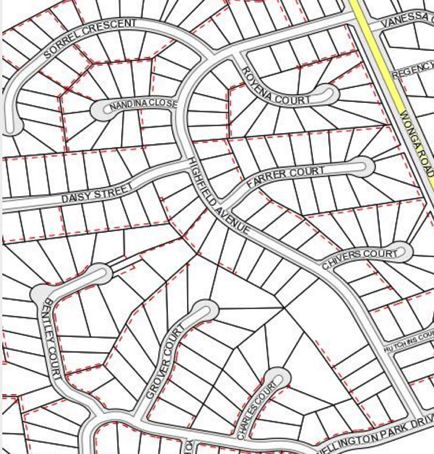
‘“Will in ten years, interest be any higher?”
  ‘He will tell you, “No!”
  ‘“Will the wages of the common labourer be any higher...?”
  ‘He will tell you, “No the wages of common labour will not be any higher...”
  ‘“What, then, will be higher?”
  ‘“Rent, the value of land!” Go, get yourself a piece of ground, and hold possession!”
  ‘And if, under such circumstances, you take his advice, you need do nothing more...’
The book started as a potential magazine article written to address the paradox of why
‘poverty’ rises in tandem with ‘progress.’

When it was published 17 months later in 1879 during an industrial depression, George’s
ideas electrified the world.

He had not only identified the underlying cause of the boom and bust cycle, George also
provided a practical remedy.

The book was an international bestseller.

It was translated into Chinese, Danish, Dutch, French, German, Hebrew, Hungarian, Italian,
Norwegian, Portuguese, Russian, Spanish, and Swedish.

At its epoch, it was rumoured to have outsold even the Bible.

Seven years later, Henry George beat Theodor Roosevelt to almost get elected as Mayor of
New York City — the financial capital of the nation.

                                    Henry George’s Gravesite

                                         Source: Phil Anderson

Chrystia Freeland, a current Canadian Liberal member of parliament, wrote this recently;

  ‘George ran for mayor of New York again in 1897, but died four days before election day.
    He was given a statesman’s send-off -- his coffin lay in state at Grand Central Station,
    where more than 100,000 people came to pay their respects. It was the largest crowd of
    mourners since Abraham Lincoln’s funeral in 1865.’

                                                   4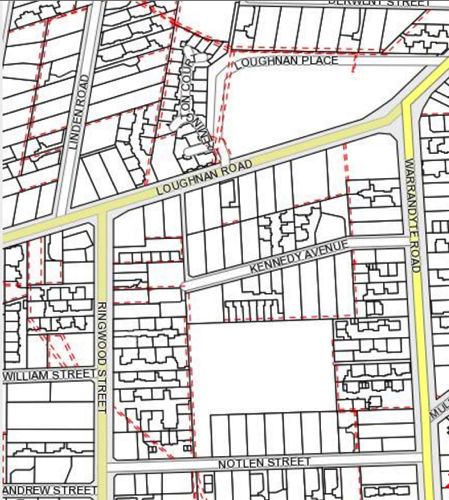
You can read the full version of her article here.

                            The corruption of economics
Henry George didn’t have the modern tools of today’s economists.

So why after 135 years don’t economists once again ‘see the cat’?

Economists Mason Gaffney and Fred Harrison detail the history clearly in their book The
Corruption of Economics.

So persuasive were George’s arguments that several influential economists set out on an
amply funded plan to suppress the knowledge that landowners were ‘reaping what they did
not sow.’

Overtime, ‘land’ and ‘unearned income’, were deliberately written out of the university
economics courses and textbooks.

The three factors of production were replaced with just two — labour and capital. Land had
disappeared from view. When we talk about increases in the value of land today, it is termed
‘capital gains.’

Except, real capital does not gain.

Capital is man-made — it depreciates in value with wear and tear.

Unlike land, capital’s supply can be increased with competition.

The only exception is when the owners of capital are granted monopoly power — such as
taxi licences for example. In contrast, land is fixed in location and therefore fixed in supply.

Taxes on capital reduce its supply and so distort economic activity. However, taxes on
land cannot reduce its supply. They merely reduce its value — falling on the landowner and
stripping away the unearned gains that would otherwise be privatised.

For this reason — and others — a land tax is the most hated tax.

You can’t avoid it, hide from it, or ship it overseas.

Therefore, conflating land with capital enables large landowners and their financiers, to
argue for lower taxes on capital — and therefore lower taxes on land.

Consequently, the economic rent from land becomes ‘income’ rather than ‘unearned
income’ and our cities become Monopoly boards enriching the rentiers whilst
impoverishing the tenants.

Which would you rather be?

                             Most modern debate is junk
The effect of this corruption of economics still impacts debate and policy today.

When Thomas Piketty released his magnum opus Capital in the Twenty-First Century it attracted
more attention than any other economics book in recent history.

                                                 5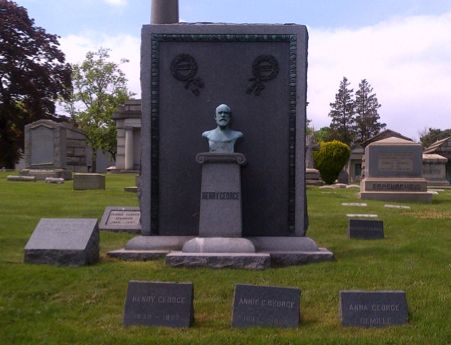
Praised by Nobel-prize winners and politicians alike, Piketty claimed to have produced a
‘new theoretical framework that affords a deeper understanding of the underlying mechanisms
of Capital and Inequality.’

According to Piketty, the world risks ‘terrifying consequences’ unless a global wealth tax is
implemented — a policy that requires universal recognition across country borders.

Without it Piketty argues that the accumulation of capital will become increasingly
concentrated in the hands of the rich, accentuating the inequality gap and keeping the
poor, poor.

However, Matt Rognlie, a 26-year-old US grad student completing his doctorate at the
Massachusetts Institute of Technology, hit the headlines by asserting that Piketty had ‘Got
it wrong!’

Rognlie split Piketty’s data between the net capital income from land, and the net capital
income from all other sources and noticed something shocking:

   ‘A single component of the capital stock—housing (land)—accounts for nearly 100% of
     the long-term increase in the capital/income ratio, and more than 100% of the long-term
     increase in the net capital share of income.’
In other words, it is land (not capital) that has taken all the gains.

Bloomberg declared it ‘a dramatic, startling insight that was somehow overlooked before
Rognlie came along.’

The Economist heralded it the ‘most serious and substantive critique that Mr Piketty’s work
has yet faced.’

However, now that you’re a subscriber of CT&F, this insight will not be surprising.

Rognlie had merely done what the classical economists had been doing for centuries before
him. He separated land from capital, and in doing so Rognlie ‘saw the cat’.

The reason I am telling you this, is because whatever your view on Henry George, he
demonstrated how changes to tax policy have the ability to either mute or inflate the
housing cycle.

                      The US state that didn’t boom or bust
Take Texas as an example — America’s ‘economic miracle sate.’

Forty-nine of the fifty US States currently employ 275,000 fewer Americans than they did at
the start of the recession seven years ago.

In contrast, Texas has added more than 1.25 million payroll jobs and more than 190,000
non-payroll jobs.

While other regions have been losing their population due to the US depression, Texas has
been growing faster than just about any other state in America.

Much of this can be attributed to its tax system. With no state income tax or corporation

                                                6
tax, Texas is a magnet for industry.
However, the state also has a history of collecting the economic rent from its land and
natural resources and using the funds for community investment.
For example, Texas has two mineral/oil sovereign wealth funds dating from the 1800s used
to support both secondary and tertiary education.
These are the oldest sovereign wealth funds in the world — financed from oil, gas, mineral
royalties and leases on land.
Furthermore, with no state income or corporation tax, Texas has shifted a larger burden of
its taxation onto property.
At between 2.5 to 3%, property taxes are higher in Texas compared to most other states
in America.
This has blunted land speculation and assisted in creating a truly decentralised city. In
Houston for example, only 7% of jobs are located ‘downtown.’
Along with liberal supply side measures, it has resulted in Texas containing some of the
most affordable land in America.
Put simply, Texas did not experience a real estate bust in 2008 because it did not experience
a real estate boom.
This saved its economy from the full magnitude of the worst US depression since the 1930s.

                            Source: Leith Van Onselen, macrobusiness.com.au

                             Australia’s real estate cycle
Australia is a long way from Texas geographically and politically.
Here the economic rent of land is enclosed and traded as a commodity. This means we
must have a cycle and it will repeat in set sequences.
However, just as tax policy can dent the cycle — so too can changes to policy inflate it.
Let’s go back in time to see this in action...
The last downturn in Australia was obscured. However you can see it quite clearly on the

                                                  7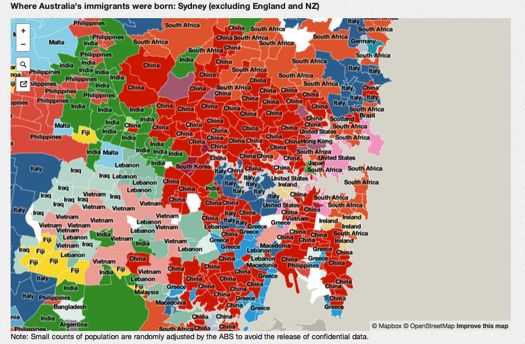
chart below, which shows the quarterly and annual percentage change in median house
prices between 1997 and 2015.

The thing to take note of here is the timing of housing policy changes within the context of
the 18 year cycle.
Phil teaches that Australia’s real estate cycle typically lags the US cycle by around 1–2 years.
After the recession in the early 1990s, Australia’s real estate prices didn’t bottom until 1996
— a year or so after the low in the USA.
America endured a mid-cycle recession officially from March 2001 to November 2001.
Real estate indexes dropped 25% between April 2002 and October 2002. In reaction, interest
rates were lowered to 1%, allowing house prices to reach a 15 year high in the first quarter
of 2003.
The mid cycle slump in Australia’s real estate values was not felt until 2004 when there was
a 30% drop in turnover — evidenced most strongly in Sydney and Melbourne.
Take this from The Age — in 2004:
   ‘The property bubble has burst! House and unit prices in particular are dropping in several
     capital cities, even in suburbs thought to be immune from falling property values.
   ‘Prices have fallen more than 10% in Sydney and almost 15% in Melbourne so far this year,
     according to the Reserve Bank of Australia (RBA). Auction clearance rates in Sydney and
     Melbourne have plunged to levels that some analysts describe as a crash...’
However, this was 7–8 years after the low in 1996 — right on time according to the real
estate clock. (Remember this in 2019/2020)
By 2005, prices were recovering — reaching all-time highs in 2007.
When the ‘shock’ of the GFC hit Australia in 2008 Treasurer Wayne Swan took a call from US
Treasury Secretary Hank Paulson.
   ‘Paulson: “Look...if we can avoid a meltdown in house prices, then we might be able to see
     a way through this,” he said. This was a big “if”, and I suspect the real motivation behind
     his call.
   ‘It seemed a dicey prospect that the health of the entire US economic system was

                                               8
underpinned by the housing market stabilising, given that it was the very stench of
toxic home loans that had, only a few months earlier, brought to their knees two of the
managed hedge funds run by Bear Stearns, one of America’s oldest investment banks.’
The message was clear — the real estate market was too big to fail.
Kevin Rudd did the only thing he could. Assisted by a decade long commodity boom, he
threw every last penny of Australia’s budgetary surplus (and then some) into supporting
land prices.
Strict rules on foreign investment were lifted, first homebuyers were gifted with grants in
excess of $30,000, and millions were poured into infrastructure upgrades.
As a result — the peak in the Australian real
estate cycle came right on queue, 14 years
after the 1996 low, in October 2010 — two to
three years post the peak in the USA.
There’s always a catch
Using policy to prevent a natural fall in house
prices does have its consequences however.
The current ‘boom’ is largely contained to
Sydney and Melbourne (for now). Other states
are not seeing the same gains.
The charts on the right compare the current
growth rate of each state — beginning mid-
2012 — with the second half of the last 18
year cycle, which took off in the early 2000s.
The red line is the current phase; the black line
is the previous phase.
The second half of the 18 year cycle is
typically stronger than the first half.
This is demonstrated on the charts above that
show strong price gains in each state between
2000 and 2004.
Just as the second half of the last cycle spread
into other states, so will the gains in this cycle —
once we’ve past the midway point.
Until then, high household debt and the
restructuring of the economy may continue
to subdue increases in some areas.
But let’s take a look at what’s driven the ‘housing
boom’ in Sydney and Melbourne so far...
Source: CoreLogic RP Data home value index 2015
9The Big Money in Little China
Follow These Two Maps to the Riches of the Biggest Wealth
Migration Since the 19th Century
Global investment bank Credit Suisse could not have coined it better when they stated:
‘The marginal buyer of Sydney and Melbourne real estate has changed, as have the drivers
of property prices.’
The report released in 2014 estimated that Chinese investors and newly arrived Chinese
immigrants would sink at least $44 billion into the Australian housing market over the next
seven years.
Following recent changes under the Australia-China free trade agreement, that estimate is
conservative at best.
In the previous seven years alone, Chinese buyers secured $24 billion worth of residential
real estate — with offshore purchasers currently snapping up an estimated one in eight new
home sales nationwide.
On a national scale, this would not unduly influence Australia’s land values any more than
investment flowing in from America, New Zealand and the UK for example.
Except money from China is increasingly pouring into select ‘land locked’ pockets of both
Sydney and Melbourne.
Aside from Brisbane, which ripples to some extent off Sydney, growth in the other states
and territories has been subdued.
The Driving Force Behind the Property Boom
Both Victoria and New South Wales capture over three quarters of the annual 1.1 million
Chinese born immigrants, and over the past 12 months alone, median house prices have
recorded a gross return of more than 11.10 and 9.5% respectively.
If you break this down to a suburb level, land values in each of Sydney and Melbourne’s
most populated Chinese communities have seen rocketing gains.
For example, Australia’s largest community of Chinese born residents in Hurstville, south
Sydney experienced a year on year median gain of 23.45%. Box Hill in Melbourne’s east has
had a 12-month median gain of 33%.
Put simply, both states lie in the path of the biggest, most rapid wealth migration the world
has seen in since America established itself as a global power.
It is not just the 1% of billionaires or corrupt Chinese officials seeking out havens abroad. It
is the rise of China’s consumer class. These are middle-income earners whose wealth goes
largely under-reported in China’s grey economy.
10In the offshore sector, Chinese citizens need to file a record with the tax authorities if
they go over the US$50,000 limit per year in overseas transactions.
However, in reality, this is no barrier in a country that currently leads the world in illicit
capital flows.
For the average Chinese citizen (or even foreign nationals working in China), the practical
difficulties of sending currency abroad are so complex and time consuming it all but
encourages residents to seek out ways to flout the law.
As reported in the New York Post in 2014, so much money was fleeing China — a whopping
$10 billion a month — it is distorting the global economy, leading to real-estate booms in
cities like New York.
Some of that wealth is still entering Australia through a number of ‘observable’ channels.
However, numerous loopholes in the law exist, and from my own experience they are
commonly exploited.
Why Chinese Billions Will Keep Coming
In some cases, Foreign Investor Review Board (FIRB) approval is not required. In others,
trust funds can easily obscure ownership.
Therefore, despite huff and puff from the Senate inquiry in relation to public concern over
offshore real estate investment, the recommended changes to the law will likely do nothing
to dampen demand.
This is because foreign investors and temporary residents will still be gifted with the
economic land rent (the capital gains) that invites speculation on our land in the first place.
As it stands:
• O
ffshore buyers and temporary visa holders can purchase an unlimited number of new
dwellings or established residential sites for development.
• T
emporary residents can additionally purchase an established home to live in —
providing they sell it upon exit. (Students commonly exploit this option and go onto gain
permanent residency.)
• O
ffshore investors purchasing $5 million in approved Australian assets over four years
(including, but not solely land) can obtain permanent residency under a Significant
Investor Visa.
• U
nder the new Premium Investor Visa, foreigners investing $15 million or more can gain
permanent residency in a year. These funds are said to be directed toward infrastructure
financing. The gains, however, will be captured in land.
• U
nder the Australia-China free trade agreement, foreign investment limits on Australian
commercial real estate will be increased from a current $54 million to $1.078 billion. This
effectively gives Chinese developers unfettered access to prime Australian land.
• F
inally, by far the biggest long-term driver comes from permanent migrants.
11In China, you can only purchase ‘use rights’ to land of around 75 years. To gain a mortgage
typically requires a 30-50% deposit and the quality of real estate is poor.
The incentive to pay the ‘marginal’ extra to secure an Australian house on a freehold title
(with a history of rising ‘capital growth’) is overwhelmingly strong in this demographic.
As an investor, this is the wave you must to park yourself in front of if you want to reap the
best economic gains.
Asian Money and the Land Boom
There is a common misperception that the Chinese favour new apartments. This is only due
to restrictions in the law. Offshore investors currently purchase up to 40% of Sydney and
Melbourne’s new supply.
Asian developers dominate the inner-city skyline. This is especially true in Melbourne where
zoning is less restrictive than Sydney and height-limits can easily be surpassed.
Offshore Developers Share of Melbourne Apartment Completions in Melbourne 2000 to 2016
Foreign developers are not subject to the same checks and balances that Australian banks
demand from locals. For example, they do not need to meet pre-sell targets before
funding is secured and are best placed to tap into the Asian sector.
This has prompted a flood of speculation into commercial and residential development
sites in the inner city regions creating the biggest construction cycle since the 1980s. All of
it is high-density development.
Only very recently, for example, an Asian developer snapped up a development site in
Leicester St, Carlton (just north of Melbourne’s CBD) at auction for $9.1 million — $4 million
more than its reserve price.
The auction attracted over 100 enquiries and six bidders — with bids increasing by
$100,000 increments.
12Land in Melbourne’s northern CBD’s precinct has quadrupled since the market peaked in
2007 — rising from around $8,000 per square metre, to over $31,000 in 2015.
A site in A’Beckett St North Melbourne that last changed hands in early 2007 for $1.457
million sold last year for $4.6 million. No improvements had been made in the interim.
The investors reportedly plan to land bank the property.
Consequently, the weight of money chasing assets in central Melbourne has reached
historic levels.
Melbourne’s new precincts at Fisherman’s bend along with areas of Port Melbourne and
South Melbourne have also been rezoned as ‘capital city’ zoning.
This means they effectively have no height limit. This has gifted windfall gains to existing
vendors. Land values have skyrocketed an estimated 500%. (Many of them Victorian state
Liberal Party politicians who bought up before the rezoning.)
Because CBD zoning makes little distinction between commercial and residential land, the
majority of these sites will end up as high-rise apartment blocks rather than office space.
The time it takes for high-density supply to reach the market is anywhere between three
and six years. Therefore, large volumes of stock will be released in clusters leading to an
inevitable overhang of vacancies.
Use This Indicator to Time Your Investments
The higher the price of land, the higher the building needs to be to get a viable return on yield.
This is important to understand because monitoring the opening of ‘the tallest’ can provide
clues for timing the cycle. You can find more details in a piece I wrote on the subject here.
Associate Professor Eric Ross at Al Akhawayn University in Ifrane in Morocco compiled a
graph that illustrates this trend.
Tall Buildings Usually Open in Downturn
Source: Eric Ross, Associate Professor of Geography at Al Akhawayn University in Ifrane, Morocco
In 2019, Australia 108, the largest residential tower in the Southern Hemisphere, will open
13its doors in Melbourne. Construction has already started, with the penthouse selling for a
record $25 million to a Chinese businessman based overseas. It coincides nicely with the
race to build the current ‘world’s tallest’.
Kingdom Tower in Jeddah, Saudi Arabia, and the Phoenix Towers in Wutan, China, are the
two projects in contention.
Kingdom Tower will be 1 kilometre tall. However, if all goes to plan, Phoenix Towers will pip
the title a few months later at just over 1 kilometre in height.
And now, just six years after unveiling the world’s tallest building, Dubai-based real estate
giant Emaar Properties announced it will build a skyscraper that will be taller than the
Burj Khalifa.
His Highness Sheikh Mohammed bin Rashid Al Maktoum proudly tweeted
““We have Burj Khalifa, the tallest globally, and Dubai Holding and Emaar launched
yesterday a tower that is higher than it, and time will not affect our dreams except
increase them in highness and glory.”
Who said Pride comes before a fall?
All the above towers are set to open late 2019 into 2020. As a result, 2020 will mark a period
of depressed economic activity. If you’re a savvy investor - it could be an excellent time to
buy land in preparation for the second half of the real estate cycle beginning 2021. CT&F will
guide you through this as we get closer to the time.
Steer Clear of This Danger
However, if you want to capture the best wave of investment from Asian buyers, steer clear
of apartments.
Melbourne is in a worse situation than Sydney. Gross rental yields have dropped to 3%, the
lowest across all capitals and the lowest on record.
Gross yields in Sydney are currently 3.4%, the lowest reading since 2005.
If you calculate property management and maintenance costs, investors are coming out
with a net yield of barely 1.5%.
Published vacancy rates are also high. You can search for vacancy rates by suburb with
SQM Research. SQM is the best and most reliable source for vacancy data.
A vacancy rate of 3% or greater indicates there is enough supply relative to demand to put
downward pressure on rents. It is a fairly good indicator.
Earlier this year the vacancy rate in central Sydney lifted marginally above 3% and Melbourne
it fluctuated higher than 5%. In thesurrounding suburbs the situation is often worse.
Abbotsford for example, bordering central Melbourne, had a vacancy rate earlier this year of 9%.
A Truth Hidden Behind the Numbers
14While vacancy rates provide clues to oversupplied markets, they don’t measure latent supply.
These are properties landlords are unwilling (or unable) to let.
The information is important for you because in a period of depressed economic activity, a
greater supply of withheld stock is likely to make its way onto the market. This depresses
prices and rents in the surrounding areas further.
This happened in Sydney during the GFC. Property investors unable to sell and needing
to generate income put a large number of units onto the market. Consequently, Sydney’s
vacancy rate ballooned from 1% in January 2008 to 6% in July 2009.
Sydney’s residential vacancy rate in 2008
Source: SQM Research
Current vacancy measures will not pick this data up.
I completed a report of Melbourne’s ‘speculative vacancies’, which identifies properties
withheld from the market for a period of 12 months or more.
The results are compiled using abnormally low water consumption figures, with the data
broken down by suburb to enable a detailed analysis.
As an investor, I would steer clear of any area where there is a large proportion of withheld
supply: The apartment market across many inner city suburbs is one such sector.
The results of the speculative vacancies report are likely to be mirrored in Sydney —
especially considering demand from investors currently exceeds 50% of the market.
15Put simply, we will run out of student renters before we run out of apartments.
New apartments are often promoted in property seminars because of the benefits that can
be claimed against taxable income — depreciation, for example, which is available for ‘plant
and equipment’ and ‘building allowance’ (for properties constructed post 1985.)
Additionally, some apartments carry one to three year rental guarantees that promise a
return above current market yields. The price is obviously elevated from the onset and when
the guarantee expires, you are left with a markedly lower yield.
What the Key Statistics Reveal
If you are only looking to reduce taxable income, then go ahead and buy. However, if you are
looking to achieve any ‘capital growth’ whatsoever, or even maintain value — buying a new
high-density apartment (generally sold off-plan) is little better than buying a new car.
On average, it takes six to 10 years before the nominal price paid can be equalled.
The tiny two bedroom apartments are barely more than 60 square metres, and the overall
quality is appalling.
To give an example — I assisted an investor who purchased a brand new unit in
Melbourne’s Ascot Vale in 2011 for $580,000, yet three years later it was valued at less than
$400,000. Buyer beware.
Even with smaller blocks of established apartments, you need to be careful.
Unfortunately, there is a myth promoted within the industry that a rising number of single person
households (oft quoted as ‘the fastest rising demographic’) coupled with a downsizing tsunami
of cash strapped buyers will increasingly force people into this type of accommodation.
First, single person households are no longer the fastest rising demographic.
Between the censuses of 2006 to 2011, single-person households dropped from 24.4 to 24.3%.
Additionally, for the first time in 100 years, the number of individuals per household has
increased. In 2006, there was an average of 2.4 people per dwelling in 2011 that number
had jumped to 2.66.
The shift may seem small; however, this figure is used to derive underlying housing
demand. Therefore, even a small upward movement of 0.01 persons over the period can
result in the underlying demand for housing dropping by around 25,000-30,000 homes.
The reason for the reduction in household size was initially due to an aging population of
divorcees and widows.
Also Consider...
There are numerous financial barriers to downsizing — stamp duty, asset tests, a lack of
suitable and affordable accommodation, for example. It is no surprise to hear our older
generation is more than happy to stay put. Those who need to access finance also have the
option of home equity release schemes.
16Therefore, the majority of single person households (around 48%) are rattling around in
three or four bedroom detached homes. They are not moving to apartments — and for that
matter, neither are families.
In fact, only 14% of one person households live in one bedroom apartments. Even among
those in their 20s to early 30s, apartment dwellers peak at the age of 27 and still only
account for 14% within this age bracket.
Demand from first homebuyers is also lacking. The average age an Australian first
homebuyer steps foot onto the mythological ‘property ladder’ is 33 years — once they have
found a partner. Therefore, the trend is to look for somewhere to start a family, and a small
one or two bedroom apartment often doesn’t cut it.
Investors purchase seven out of 10 apartments, so demand tends to wax and wane with
sentiment. For this reason, apartments have performed well over the short term, but over
the longer term, family housing and land has seen the biggest gains. In my opinion, that
will continue.
Families with children are our biggest buying demographic. If possible, you want to cater to
this sector. All the available data indicates they want land — not townhouses or apartments.
Obviously, housing and land require a bigger budget; therefore, if you are a unit buyer, focus
on the ideal downsizer accommodation. I suggest the small two and three bedroom single
level villa units that share a common driveway.
Prices can be fairly comparable to apartments, and demand flows in from a number of
sectors — investors, starter homebuyers, and the small proportion of downsizers who want
to stay close to the area they currently live.
Your Guide to the Migrant Wave
So where do you buy to potentially capture the biggest gains in Sydney and Melbourne over
this cycle?
You can monitor where Melbourne and Sydney’s recent immigrants were born on the
two maps below. The data is taken from the 2011 census and coloured to show the
predominate sectors.
17Melbourne’s Migrant Map
Sydney’s Migrant Map
The red areas contain established Chinese communities. Within these zones, the greatest
demand — and consequently price growth — has been for land and family housing situated
next to top education facilities.
18In Melbourne, this would include Glen Waverley and Mount Waverley.
The Glen Waverley Secondary College school zone attracts considerable demand. However,
prices are pushing families into the surrounding areas, so steer toward the Brentwood and
Highvale Secondary College school zones. Both offer comparatively good value for money.
In Sydney, suburbs such as Parramatta, Epping, Ryde, Hurstville and areas of the inner
west are rapidly expanding. Once again, look at swinging into the neighbouring suburbs to
capture the ripple and hold for the longer term.
If possible, you need to purchase these homes prior to auction. But timing is crucial.
Agents are trained to work their vendor’s expectation down as the auction day
approaches. So putting an offer on the table a couple of days prior — with the express
instruction that you will not be there on the day itself — can yield good results.
You will need to at least meet vendor expectation to get the process started; however,
negotiating outside of auction will give you much better control.
If you’re not familiar with the technicalities needed, employ someone who is.
Will China Crash Your Investment?
Some argue that falling iron-ore prices and a sharp drop in property values across China
could lead to a Chinese real estate collapse. This could then cause demand for Australian
property to stall.
Falling iron ore prices are significant for our economy. It is for this reason we have a stark
East/West divide in the current property cycle and it is something to keep an eye on.
This is partly based on the experience in the late 1980s when Japan became the world’s
largest creditor — with real estate the single largest component of Japanese foreign
direct investment.
Japanese money poured into prime real estate markets across the world, including Sydney
and the Gold Coast.
This is a newspaper article from The Canberra Times in May 1987. Change a few words and
it would suitably fit the mood today.
19History Repeating?
Source: Trove Newspaper Archives
When Japan’s economy collapsed in 1990 (at the end of the 18 year cycle), demand for
Australian real estate fell sharply. Many investors were forced to sell.
However, I don’t think the situation is quite the same.
While it’s hard to generalise about a property market as diverse and large as China’s,
anxieties over a potential collapse are likely overblown.
China has a large pool of household savings and remains markedly underleveraged
compared to other developing nations.
Needless to say, it is possible that structural changes currently underway in relation to
China’s slowdown — including a potential nationwide property tax — may have the adverse
effect of increasing demand for Australian real estate.
If things go bad in China, a rising number of families will look for somewhere better to live.
This is already occurring due to pollution concerns, fears over food security and the desire
to access better education facilities.
Should demand from Chinese buyers diminish, it is worth noting that India is following
closely in China’s footsteps. Economists now predict it will become the fastest growing of
Asia’s giants over the next decade.
India is our third strongest migrant sector and once again, the focus of investment is on
both Melbourne and Sydney.
20Don’t Doubt the Property Cycle Will Continue
All migration would be extremely beneficial for Australia’s economy and overall prosperity if
we collected the site-rent from land.
It certainly could prevent the inevitable disastrous collapse in the late 2020s you now see
coming. The country’s economy would thrive.
Unfortunately, we do not do this. Instead, we offer a true rentier economy. Investor and
housing tax exemptions are worth an estimated $36 billion a year.
It is for this reason that the property cycle must continue. Asian immigrants and an
increasing number of Asian offshore buyers will be a significant force for the duration.
And of course, government spending on infrastructure. That’s what we turn to next...
The Law of Absorption
Why Select Melbourne Land Owners Will See
Gains Between 30 to 120%
In May 2015, the Victorian State government released its budget. Here’s what nobody will tell
you: it promises to be a bumper ‘Christmas in July’ for Melbourne’s inner city landowners.
The expansive list of infrastructure projects include:
• $2.4 billion for level crossing removals
• $1.3 billion for 37 new High Capacity Metro Trains
• $274 million for 20 E-Class trams
• $257 million for 21 VLocity carriages
• $90 million for five new X’Trapolis trains
• $50 million for an Interface Councils Infrastructure Fund
• $1.5 billion to commence work on the Melbourne Metro Rail Project
• $13 million for Frankston Station precinct
• $9 million for Mernda Rail Link
• $50 million for all-night public transport trial on weekends
• $110 million to duplicate the Chandler Highway bridge over the Yarra River
• $40 million for the first stage of the West Gate Distributor project
• $273 million for City Link Tulla Widening project
• $150 million for the next stage of the M80 upgrade
Needless to say, the taxes to meet the $11 billion funding shortfall will come from labour
(wages) — not land.
21Big-ticket items for landowners include the upgrades and extensions to the existing rail
network — including the Melbourne Metro Rail Project.
The plan is to deliver two 9-kilometre rail tunnels from South Kensington to South Yarra via
the CBD.
This will include five new underground stations — Arden, Parkville, CBD North, CBD South
and Domain.
See the plan here...
Source: Department of Economic Development, Jobs, Transport and Resources
Numerous academic studies have been undertaken analysing the velocity of real estate
gains following improvements to public transport.
Economist Fred Harrison calls this the ‘Law of Absorption’.
22However, you won’t find any of the results discussed in government releases, or else it
would reveal who the real beneficiaries are.
Findings show the likelihood of windfall gains in the order of 30–120% for residential and
commercial property in surrounding areas.
The difference in price is dependent on proximity to the train station. Bear in mind, being too
close (i.e. opposite or abutting the train line) is no better than being too far.
You Have to Know When to Buy
The biggest gains, percentage wise, will be prior to construction and
following completion.
During the construction phase, noise and road works will detract buyers and disrupt
business — sometimes this can provide an opportunity to buy in.
For example in Sydney, the Epping–Chatswood rail link opened in 2009 providing the first
post-Olympics addition to the City-Rail network.
Repeat sales analysis over the period of construction showed double-digit price growth
in the surrounding areas two years prior, and two years following completion (34% and
30% respectively).
During the construction phase however, prices dropped into negative territory and did not
pick up until the station neared completion in 2008.
It should be noted that these results were in stark contrast to the rest of Sydney and local
government area. They experienced low to negative rates of growth over the same time span.
International studies have evidenced similar results elsewhere.
In the case of the Melbourne Metro tunnel, an estimated 56 houses, 291 apartments and
townhouses and 15,000 square metres of parkland will need to be bulldozed.
Additionally, approximately 174 businesses in high-rises will be forced out and 44
commercial buildings razed.
Areas around Federation Square and Flinders St Station will be severely affected. Fawkner
Park will be torn up and the hospital precinct will be disrupted. The alignment down
Swanston St will result in lengthy road closures.
Early morning road works will be a nightmare for existing residents and some will
inevitably want to sell. Keep your eyes open for opportunities as you monitor the market.
The removal of level crossings (also referenced in the list above) will additionally affect
house prices. However, for some homes, it could take away their existing premium.
For example, buyers will spend a good deal extra trying to purchase a home on the side of
the rail line that offers an easier commute to the city without getting caught at the crossing.
Taking away the crossing disperses that bias.
23The Coming Land Boom
But let me stress that these developments are exceedingly bullish for Melbourne’s cycle.
In the short term it will also assist Melbourne’s 6.6% unemployment rate. The Metro Tunnel
project starts late 2018 and is due for completion 2026.
The dates fall close to, and on, turning points in the cycle and will increase its volatility in
these regions.
The infrastructure investments will be capitalised into higher land values and speculation
will further boost it.
The city’s planning laws contribute further.
Melbourne has a permanent urban boundary to stop ‘urban sprawl.’ In reality it simply
increases sprawl, as buyers and businesses need to go further afield to find cheap sites.
Nevertheless, there is no incentive to release this land in Victoria.
The last Planning Minister, Matthew Guy, issued a blanket exemption from State Land
Tax for all land within the urban boundary — even ‘shovel ready’ land in zones ready
for development.
Developers can sit on the sites for as long as they like. The insiders who are well connected
to the bureaucratic process know just how to work the system to their mutual advantage to
gain large rezoning windfalls.
With zoning regulations concentrating a larger number of residents into limited areas of
supply, it brings yet another coup for land owners — namely urban density.
Increased height limits capitalise into higher land values — driving offshore speculation and
fuelling a boom in demand.
In a moment I’ll hone in on the buying opportunities.
However, before I go any further, it is worth taking a step back and questioning the validity
of the project — as it may affect future cycles.
Still, if you want to take advantage of it — you need to know what, and where to buy.
Buy the Only Thing Becoming a Rarity in Melbourne
Many real estate investment advisors recommend purchasing an apartment.
However, common sense tells you that you will not gain from the boom buying
accommodation that is rapidly increasing in supply
To get an idea of the sheer scale of high-density development in Melbourne town, take a
look at the city’s development monitor.
For the first time in its history — Melbourne is building more apartments in established
areas, than houses on the urban fringe.
24Source: .id demographers
In short – the only thing becoming a rarity in Melbourne is land.
You have to travel a good 15km or more southeast of the CBD to find a 600 square metre
block for much less than $1 million — and competition is fierce.
However, between 7 to 12km north and west of the CBD, you can find full blocks of land
between approximately $600,000–800,000.
The west of Melbourne still has a significant amount of land yet to be released.
It is ear-marked for Greenfield Development and the extra supply risks denting land price
gains. It also has comparatively higher unemployment (over 8%).
However, the inner north and north east of the city has already been built out and holds
better opportunities.
For example, the floor plan below belongs to a property that is situated in Reservoir, just
12km north of the CBD.
25Source: REIV Property Data Online
Suburbs surrounding Reservoir such as Preston, Pascoe Vale and (6km closer to the CBD)
Northcote, Thornbury and Brunswick, now attract prices pushing close to, and in excess of
$1 million.
However, the property above sold in a few months ago for $615,000.
It is well connected — walking distance to two train stations that lead directly into the CBD
in less than 30 minutes, schools and a well facilitated shopping centre.
Importantly, the home holds good development potential.
For example — the back yard is big enough to construct a unit at the rear.
A builder wanting to do this immediately could ideally negotiate a purchase with a long
settlement, and obtain the necessary plans and permits during the settlement period.
To assist with cash flow, the front property can be rented whilst
development commences.
Under this scenario, the developer has obtained two properties — but only paid stamp duty
on one.
Assuming the unit would achieve a sales price of at least $400,000, it is a saving of
around $20,000.
For a buyer not wanting to develop, they have the option of subdividing and selling off the
backyard at some future point should they need access to funds.
26Just obtaining planning permits for a rear unit alone, would increase the site’s value without
needing to build a thing. The possibilities are numerous.
There are a number of opportunities such as this north of the city. However, the area is
gentrifying quickly. Land is being subdivided and well-situated sites are fast diminishing.
To take advantage of these opportunities, you’ll need strong negotiation skills and a good
sense of value.
Previously, buyers wanting access to a property’s sales history, have had to pay private
companies lofty fees for the privilege. However, this is now changing.
A good friend of mine, Louis Christopher of SQM Research, has launched a new service
providing free sales history of all properties Australia wide.
The results are up to date and the data offers a good starting point for your research. It will
help establish where to set your limitations.
There are many other free indicators on the SQM Research website — including vacancy
rates by suburb, so be sure to check it out.
The Suburban Land Rush
Happening Now
‘I know we’ve come a long way,
We’re changing day to day,
But tell me, where do the children play?’
Cat Stevens
It’s the Australian icon that’s slowly disappearing...
Young homeowners still want one. Kids still love to roam and play inside them.
They were once in abundance across Australia. But slowly they’re going the way of the Dodo.
We’re talking about the suburban backyard.
In 2007, Professor Tony Hall of Griffith University’s Urban Research Program published a
paper entitled ‘Where have all the Garden’s Gone?’
The report attracted scant publicity at the time.
The property industry ignored it altogether.
Yet it contains some vital information you need to know as a property investor.
In fact, the key to profiting over the course of this property cycle could lay right under your
feet — in your own backyard.
27The green old suburbs versus the barren new
Up until the end of the 1980s, the vast majority of suburban houses constructed in Australia
had sizeable backyards. Of around 150–300 square metres, at least.
This type of housing is still visible in some middle city suburbs of the major capitals.
The houses are single story. The footprint of the building occupies no more than
approximately 30% of the overall area.
The dwellings are diverse in style, with tree lined streets and ample green foliage enhancing
their appeal.
The middle ring suburbs where the old suburban houses can still be found are well
furnished with family amenities.
They attract high-income buyers able to afford the premium for homes with ample green
areas for their children to play.
However, this pattern of development is in stark contrast to properties being constructed in
new estates on the fringes of each capital city today.
Within the past 10 years private amenity space has largely vanished from the rear of new
suburban houses in Australia. This is because the developers are taking the land value
increases now. They’re not letting you claim it any longer.
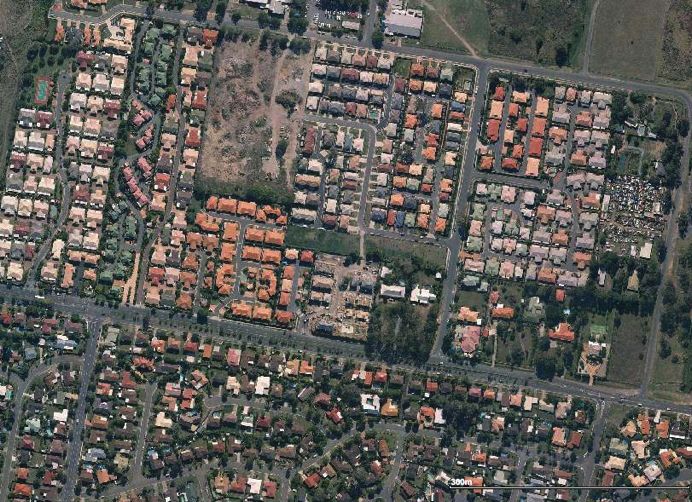
A great example of this is revealed by an aerial view of a new estate in Carina, 8.5km south-
east of Brisbane.
You can clearly see the difference between the older style post war suburban houses on the
bottom third of the map, compared to the new estate toward the top.
28Another example is the suburb of Tarneit, 25km west of Melbourne.
The houses are uniform in design — primarily built by a single builder. The footprint of the
house takes up approximately 60% of the block.
The backyards have vanished. There are no longer private areas for children to play.
There is an abundance of land yet to be subdivided in the fringe estates. However, builders
maximise the potential return they can get from each sale by increasing the size of the
house, rather than the size of the subdivision.
These houses are tightly packed together. There are very few fringe ‘house and land’
packages available on land sizes of 550sqm or more.
Most are on less than 450sqm and, in the major capitals, these typically market at around
$400,000–450,000.
As such, they attract a low-income demographic. Typically young couples that cannot
afford to live where their parents do.
29Instead, they’re crammed into areas lacking in essential infrastructure and family facilities
to cope with the incoming population.
It paints an unfortunate picture of social polarisation. Unemployment rates are
comparatively higher as a consequence. Hence, these are not good suburbs for investment.
Don’t believe this bogus mainstream assumption
Mainstream property investment magazines will have you believe that the smaller blocks
are due to buyer preference.
Apparently, residents no longer want backyards. If you believe the hype, new homebuyers
want concreted courtyards, a balcony, or a communal rooftop garden.
Apparently a secure outdoor place for children to play is old fashioned, as is gardening
and nature.
Regardless, large-scale production of new suburban housing on 600sqm blocks completely
ceased around 10 years ago. The traditionally Aussie backyard has disappeared from view.
New family homes have been replaced with ‘cookie cutter’ style ‘Noddy’ houses — each
indistinguishable from the next.
But I am finding that the biggest buying demographic WANT BACKYARDS.
The real reason for the change in trend
There’s a reason young buyers with families can’t afford backyards.
Much of the blame lies at the foot of our urban land policies.
Politicians have consistently pushed through laws that increase the economic rent of land
(and hence the price) under the guise of ‘sustainable development’.
As we will show you in your next issue, there are thousands of properties across the
expanse of Melbourne sitting vacant with little to no holding costs to encourage use.
Anecdotal evidence points to the same in the other major capitals.
Politicians gain political power by enriching the country’s landowners. Landowners gain a
financial benefit from the rezoning windfalls.
Advocacy groups are continually fooled into thinking that ‘higher density equals lower
prices’, and applaud it.
The best way to grow smart is to ensure the existing land is utilised effectively. That does
not happen under current policies. So...
This is what matters for you as an investor
The pressure of demand on the diminishing number of detached dwellings in established
suburbs is evident in the statistics.
30Whilst rental yields for units are stagnating at best, rents for the old suburban house on a
quarter acre block are doing the opposite.
For example, Warranwood has the fastest growing median house rent in Melbourne at $500
per week.
Warranwood is situated 27km north-east of Melbourne’s CBD, close to the suburbs of
Warrandyte and Ringwood.
The suburb features detached family homes on large unbroken land blocks in quiet
residential streets.
Here is a subdivision map of a few streets in Warranwood to give you an idea.
In contrast, land in the neighbouring suburb of Ringwood has been increasingly broken up
31into subdivisions of 2–5+ per site as the population expands.
Below is a sub-division map of Ringwood to demonstrate.
This trend is occurring in popular middle-city suburbs across Australia. They are regions
rich in family facilities — good schools, parks and public transport infrastructure. Unlike the
fringe estates, there is no surplus land available.
New buyers desiring an inner city lifestyle are typically being restricted to apartment style
living, or small townhouses.
To accommodate KIPPERS (Kids in Parents Pockets Eroding Retirement Savings) staying in
the family home longer, existing houses have been extended outwards and upwards.
321. T
hat means, if you’re lucky enough to already own a block of land with a backyard in
the metropolitan region, you’re holding a valuable asset that is fast diminishing in supply.
2. O
therwise, as a buyer, look for this type of block.
Detached dwellings on 600+ sqm blocks of land will increase in price substantially over the course
of this cycle.
Your first strategy to monetise your land
OK those are the facts. It’s happening whether we like it or not. And whether new residents
want it or not. You can sit back and whinge about it, or get on board and capitalise on it.
Read on, for your investment strategy...
The options for releasing your equity in these properties are numerous now, and should
improve even further into the cycle.
First, consider subdividing your block.
For example, on the plan below, you can see that the neighbouring property to 63 Miranda
Road (Reservoir, Melbourne) has been subdivided into four units (all two-bedrooms.)
33In this location (Melbourne), new villa units on subdivisions of 4 or more market for
approximately $400,000–420,000.
An old house on a 600–650sqm block of land will sell for low to mid $600,000s.
As a rough rule of thumb, buyers will pay around the same price for a newly designed home
on half a block of land, as they will for a dated original detached house on a full block.
Additionally, many of the sites have existing houses set far enough toward the front of the
block to allow subdivision at the rear.
For example, the floor plan below belongs to a property that is situated in Reservoir, just
12km north of Melbourne’s CBD.
Source: REIV Property Data Online
34You can also read