The Design and Implementation Ocelot's Dynamic Binary Translator from PTX to Multi-Core x86
←
→
Page content transcription
If your browser does not render page correctly, please read the page content below
The Design and Implementation Ocelot’s Dynamic
  Binary Translator from PTX to Multi-Core x86
                                                        Gregory Diamos
                                         School of Electrical and Computer Engineering
                                                Georgia Institute of Technology
                                                 Atlanta, Georgia 30332–0250
                                                  gregory.diamos@gatech.edu

   Abstract—Ocelot is a dynamic compilation framework de-           community, which has almost uniformly adopted a bulk-
signed to map the explicitly parallel PTX execution model           synchronous [6] programming model [7]–[9] coupled with
used by NVIDIA CUDA applications onto diverse many-core             architectures that simultaneously mextend many-core to its
architectures. Ocelot includes a dynamic binary translator from
PTX to many-core processors that leverages the LLVM code            limits while abandoning global cache coherence and strong
generator to target x86. The binary translator is able to execute   memory consistency [9]–[12]. Unfortunately, this body of
CUDA applications without recompilation and Ocelot can in           work has largely ignored the impact of these new programming
fact dynamically switch between execution on an NVIDIA GPU          paradigms and architectures on the aspects of compiler design.
and a many-core CPU. It has been validated against over 100            Moving to an explicitly parallel, bulk-synchronous program-
applications taken from the CUDA SDK [1], the UIUC Parboil
benchmarks [2], the Virginia Rodinia benchmarks [3], the GPU-       ming model significantly changes the problem presented to a
VSIPL signal and image processing library [4], and several          compiler; selecting a many-core architecture with a varying
domain specific applications.                                       distribution of hardware resources significantly changes its
   This paper presents a detailed description of the implemen-      target. Whereas compilers for sequential or implicitly parallel
tation of our binary translator highlighting design decisions       programming models were required to automatically extract
and trade-offs, and showcasing their effect on application per-
formance. We explore several code transformations that are          instruction or thread level parallelism from applications, com-
applicable only when translating explicitly parallel applications   pilers for explicitly parallel applications must reduce the
and suggest additional optimization passes that may be useful       degree of parallelism to match the resources available in a
to this class of applications. We expect this study to inform the   given processor. This fundamental change in the problem def-
design of compilation tools for explicitly parallel programming     inition coupled with the additional constructs for dealing with
models (such as OpenCL) as well as future CPU and GPU
architectures.                                                      parallel execution that are made visible to the compiler will
                                                                    effect a significant change in the design of future compilers.
                      I. I NTRODUCTION                                 Scalable bulk-synchronous applications will also require
   A blind embrace of the many-core revolution has resulted         just-in-time compilation and binary translation. Whether bi-
in a surplus of applications that can no longer fully utilize       nary translation is done using hardware decoders as in modern
the resources available in modern processors. Applications that     Intel and AMD x86 [13], [14] processors or in software as in
could once leverage frequency and ILP scaling to transparently      NVIDIA GPUs [7], the evolution of the processor michroar-
improve performance are now confined to a single core: they         chitecture in response to circuit and technology constraints
are restricted to an amount of chip area that is shrinking with     will mandate changes in the hardware/software interface.
Moore’s law. A pursuit of this lost scalability has lead to a       Binary translation will be necessary to bridge this gap, but
frantic transition towards many-core architectures with only        it will not be enough alone to ensure high performance
an afterthought given to the programming models that will           on future architectures. Dynamic compilation and life-long
follow behind.                                                      program optimization will be needed to traverse the space of
   Most parallel programming models are not up to the task.         program transformations and fit the degree of parallelism to the
Those that rely on heavy-weight threads and coherent shared         capabilities of future architectures that have yet to be designed.
memory will not be scalable due to excessive synchronization           Ocelot provides a framework for evaluating extent of these
overheads [5] and per-thread state explosion. Yet these are the     changes to compiler design by leveraging the explicitly parallel
most commercially prevalent models.                                 PTX execution model. We have completed a comprehensive
   Designing applications that perform well on modern as well       dynamic compiler infrastructure for PTX including PTX to
as future architectures can no longer be an afterthought that       PTX transformations as well as backend targets for NVIDIA
is passed off to processor architects and circuit designers. It     GPUs and many-core CPUs. In this paper, we explore the
must be a principle requirement that is addressed explicitly        detailed design and implementation of our many-core CPU
in the programming language, execution model, compilation           backend. Our intent is to expose the unique problems presented
chain, and the hardware architecture. Much of the progress          while compiling explicitly parallel execution models to many-
made towards this goal has been pioneered by the graphics           core architectures and evaluate several potential solutions.
Organization. This paper is organized as follows. Section vector widths to be specified explicitly, the aforementioned
II gives background on Ocelot. Section III describes the im- techniques allow PTX to be automatically mapped onto SIMD
plementation of the PTX to x86 dynamic compiler. Section IV units of different sizes. In the next section, we describe
presents performance results using the x86 backend. Section how these abstractions, which were intended to scale across
VI reviews the most significant lessons learned. Section V future GPU architectures, can be mapped to many-core CPU
briefly covers related work and Section VIII concludes with architectures as well.
suggestions for future compilers.
B. Mapping The Model To A Machine
II. O CELOT AND PTX The goal of Ocelot is to provide a just-in-time compiler
Ocelot is an open source project developed by the authors of framework for mapping the PTX BSP model onto a variety of
this paper. It is intended to provide a set of binary translation many-core processor architectures. This topic has previously
tools from PTX to diverse many-core architectures. It currently been explored from two complementary perspectives: 1) a
includes an internal representation for PTX, a PTX parser and static compiler from CUDA to multi-core x86 described in
assembly emitter, a set of PTX to PTX transformation passes, Stratton et al. [16] and extended by the same authors in [17],
a PTX emulator, a dynamic compiler to many-core CPUs, a and 2) our previous work exploring the dynamic translation
dynamic compiler to NVIDIA GPUs, and an implementation of PTX to Cell [18], and our characterization of the dynamic
of the CUDA runtime. Our emulator, many-core compiler, and behavior of PTX workloads [19]. From this body of work, we
GPU compiler support the full ptx1.4 specification and have drew the following insights that influenced the design of our
been validated against over 100 CUDA applications. PTX to x86 dynamic compiler:
This section covers the salient of features of PTX that make • From MCUDA: PTX threads within the same CTA can
it a suitable intermediate representation for many-core CPUs be compressed into a series of loops between barriers.
and dynamic compilation. • From our PTX to Cell work: Performing the compilation
immediately before a kernel is executed allows the num-
A. A Bulk-Synchronous Execution Model
ber and configuration of threads to be used to optimize
We speculate that PTX and CUDA grew out of the de- the generated code.
velopment of Bulk-Synchronous Parallel (BSP) programming • From our analysis of PTX kernels: Dynamic program
models first identified by Valiant [6]. PTX defines an execution behavior such as branch divergence, memory intensity,
model where an entire application is composed of a series inter-thread data-flow, and activity factor can influence
of multi-threaded kernels. Kernels are composed of parallel the optimal mapping from PTX to a particular machine.
work-units called Concurrent-Thread-Arrays (CTAs), each of
which can be executed in any order subject to an implicit C. Thread Fusion
barrier between kernel launches. This makes the PTX model Mapping CTAs in a PTX program onto set of parallel
incredibly similar to the original formulation of the BSP processor is a relatively simple problem because the execution
programming model. model semantics allow CTAs to be executed in any order. A
The primary advantage of the BSP model is that it allows straightforward approach can simply iterate over the set of
an application to be specified with an amount of parallelism CTAs in a kernel and execute them one at a time. Threads
that is much larger than the number of physical processors within a CTA present a different problem because they are al-
without incurring excessive synchronization overheads. In the lowed to synchronize via a local barrier operation. In MCUDA,
case of PTX, a program can launch up to 232 CTAs per Stratton et al. suggested that this problem could be addressed
kernel. CTAs can update a shared global memory space that by beginning with a single loop over all threads and traversing
is made consistent across kernel launches, but they cannot the AST to apply ”deep thread fusion” at barriers to partition
reliably communicate within a kernel. Like BSP programs, the program into several smaller loops. Processing the loops
these characteristics ensure that PTX programs can express one at a time would enforce the semantics of the barrier while
a large amount of parallelism that can be efficiently mapped retaining a single-thread of execution. Finally, ”universal” or
onto a machine with a smaller number of processors while ”selective” replication could be used to allocate thread-local
only periodically having to incur an expensive global barrier storage for variables that are alive across barriers.
to make memory consistent. MCUDA works at the CUDA source and AST level, while
As a final point, PTX extends the BSP model to support our implementation works at the PTX and CFG level. How-
efficient mapping onto SIMD architectures by introducing ever, our approach applies the same concept of fusing PTX
an additional level of hierarchy that partitions CTAs into threads into a series of loops that do not violate the PTX
threads. Threads within a CTA can be mapped with relative barrier semantics and replicating thread local data.
ease onto a hardware SIMD pipeline using a combination
of hardware support for predication, a thread context stack, D. Just-In-Time Compilation
and compiler support for identifying reconverge points at The diversity of possible many-core architectures makes
control-independent code [15]. In contrast with other popular static compilation for PTX at the very least overly general: any
programming models for SIMD architectures which require change in architecture or input data could change the optimalthread mapping scheme, schedule of generated code, or layout
of variables in memory. With the ability of the compiler to
fuse threads together [16], [20], redefine which threads are
mapped to the same SIMD units [15], re-schedule code to trade
off chache misses and register spills [21], and migrate code
across heterogeneous targets [18], recompiling an application
with detailed knowledge of the system being executed on and
a dynamic profile can result in significant performance and
portability gains.
In the context of this paper, dynamic compilation is used
primarily from a portability perspective to execute the same
CUDA programs on both NVIDIA GPUs and x86 CPUs. We
also highlight the significant differences between optimization
for CPU and GPU architectures that can be used in future
work dynamically map the same program to one of several Fig. 1. Extracting a Binary From a CUDA Application
possible architectures.
E. Profile-Aware Compilation reference libcudart.so. We include a detailed description here
for the benefit of others.
In previous work, we identified several metrics that can be
Rather than emitting PTX in binary format stored in the
used to characterize the behavior of PTX applications [19].
.text section of an ELF or Window binary, the CUDA com-
For example, we identified the amount of SIMD and MIMD
piler (NVCC) performs a source-to-source transformation that
parallelism in an application, control flow divergence, memory
converts CUDA source files into C++ source files. All of the
access patterns, and inter-thread data sharing. Bakhoda et al.
CUDA kernels are compiled by NVCC into PTX and all of
[22] and Collage et al. [23] take a more architecture-centric
the native C++ code is copied directly over. NVCC creates
approach by showing the impact of caches, interconnect, and
a global variable (referred to as a fatBinary in the CUDA
pipeline organization on specific workloads. Taken together,
headers) containing PTX assembly code for each CUDA
this body of work provides basis for identifying memory
kernel and inserts it directly into the generated C++ source file.
access patterns, control flow divergence, and data sharing
It also creates one global constructor for each CUDA kernel
among threads as key determinants of performance in PTX
that makes a call into the CUDA Runtime API to register the
programs. Our implementation of Ocelot’s many-core backend
global variable. The native C++ compiler is then invoked to
focuses on efficiently handling these key areas.
generate a native binary.
In addition to revisiting the insights provided by previous
This approach has the advantage of not requiring a different
work, our implementation exposed several other problems not
backend to support different binary formats: the native com-
addressed in prior work, most significantly 1) on-chip memory
piler is responsible for generating the binary. However, it also
pressure, 2) context-switch overhead, and 3) variable CTA
makes it nearly impossible to statically extract a PTX binary
execution time.
from a CUDA program because the assembly code will be
stored in the program data section and it will be impossible to
III. I MPLEMENTATION
distinguish between PTX binaries and generic global variables
This section covers the specific details of our PTX to x86 until the program is executed. Ocelot includes an implemen-
many-core dynamic compiler. At a high level, the process can tation of the CUDA Runtime API which intercepts the global
be broken down into the following operations: 1) extracting constructors that register each CUDA kernel. This process is
the PTX binary from a CUDA application, 2) performing shown in Figure 1.
transformations at the PTX level to create a form that is Unfortunately, as a consequence of the design of CUDA,
representable in LLVM, 3) translation from PTX to LLVM, it is not currently possible for us to either modify the PTX
4) LLVM optimizations, 5) laying out memory and setting up stored in a CUDA program nor insert translated code into a
the execution environment, and 6) initializing the runtime that preexisting binary. This forces us to re-translate each kernel
executes the program on a many-core processor. every time the program is executed. This is common practice
for most binary translators [24]–[27], but it does introduce
A. PTX Binary Extraction some overhead each time a program is executed.
The first step in executing a CUDA program using Ocelot
is to extract the PTX binaries from the CUDA program so B. Building The PTX IR
that they can be translated. This process is very convoluted as After PTX assembly programs are registered with the Ocelot
an artifact of the design of CUDA. It is also not currently runtime, our implementation will parse each PTX program
documented at the time that this paper was written; our and build an abstract syntax tree (AST) for the file. The
implementation was done by reverse engineering NVIDIA’s AST is incredibly simple because the PTX assembly languageonly supports a few syntactical constructs with no nesting. in partial SSA form (infinite registers but no phi nodes).
However, it is helpful for simplifying the implementation of Conversion to full SSA form is done using the live-in and
the parser which can handle multiple passes by first generating live-out sets for each basic block where each live in register
the AST in a single pass and then traversing the AST to resolve is converted into a phi instruction. As PTX does not have
labels and variable names. a concept of a PHI instruction, these are maintained in the
Once the AST has been generated, a Module is created for separately in the data flow graph rather than the control flow
each distinct AST. Ocelot borrows the concept of a Module graph.
from LLVM [28] which contains a set of global variables and LLVM requires kernels to be in full SSA form, so all trans-
functions. Similarly, our concept of a Module contains a set lated kernels are converted into this form before translation.
of global data and texture variables which are shared among a Alternatively, it would be possibly to avoid this conversion
set of kernels. The portions of the AST belonging to distinct stage using the LLVM Mem2Reg pass and treat all registers
kernels are partitioned and the series of instructions within as local variables. We chose not to use this optimization due
each kernel are used to construct a control flow graph for to the desirability of performing optimizations at the PTX
each kernel. level, which could benefit from SSA form. Mem2Reg claims
Once this process has finished, there will be one Module to be extremely high performance (possibly better than our
for each fat binary. Within each module, there will be one implementation) so we may investigate this in the future if
control flow graph for each kernel. Our implementation of the performance of SSA conversion is ever determined to be
a control flow graph does not contain any detailed analysis significant.
information. If any of the later transformations require data- Reversing If-Conversion. LLVM does not support predica-
flow, dominance, or mappings from identifiers to register tion at all. Instead it includes a conditional select instruction
values these analyses will be lazily performed upon their first similar to the PTX selp instruction. In order to handle PTX
use. code that uses predicated instructions that update variables (as
opposed to predicated branches which do not conditionally
C. PTX to PTX Transformations update registers), we must convert from predicated instructions
Once we have constructed the previously defined data- in PTX to select instructions in LLVM. However, SSA form
structures for program analysis, it becomes possible to perform significantly complicates the conversion from predication to
code transformations on PTX programs. During translation conditional selection.
to LLVM, we lose concepts associated with the PTX thread Consider the following example PTX code before convert-
hierarchy such as barriers, atomic operations, votes, as well ing into SSA form.
as the exact number and organization of threads. Although ld.param.s32 r0, [condition];
we do not perform any additional optimizations using this mov.s32 r1, 0;
information, we wanted our design to support doing these setp.ne.s32 p0, r0, r1;
optimizations at this stage rather than within the LLVM @p0 add.s32 r1, r1, 1;
infrastructure.
In order to support PTX transformations, we created an After converting into SSA form, the destination of the add
optimization pass interface similar to that used by LLVM instruction is assigned a new register (r2).
where different optimization ”Passes” can be applied to a ld.param.s32 r0, [condition];
Module, a Kernel, or a basic block. This design is motivated mov.s32 r1, 0;
by the idea that a manager can orchestrate the execution of setp.ne.s32 p0, r0, r1;
a series of optimization passes in a way that improves the @p0 add.s32 r2, r1, 1;
performance of generated code or improves the performance
of the optimizer. For example, the optimizer could apply the Now, converting the predicated add instruction to a regular
series of passes to each block before moving on to the next add followed by a conditional select instruction becomes
one to improve the locality of data accessed. problematic.
Using this infrastructure, we implemented two PTX opti- @p0 add.s32 r2, r1, 1;
mizations that eased the translation process to LLVM. In par-
ticular, we found it difficult to support predication and barriers The orignal prediicated add instruction could map to a non-
after translation to LLVM. Instead, we perform transforma- predicated add paired with a select.
tions at the PTX level to convert predication to conditional add.s32 temp, r1, 1;
selection and modify the control flow structure such that the selp.s32, r2, temp, ????, p0;
semantics of a barrier are satisfied even when executing the
However, it is not possible to easily determine what to set
program with a single thread.
the value of r2 to if the predicate is not true. It is much simpler
PTX SSA Form. For any individual PTX kernel, the data-
to insert conditional select instructions before converting into
flow graph retains information at the basic block level in
SSA form.
the form of live-in and live-out register sets. These sets are
computed using iterative data flow. A PTX kernel begins ld.param.s32 r0, [condition];Fig. 2. Example of PTX Barrier Conversion
mov.s32 r1, 0; is the barrier resume point. Note that two live registers are
setp.ne.s32 p0, r0, r1; saved at the end of the left-most node. They are restore in the
add.s32 temp, r1, 1; rightmost block. During execution, all threads will first execute
selp.s32, r2, temp, r1, p0; the leftmost block then they will execute the rightmost block
and exit the program.
In which case it is simple to determine that r1 should be For a series of barriers, multiple resume points will be
the value of r2 if the predicate condition is false. SSA form created. After translation, we use the LLVM optimizer to
is universally praised in literature as simplifying compiler convert the chain of entry blocks into a single block with an
analysis. This is one example at least where it is more difficult indirect jump.
to deal with.
Handling Barriers. A simple way of executing a PTX D. The LLVM IR
program on a single-threaded architecture would be to just LLVM ships with a full featured IR that is integrated with
loop over the program and execute it once for each thread. their concept of a control flow graph. This representation is
Unfortunately this violates the semantics of the PTX barrier rich enough to support all of the LLVM optimization transfor-
instruction which assume that all threads execute up to the mations directly. We chose not to use this representation for
barrier before any thread executes beyond the barrier. In order two reasons:
to handle this case, we break each kernel into sub-kernels 1) It is too heavy weight
beginning at either the program entry point or a barrier, and
• A standalone translator would require linking
ending at either a barrier or the program exit point. We can
against much of the LLVM codebase which is
then loop over each sub-kernel one at a time to make sure that
significantly large at this point. This would increase
the semantics of a barrier are retained. However, we still have
compilation time and generated binary size.
to handle registers that are alive across the barrier.
• We do not need any concepts of a LLVM control
We handle live registers by creating a barrier spill area in flow graph, just a way to emit generated instruc-
local memory for each thread. For each program exit point tions.
ending in a barrier, we save all live registers to the spill
2) It is actively being developed
area before exiting the program. For every program entry
point beginning with a barrier, we add code that restores live • LLVM is constantly being changed and we assumed
registers from the spill area. The definition of local memory that the internal representation would change more
ensures that the spill area will be private for each thread. frequently than the ISA1 .
Figure 2 shows a simple example of this process. The left Based on these factors, we decided to implement our own
program contains a single basic block with a barrier in the IR for the LLVM language. This IR is intended to be able to
middle. The right figure shows the program control flow graph represent any LLVM program, but be lightweight in the sense
after removing barriers. The immediate successor of the entry that it is divorced from the control-flow graph and optimization
block decides whether to start from the original program entry 1 Actually this turned out to be only partially true. During the implemen-
point or the barrier resume point. The left successor of this tation of Ocelot, LLVM actually changed the semantics of the Add and Sub
block is the original program entry point and the right block instructions and added new FAdd and FSub instructions.passes. In this sense it is closer to an AST representation of in GPUs. CPUs generally do not have equivalent support
an LLVM assembly program. During translation, we create an so these instructions are translated into function calls into
LLVM program in terms of this representation and emit it as standard library implementations. This introduces a significant
an assembly file which is then passed to the LLVM toolchain. overhead when executing these instructions.
Different Memory Spaces. PTX supports six distinct mem-
E. Translation to LLVM
ory spaces: parameter, local, shared, global, constant, and
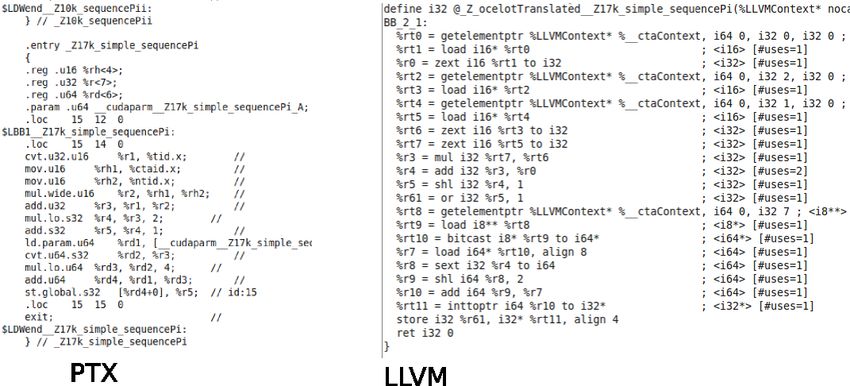
Figure 3 shows the translated LLVM assembly for a simple texture. These spaces are handled by including a base pointer
PTX program. to each space in the context of the current thread and adding
Our basic approach here is to do naive translation, meaning this base pointer to each load or store to that space. The
that we examine PTX instructions one at a time and then texture, constant, parameter, and global memory spaces are
generate an equivalent sequence of LLVM instructions. shared across all CTAs in a Kernel. However, each CTA
More precisely, we assume that PTX transformations have has a unique shared memory space and each thread has a
been applied to a kernel and that it has been converted into unique local memory space. These spaces present a problem
full SSA form. We begin by creating an LLVM function for because allocating separate shared memory to each CTA and
each PTX kernel. This function is passed a single parameter local memory to each thread would consume an excessive
which contains the context for the thread being executed. This amount of memory. We currently allow a single CTA to be
makes generated code inherently thread-safe because each executed a time by each host pthread and all of the threads in
thread context can be allocated and managed independently. those CTAs to be executed. Only enough memory to support
Once the function has been created, we walk the PTX threads ∗ pthreads is allocated at a time and this memory is
control flow graph and examine each basic block. For each shared across different CTAs and threads in a Kernel. In order
basic block, we examine the dataflow graph to get the set of to avoid excessive allocation/deallocation operations, we only
PHI instructions and emit one LLVM PHI instruction for each resize the shared and local memory spaces when they increase
live in register. We then iterate over each PTX instruction and in size. There is currently no bounds checking implemented
dispatch to a translation function for that instruction, which in our LLVM translator, and this implementation may allow
generates an equivalent sequence of LLVM instructions. Note out of bounds memory accesses to silently succeed for some
that it would be possible to consider multiple PTX instructions Kernels. However, it would be relatively easy to add checking
at a time and generate a smaller sequence of LLVM instruc- code to each memory access in a future revision of Ocelot
tions. We instead choose to generate an excessive number of because we have the entire map of allocated memory for each
instructions during translation and rely on the LLVM peephole space at runtime2 .
optimizer to remove redundant code. Shared Memory Wrapping. While verifying our translator
Most PTX instructions correspond exactly to equivalent we noticed that some older versions of the NVIDIA compiler
LLVM instructions and require trivial translation. However, would add large offsets to registers containing addresses that
some special cases are mentioned below. were eventually used to access shared memory. We can only
Rounding Modes. PTX supports all of the IEEE754 round- speculate as to why this was done. However, NVIDIA’s
ing modes (to nearest, to infinity, to -infinity, to zero). How- implementation of CUDA is able to execute these programs
ever, LLVM only supports rounding to the nearest int. We without making out of bounds accesses by masking off the
support to infinity and to -infinity by respectively adding or upper bits of the address. In order to support older CUDA
subtracting 0.5 before rounding a number. This introduces programs we also needed to mask off these bits using explicit
one extra instruction of overhead. To zero is supported by LLVM instructions before performing any shared memory
determining if the number is greater or less than zero and access. This introduced some overhead to all shared memory
conditionally adding or subtracting 0.5. This introduces three accesses.
extra instructions of overhead. Memory Alignment. PXT requires all memory accesses
Special Registers. Special Registers in PTX are used to to be aligned to an address that is evenly divisible by the
provide programs with a fast mechanism of obtaining sta- access size. This implicitly relies on the fact that all memory
tus information about the thread that is currently executing. spaces will begin at addresses that are aligned to the largest
They allow single instruction access to the thread’s id, the possible access size (currently 32 bytes in PTX). We map some
CTA’s id, the CTA dimensions, the Kernel dimensions, several PTX memory accesses to vector operations in LLVM, which
performance counters, and the thread’s mapping to a warp. also must conform to alignment restrictions. Unfortunately,
We allocate a lightweight thread context for each host thread standard library implementations of new/malloc do not strictly
and update it to reflect the currently executing thread on a enforce alignment requirements. In order to handle these cases,
context-switch. For PTX instructions that try to read from a we wrapped malloc and new to always allocate memory in
special register, we issue loads to the corresponding field in units of (bytes + 32) when allocating memory for a PTX
the thread’s context. memory space and then manually align the returned values
Special Functions. Special Functions such as sin, cos,
exp, log, inverse, texture interpolation, etc are supported as 2 The PTX emulator included with Ocelot actually does bounds checking
instructions in PTX and are accelerated by dedicated hardware by defaultFig. 3. Sample PTX Application and Corresponding LLVM
to 32-byte boundaries. update it at a time. This would introduce overhead into the
Uninitialized Registers. A consequence of the SSA form compilation of a kernel. PTX kernels are typically small with
used in LLVM is that the definition of all values must dominate good code coverage and are cooperative executed by multiple
all uses. The NVIDIA compiler will sometimes generate code threads so we use the static emitter by default.
where registers can potentially be used undefined as in the Dynamic compilers typically have to trade off time spent
following code example: optimizing code against the additional time spent executing
unoptimized code. For CUDA applications, kernels are exe-
int value;
cuted over and over by thousands of threads, making it seem
if( condition )
like investment in early optimization would pay off over time.
{
Our initial implementation included the basic optimization
value = 1;
passes available in opt, the llvm optimizer for O0, O1, O2,
}
and O3. After several experiments, we found that the inter-
return value;
procedural optimizations included in OPT were not relevant
In this case, even if condition is always true, the compiler for optimizing single PTX kernels and subsequently removed
may not be able to prove this statically during compilation them. Figure 9 shows the impact of different optimizations
and there exists a path in the program where value used passes on selected benchmarks. Note that for long running
uninitialized. Or, equivalently, value = 1; does not dominate benchmarks, the advantages of applying higher optimizations
return value;. In order to handle these cases, we rely on data can outweigh the overhead of spending more time in the
flow analysis which will generate an alive-in register set at the optimizer, but this is not necessarily the case for shorter
entry to the program with one entry for each register that is applications. In the future we plan to use a decision model to
possibly used uninitialized. During translation, we add a new use static information about the number of threads and code
block immediately after the program entry point that sets all size of each kernel to determine the optimization level to apply.
of these registers to 0.
G. Environment Setup
F. LLVM Transformations Translating the instructions from PTX To LLVM to x86
LLVM provides a very comprehensive library of optimizing is only part of the process of executing a PTX program on
compiler transformations as well as either a static code emitter a many-core processor. It also involves allocating space for
or a lazy code emitter. The static emitter will generate x86 statically allocated variables, propagating the locations of these
instructions for the entire kernel before executing it. The variables to references in the program, as well as allocating
lazy emitter will generate x86 instructions dynamically, as OpenGL buffers and variables bound to textures.
the program is being executed by trapping segfaults generated Global Variables. Global variables in PTX present a prob-
when the program tries to jump into a block that has not yet lem from a compilation perspective because they can condi-
been compiled. The lazy emitter is complicated by the fact that tionally be linked to dynamic memory allocations declared
we execute kernels in parallel using multiple host threads. At externally from the PTX program and bound at runtime using
the very least, the x86 code generator would need to lock the CUDA Runtime API. Alternatively, they can be private
the generated code region so that only a single thread could to the PTX program and not shared across kernel launches.We considered one approach to handling global variables that enough that it cannot be performed using a short sequence involved replacing instructions that load or store to global of LLVM instructions. In order to reduce the complexity of identifiers with calls that would dynamically lookup the ad- the LLVM translator, we implemented a texture interpolation dress of the variable before execution the memory operation. library to emulate the interpolation operations in software. This approach would return either the address of the bound Unfortunately, there is no formal specification for the floating variable if the variable was declared externally, or the address point format/precision or the exact interpolation method used of a local copy. The approach would allow a program to be by NVIDIA GPUs, making it difficult to validate our imple- translated and linked a single time, but it would also introduce mentation. During the design, we created several unit tests that the overhead of an indirect lookup for every memory access compared the results of texture operations run using NVIDIA’s to a global variable. implementation to our library. We refined our implementation In order to avoid this overhead, we chose to implement a until the results were within a small enough margin or error different mechanism. We first allocate a memory region for to pass the built-in regression tests in the CUDA SDK. each kernel large enough to accommodate all kernel private In terms of performance, our library executes a function variables. We then scan though the instructions in the kernel call with a significant number of instructions. The GPU and replaced accesses to these variables with static offsets implementation can perform the interpolation in conjunction into this memory region. This handles the private variables. with the memory access. This severely limits the performance External variables are declared as globals in LLVM and their of applications that execute a significant number of texture identifiers are saved in a list. The LLVM code emitter is instructions when executing on CPUs. As an example of then used to compile the kernel without linking the external this behavior, we tested the performance of a Sobel filter variables. Upon executing a kernel, existing mappings for these application which includes equivalent implementations, one variables are cleared and the LLVM linker is used to bind using texture interpolation and one without. From a series references to the most currently mapped memory for that of simple test, we determined that the texture interpolation variable. implementation was relatively faster on the GPU, but slower OpenGL Interoperability. CUDA provides support for on the CPU. OpenGL interoperability on linux via a set of API functions that allow CUDA kernels to write directly into OpenGL H. Runtime buffers. This process involves registering an OpenGL buffer Once a kernel has been translated, it must be executed in with the CUDA runtime and then obtaining a pointer to the parallel on all of the cores in a CPU. We use the Hydrazine base of the buffer. When running on a GPU, writes to the area threading library [29] (which itself wraps pthreads on Linux) of memory will be forwarded directly to a specific OpenGL to bind one worker thread to each CPU core. Upon program buffer. If this buffer is also stored in GPU memory, avoiding a initialization, all of the worker threads are started and put to round trip from GPU memory to CPU memory back to GPU sleep until a kernel is executed. When a kernel is executed, memory can provide a significant performance advantage. This the main thread will assign a subset of CTAs to each thread trade-off is reversed when kernels are run on the CPU. We use and signal each worker to begin executing the kernel. The the OpenGL API to obtain pointers to a host memory region main thread will then block until all workers have completed that is mapped to an OpenGL buffer. These are passed directly in order to preserve the semantics of the bulk-synchronous as parameters to kernels. The OpenGL runtime forwards writes execution model. to this memory region to the memory on the GPU, possibly In our implementation of the runtime, we were very careful introducing overhead compared to running the same kernel about the number of synchronization routines used during natively on a GPU. kernel execution and were able to reduce it to one condition Texture Interpolation. Graphics applications rely heavily variable broadcast when the kernel is launched and then one on the process of texture mapping - intuitively this is the condition variable signal per worker threads when the kernel process of wrapping a 2D image around a 3D geometry using completes. The overhead of creating/destroying worker threads interpolation. Most modern GPUs include hardware support is mitigated by reusing the same threads to execute a series of for texture mapping in the form of floating point units that kernels. perform load operations from floating point addresses. These This approach to distributing CTAs to worker threads was addresses are wrapped or clamped to the dimensions of a 1D or sufficiently efficient for many applications. However, special 2D image bound to a texture. For addresses that do not fall on considerations were needed to handle atomic memory opera- integer values, nearest point, linear, or bilinear interpolation is tions and CTAs with variable execution times. used to compute a pixel value from the surrounding pixels. For Atomic Operations. Atomic operations in PTX are useful non-graphics applications, textures can be used to accelerate for performing commutative operations with low overhead interpolation for image or signal processing. across CTAs in a program. For example, they can be used In PTX, textures are exposed in the ISA using instructions to implement an efficient reduction across a large number of that sample different color channels given a set of floating CTAs. As useful as they are, atomic operations introduce some point coordinates. Modern CPUs do not have hardware sup- difficulties when being executed by multiple worker threads. port for interpolation. Furthermore, this operation is complex Straightforward solutions involving locking access to atomic
CPU              Intel i920 Quad-Core 2.66Ghz
           Memory              8GB DDR-1333 DRAM
                                                                    plan to follow up this study with a detailed characterization
           CPU Compiler                GCC-4.4.0                    of the performance of CUDA applications across a range
           GPU Compiler                NVCC-2.3                     of GPU and CPU platforms with the intent of identifying
           OS                      64-bit Ubuntu 9.10               program characteristics that are more suited to one style of
                             TABLE I                                architecture. For all of the experiments in this section, we use
                          T EST S YSTEM
                                                                    the system configuration given in Table I. We begin with a
                                                                    set of experiments exploring the performance limits of our
                                                                    compiler using a set of microbenchmarks, moving on to a
operations may introduce an excessive amount of overhead            classification of runtime overheads, and ending with a study
as locks can involve much higher overhead than atomic op-           of the scalability of several full applications using multiple
erations supported by hardware. LLVM alternatively supports         cores.
a series of intrinsic operations that expose hardware support       A. Microbenchmarks
for the atomic operations in PTX. In order to determine the
performance impact of locks compared to atomic operations,             In order to quickly evaluate the performance limitations of
we ran several microbenchmarks to determine the execution           our implementation, we wrote several low level PTX bench-
time of simple PTX kernels that exclusively performed a long        marks designed to stress various aspects of the system. In order
series of atomic operations, using pthread mutexes for atomic       to write and execute PTX programs outside of the NVIDIA
operations. We found that the average time to acquire a highly      compilation chain, which does not accept inlined assembly,
contested lock, perform an atomic operation, and release the        we extended the CUDA Runtime API with two additional
lock was less than 20x slower than simply performing the            functions to allow the execution of arbitrary PTX programs.
same operation with one thread and no locks. In other words,        The function registerPTXModule allows inserting strings or
locking and unlocking a contested lock was only 20x slower          files containing PTX kernels at runtime and getKernelPointer
than issuing a load and then a store instruction. This was a        obtains a function pointer to any registered kernel that can be
significantly better result than we were expecting and thus we      passed directly to cudaLaunch.
did not move on to use LLVM atomic intrinsics.                         void registerPTXModule(
   CTA Scheduling. The initial implementation of the Ocelot              std::istream& module,
runtime used a static partitioning scheme where the 2D space             const std::string& moduleName );
of CTAs was projected onto a 1D space and divided equally              const char* getKernelPointer(
among the worker threads. This scheme proved effective for               const std::string& kernelName,
many applications where the execution time of CTAs was                  const std::string& moduleName );
constant. However, several applications, particularly the SDK
Particles example, exhibited variable execution time for each          Using this infrastructure, we explored memory bandwidth,
CTA leading to cases where some worker threads would finish         atomic operation throughput, context-switch overhead, in-
their set of CTAs early and sit idle until the kernel completed.    struction throughput, and special function throughput. These
   To address this problem we considered the classical work         measurements were taken from a real system, and thus there is
stealing approaches as well as different static partitioning        some measurement noise introduced by lack of timer precision,
schemes. We eventually settled on a different static partitioning   OS interference, dynamic frequency scaling, etc. These results
scheme due to excessive synchronization overheads associated        were taken from the same system and include at least 100
with work stealing. We noticed that for several applications,       samples per metric. We present the sample mean in the form
the execution time of a CTA was strongly correlated with            of bar charts, and 95% confidence intervals for each metric.
that of its neighbors. In the Particles example, this is the           Memory Bandwidth. Our first microbenchmark explores
case because neighboring CTAs process neighboring particles,        the impact of memory traversal patterns on memory band-
which are more likely to behave similarly. We implemented           width. This experiment is based off of prior work into optimal
an interleaved partitioning scheme where the 2D space was           memory traversal patterns on GPUs [7], which indicates that
still mapped onto a 1D space, but the space was traversed           accesses should be coalesced into multiples of the warp size
beginning at an offset equal to the worker threads ID, and          to achieve maximum memory efficiency. When executing on
incremented by the total number of worker threads. This made        a GPU, threads in the same warp would execute in lock-
it more likely that each worker thread would be assigned a set      step, and accesses by from a group of threads to consecutive
of CTAs with a similar distribution of execution times.             memory locations would map to contiguous blocks of data.
                                                                    When translated to a CPU, threads are serialized and coalesced
                          IV. R ESULTS                              accesses are transformed into strided accesses. Figure 4 shows
   This Section covers a preliminary analysis of the per-           the performance impact of this change. The linear access pat-
formance of several CUDA applications when translated to            tern represents partitioning a large array into equal contiguous
LLVM. Note that this section is intended to merely provide          segments and having each thread traverse a single segment
several distinct points of reference of the scaling and through-    linearly. The strided access pattern represents a pattern that
put possible when translating CUDA applications to x86. We          would be coalesced on the GPU. It is very significant that
Fig. 4. Maximum Bandwidth for Strided and Linear Accesses Fig. 6. Barrier Throughput
Fig. 5. Atomic Operation Slowdown Fig. 7. Basic Integer and Floating Point Instruction Throughput
the strided access pattern is over 10x slower when translated several variables are initialized before the loop and stored
to the CPU. This indicates that the optimal memory traversal to memory after the loop completes. This ensures that they
pattern for a CPU is completely different than that for a GPU. are all alive across the barrier. In order to isolate the effect
Atomic Operations. The next experiment details the inter- of barriers on a single thread, we only launched one thread
action between the number of host worker threads and atomic and one CTA for this benchmark. In this case, a thread will
operation overhead. This experiment involves an unrolled hit the barrier, exit into the Ocelot thread scheduler, and be
loop consisting of a single atomic increment instruction that immediately scheduled again.
always increments the same variable in global memory. The Figure 6 shows the measured throughput, in terms of num-
loop continues until the counter in global memory reaches a ber of barriers processed per second. Note that the performance
preset threshold. As a basis for comparison, we ran the same of a barrier decreases as the number of variables increases,
program where a single thread incremented a single variable indicating that a significant portion of a context-switch is
in memory until it reached the same threshold. Figure 5 shows involved in saving and loading a thread’s state. In the same
the slowdown of the atomic increment compared to the single- way that the number of live registers should be minimized in
thread version for different numbers of CPU worker threads. GPU programs to increase the number of thread’s that can be
These results suggest that the overhead of atomic operations active at the same time, programs translated to the CPU should
in Ocelot are not significantly greater than on GPUs. actively try to minimize the number of live registers to avoid
Context-Switch Overhead. This experiment explores the excessive context-switch overhead.
overhead of a context-switch when a thread hits a barrier. Instruction Throughput. The fourth microbenchmark at-
Our test consists of an unrolled loop around a barrier, where tempts to determine the limits on integer and floating pointApplication Startup Latency (s) Teardown Latency (s)
CP 4.45843e-05 6.07967e-05
MRI-Q 3.48091e-05 8.55923e-05
MRI-FHD 3.62396e-05 8.4877e-05
SAD 4.14848e-05 5.45979e-05
TPACF 3.48091e-05 8.70228e-05
PNS 4.48227e-05 8.53539e-05
RPES 4.17233e-05 6.12736e-05
TABLE II
K ERNEL S TARTUP A ND T EARDOWN OVERHEAD
implementation of Mersenne Twister, with a different seed for
each run of the benchmark. The special functions tested were
reciprocal (rcp), square-root (sqrt), sin, cos, logarithm base 2
(lg2), 2power (ex2), and 1D, 2D, and 3D texture sampling.
Figure 8 shows the maximum sustainable throughput for
Fig. 8. Special Function Throughput each special function. The throughputs of these operations
are comparable when run on the GPU, which uses hardware
acceleration to quickly provide approximate results. Ocelot
instruction throughput when translating to a CPU. The bench- implements these operations with standard library functions,
mark consists of an unrolled loop around a single PTX incurring the overhead of a fairly complex function call per
instruction such that the steady state execution of the loop will instruction in all cases except for rcp, which is implemented
consist only of a single instruction. We tested 32-bit and 64-bit using a divide instruction. Rcp can be used as a baseline, as
integer add, and floating point multiply-accumulate, the results it shows the throughput of the hardware divider. Based on
of which are shown in Figure 7. The theoretical upper bound these results, we conclude that the special operation throughput
on integer throughput in our test system is 3 integer ALUs ∗ using Ocelot is significantly slower than the GPU, even more
4 cores ∗ 2.66 ∗ 109 cycles/s = 31.2 ∗ 109 ops/s. 32-bit adds so than the ratio of theoretical FLOPs on one architecture to
come very close to this limit, achieving 81% of the maximum the other. Additionally, the measurements include a significant
throughput. 64-bit adds achieve roughly half of the maximum amount of variance due to the random input values. This is
throughput. 32-bit floating point multiply-accumulate opera- a different behavior than the GPU equivalents, which incur a
tions are much slower, only achieving 4GFLOPs on all 4 cores. constant latency per operation.
This is slower than the peak performance of our test system,
and we need to explore the generated x86 machine code B. Runtime Overheads
to understand exactly why. These results suggest that code In order to tune our implementation and identify bottlenecks
translated by Ocelot will be relatively fast when performing that limited the total application performance, we designed
integer operations, and slow when performing floating point an experiment to measure the startup cost of each kernel,
operations. the overhead introduced by optimizing LLVM code before
Special Function Throughput. The final microbenchmark executing it, and finally the contribution of various translation
explores the throughput of different special functions and operations to the total execution time of a program.
texture sampling. This microbenchmark is designed to expose Kernel Startup and Teardown. The use of a multi-
the maximum sustainable throughput for different special threaded runtime for executing translated programs on multi-
functions, rather than to measure the performance of special core CPUs introduces some overhead for distributing the set
functions in any real application. To this end, the benchmarks of CTAs onto the CPU worker threads. We instrumented
launch enough CTAs such that there is at least one CTA Ocelot using high precision linux timers to try to measure this
mapped to each worker thread. Threads are serialized in these overhead. Table II shows the measured startup and teardown
benchmarks because there are no barriers, so the number of cost for each kernel. Note that the precision of these timers
threads launched does not significantly impact the results. is on the order 10us, thus the results indicate that the startup
The benchmarks consist of a single unrolled loop per thread and teardown costs are less than the precision of our timers.
where the body consists simply of a series of independent These are completely negligible compared to the overheads
instructions. To determine the benchmark parameters that gave of translation and optimization. In the future, we may explore
the optimal throughput, the number of iterations and degree more dynamic work distribution mechanisms such as work
of unrolling was increased until less than a 5% change in stealing that take advantage of this headroom.
measured throughput was observed. We eventually settled on Optimization Overhead. In order to determine the rela-
16 CTAs, 128 threads per CTA, 2000 iterations each of which tive overhead of applying different levels of optimization at
contains a body of 100 independent instructions. Inputs to runtime, we instrumented the optimization pass in Ocelot to
each instruction were generated randomly using the Boost 1.40 determine the amount of time spent in optimization routines.Fig. 11. Contribution of Each Source of Overhead
Fig. 9. Optimization Overhead
the LLVM level. These may make many optimizations at the
LLVM level redundant, not worth dedicating resources to at
execution time. Also, we should note that the optimizations
used here were taken directly from the static optimization tool
OPT, which may not include optimizations that are applicable
to dynamically translated programs. A more comprehensive
study is needed to identify optimizations are applicable to
applications that are sensitive the optimization complexity.
Component Contribution. As a final experiment into the
overheads of dynamic translation, we used callgrind [30]
to determine the relative proportion of time spent in each
translation process. Note that callgrind records basic block
counts in each process, which may be different than total
execution time. Figure 11 shows that the vast majority of the
translation time is spent in the LLVM code generator. The
decision to use our own LLVM IR only accounts for 6% of
the total translation overhead. The time it takes to translate
Fig. 10. Parboil Scaling with Different Optimization Levels from PTX to LLVM is less than the time needed to parse
either PTX or LLVM, and the speed of our PTX parser is on
par with the speed of LLVM’s parser. LLVM optimizations
We ran the experiment on every application in the parboil can be a major part of the translation time, but removing if-
benchmark suite to identify any differences in optimization conversion and barriers from PTX takes less than 2% of the
time due to the input program’s structure. Figure 9 shows that total translation time. These results justify many of the design
O3 is never more than 2x slower than O1. Optimization for decisions made when implementing Ocelot’s translator.
size is almost identical to O2 in all cases, and O3 is only
significantly slower than O2 for pns and sad. C. Full Application Scaling
To determine the impact of different optimization levels on Moving on from micro-benchmarks to full applications, we
the total execution time of different applications, we measured studied the ability of CUDA applications to scale to many
the execution time of each of the Parboil benchmarks with cores on a multi-core CPU. Our test system includes a pro-
different levels of optimization. Figure 10 shows these results, cessor with four cores, each of which supported hyperthread-
where the best optimization level depends significantly on ing. Therefore, perfect scaling would allow performance to
the application. For CP, MRI-Q, and SAD, the overhead of increase with up to 8 CPU worker threads. This is typically not
performing optimizations can not be recovered by improved the case due to shared resources such as caches and memory
execution time, and total execution time is increased for any controllers, which can limit memory bound applications.
level of optimization. The other applications benefit from We used the Parboil benchmarks as examples of real CUDA
O1, and none of the other optimization levels do better than applications with a large number of CTAs and threads; our
O1. Note that the LLVM to x86 JIT always applies basic previous work shows that the Parboil applications launch
register allocation, peephole instruction combining, and code between 5 thousand and 4 billion threads per application
scheduling to every program regardless of optimizations at [19]. Figure 12 shows the normalized execution time of eachYou can also read