The economic future of the Central Activities Zone - (CAZ)
←
→
Page content transcription
If your browser does not render page correctly, please read the page content below

Greater London Authority (GLA)

The economic future of the
Central Activities Zone
(CAZ)
Phase 2 Report
Scenario development, model findings and policy
recommendations
March 2021

                                                  Photo credit: Giacomo Magnani
The Economic Future of the Central Activity Zone (CAZ)
Phase 2 Final Report: Scenario development, model findings and policy recommendations
Report to the Greater London Authority (GLA)

Executive summary

Introduction                                                                    Scenario 1: Bounce-back to a new normal                                       a higher population in the CAZ and across London
                                                                                • In this scenario, we have assumed a strong economy                          mitigates the losses, with the potential for additional
• This research looks at the future of London’s Central
                                                                                  driven by emerging office based sectors (including                          jobs to be generated by 2031.
  Activities Zone (CAZ), to assess the impact of both
  the COVID-19 global pandemic and Brexit on the                                  lab enabled offices), and a broad continuation of pre-                    Scenario 2: Widespread home working and
  area in the medium (2-5 years) and long term (5-10                              COVID-19 trends, such that office-worker visits to                        reinvention
  years).                                                                         the CAZ bounce back quickly after the pandemic and                        • Our second scenario assumes a strong economy,
                                                                                  plateau at around four-fifths of 2019 levels. Inbound                       driven by emerging office based sectors, and that
• Our Phase 1 report (Arup, 2021), which included
                                                                                  tourism returns to 2019 levels by 2026. London’s                            home working remains the norm for those who are
  office use trends in the CAZ, the CAZ ecosystem and
                                                                                  population continues to grow in line with GLA                               typically based in offices, with in-person attendance
  the interaction of the CAZ with the rest of London
                                                                                  central projections.                                                        rates at two-fifths of 2019 levels. Although some
  and the UK was produced in January 2021.
                                                                                • In this scenario 114,000 jobs in face-to-face sectors                       social distancing conventions remain, inbound
• This is our Phase 2 report, which builds three
  scenarios to test the scale of the economic impact on
                                                                                  would be at risk across London in 2023, relative to a                       tourism returns to 2019 levels by 2027. This provides
  the CAZ over the medium and long-term, and
                                                                                  ‘No COVID-19’ scenario, due to lower attendance                             a greater opportunity to reinvent the CAZ, with a
  provides suggested policy responses.
                                                                                  rates and lower tourist footfall, even with a strong                        greater increase in the residential population, and
                                                                                  economic backdrop. Over time, the opportunity from                          reinforced attractiveness to visitors.
There are significant numbers of jobs at risk in
                                                                                                                             2023                                                             2031
the medium to long term
                                                                                                       CAZ              Rest of London          Total London              CAZ            Rest of London       Total London
• The absence of office workers and visitors in central
                                                                                                 Diff to Diff to no              Diff to no    Diff to    Diff to no Diff to Diff to no Diff to Diff to no Diff to Diff to no
  London puts jobs in retail, food and beverage, and                                             2019     COVID
                                                                                                                    Diff to 2019
                                                                                                                                  COVID        2019        COVID 2019 COVID             2019     COVID 2019 COVID
  entertainment (including arts and culture), at
                                                                                No COVID-19          18            -          29           -         47            -      59         -        88          -     147          -
  significant risk in the medium to long term.
                                                                                Bounce-back to
• We tested the impact across three scenarios.                                  a new normal
                                                                                                    -75          -93           8         -21        -67        -114       69        10       103        15      172       25

                                                                                Widespread
                                                                                                    -89         -107          17         -12        -72        -119       12       -47       116        28      128      -19
                                                                                home working
                                                                                Significant
                                                                                                    -97         -115         -14         -43       -111        -158      -27       -86        26       -62       -1     -148
                                                                                headwinds

                                                                                  Jobs in demand and at risk in London’s face-to-face sectors by scenario and location (000s FTEs)
                                                                                  (+ve indicates job demand, -ve indicates jobs at risk)

March 2021                                                                                                                                                                                                                       2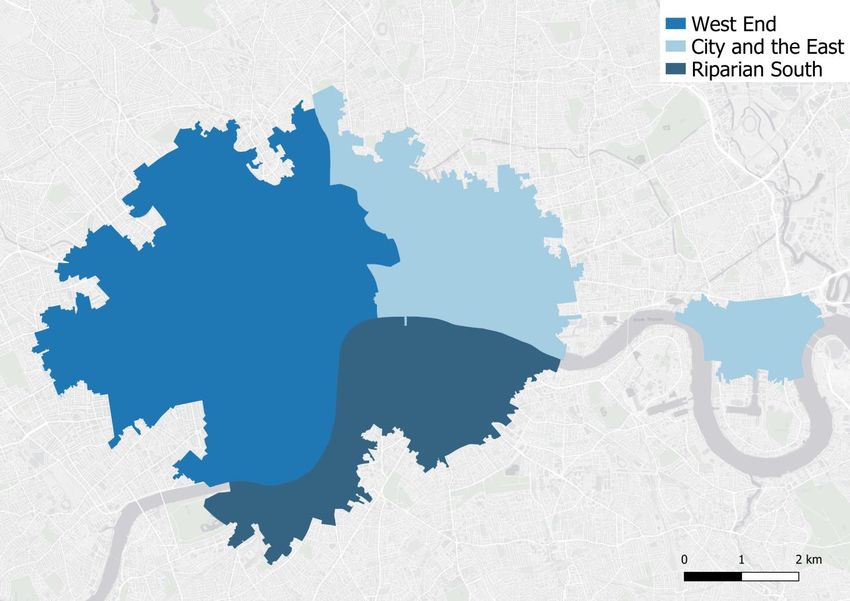
The Economic Future of the Central Activity Zone (CAZ)
Phase 2 Final Report: Scenario development, model findings and policy recommendations
Report to the Greater London Authority (GLA)

Executive summary

• Under this scenario, the emerging sectors drive                               The CAZ ecosystem is already likely to be                   • Losses in these industries can create a vicious cycle
  recovery, but the dispersed working and slow return                           scarred                                                       of failure, whereby a deterioration in the quality of
  of tourists means that 119,000 face-to-face jobs                                                                                            the offer leads to even lower footfall and spending.
                                                                                • If we include jobs in non face-to-face sectors, the
  would be at risk across London in 2023, relative to a                                                                                       The ecosystem of the CAZ is already likely to be
                                                                                  number of FTEs based in the CAZ is excepted to be
  ‘No COVID-19’ scenario. This potential loss is                                                                                              scarred as a result of the events of 2020 and 2021,
                                                                                  less than half of the expected ‘No COVID-19’ level
  mitigated by the opportunities gained in face-to-face                                                                                       and will need remedial attention, particularly in the
                                                                                  throughout the 2020s in both the ‘widespread home
  industries closer to office workers’ home locations.                                                                                        hospitality, leisure, and arts and culture industries.
                                                                                  working and reinvention’ and ‘significant headwinds’
  By 2031, the high population and economic growth                                                                                          • Some spending lost from the CAZ may redirected in
                                                                                  scenarios.
  in this scenario means that the overall jobs at risk                                                                                        outlets closer to home working locations, which
  across London is similar to the ‘No COVID-19’                                 • The jobs at risk from the lack of footfall are in the
                                                                                                                                              offers some mitigation to retail, food and beverage,
  scenario.                                                                       food and beverage, retail, and entertainment sectors.
                                                                                                                                              and entertainment in the rest of London, and
                                                                                  Cleaners, catering and security staff who support
Scenario 3: Severe headwinds                                                                                                                  elsewhere. However this increase in the rest of
                                                                                  office buildings are additionally at risk.
                                                                                                                                              London may not completely make up for the loss of
• Our ‘severe headwinds’ scenario assumes more                                  • These sectors are more likely to employ young               spending in the CAZ, and in our modelled scenarios,
  measured growth, in line with the GLA’s slower                                  people, those with fewer qualifications, and those that     there was a net loss overall. It is therefore essential
  economic recovery scenario, and that tourism only                               have migrated from other countries to London. The           for both the CAZ and for London, and indeed the
  returns to 2019 levels by 2031. Office worker                                   fallout landing on the shoulders of these groups is         financial recovery of the rest of the UK, that footfall
  attendance rates are two-fifths of 2019 levels, and                             often the case with slowdowns and recessions, but           in central London is increased.
  London’s resident population stagnates at 2019 levels                           this one is worse, given the direct impacts on the
  as the city becomes less attractive as a place to live                          face-to-face industries.
  and work.
                                                                                • Our Phase 1 report emphasised the importance of the
• In this scenario there are projected to be 158,000                              face-to-face industries to the overall economic
  face-to-face jobs at risk across London in 2023,                                ecosystem of the CAZ, whereby the leisure offer
  driven by the continued low footfall from workers                               contributes significantly to choices made by
  and visitors. A decade after COVID-19, in 2031, the                             employers and individuals to invest in central
  overall number of face-to-face jobs at risk across                              London, and to the UK’s soft power abroad, perhaps
  London is still 148,000 higher than in the ‘No                                  more so than any other factor.
  COVID-19’ scenario, with the bulk of these located
  in the CAZ.

March 2021                                                                                                                                                                                              3
The Economic Future of the Central Activity Zone (CAZ)
Phase 2 Final Report: Scenario development, model findings and policy recommendations
Report to the Greater London Authority (GLA)

Executive summary

The CAZ has significant strengths to build on                                   Actions to take in the next two years                       New green public realm in Paris
• The CAZ’s strengths provide a basis for recovery                              1. Provide immediate support to re-ignite the CAZ
                                                                                                                                            The strategy to improve the quality of urban life in
  from the challenges of COVID-19 and Brexit, and to                            ecosystem, and to bring people back
                                                                                                                                            Paris, a city visually much less green than London,
  meet the other drivers of the 2020s, such as climate                          1.1 Act immediately to support industries which rely        is multi-pronged. Many existing greenspaces are
  change and digitalisation.                                                    on face-to-face interaction, especially those in arts and   having additional trees planted in them to create
• Other key strengths include London’s diversity, the                           culture, including the delivery of the ‘Roadmap to the      cooler spots to shelter in summer, including an
  city’s world-leading emerging sectors, the green                              safe and full reopening of London’s economy’ and the        urban forest that is planned for outside the Hôtel de
  economy, arts and cultural assets, the significant                            Recovery Board’s ‘Grand Challenge’ (Appendix D).            Ville.
  amount of green space and green roofs, the best                               1.2 Understand the extent of the non-health impacts of      There are also more ambitious projects, with plans
  student experience and opportunities, and the sheer                           COVID-19 across London’s diverse population and             for the Champs-Élysées to be part pedestrianised
  range of career options open to those of all skills and                       implement targeted support plans.                           (in a more ambitious plan than that for London’s
  background, across all industries.
                                                                                1.3 Emphasise the benefits of coming into central           Oxford Street), with more tree planting, additional
• Nevertheless, the seriousness of the situation is                             London through strong marketing campaigns.                  green spaces and urban lounges by the end of the
  unprecedented, and significant interventions by many                                                                                      2020s.
                                                                                1.4 Maintain the quality and frequency of London’s
  parties are required to mitigate the impacts in the
                                                                                important public transport network, including a longer-
  short to medium term, and to ensure the CAZ
                                                                                term funding arrangement for TfL.
  emerges from this crisis stronger than before in the
  medium to long term.                                                          1.5 Reduce the marginal costs of a sustainable visit to
                                                                                the CAZ, through keeping fares low, and deploying
Significant interventions are required
                                                                                part time season tickets on the national rail network.
• Actions in the next two years are required to get the
  capital on the right path to recovery, building on the
  work and recommendations of the existing Mayoral
  recovery programmes. Other actions which are
  equally important to a sustainable recovery, but may
  be taken in the medium to long term (2 – 10 years                                                                                           Proposed tree planting by the Gare de Lyon in Paris
  hence, to 2031).

March 2021                                                                                                                                                                                          4
The Economic Future of the Central Activity Zone (CAZ)
Phase 2 Final Report: Scenario development, model findings and policy recommendations
Report to the Greater London Authority (GLA)

Executive summary

Actions to take in the medium- to long-term (2-10                               collaboration.                                          to encourage more genuinely affordable housing and
years)                                                                          3.3 Embrace the flexibility in timings offered by new   homes suited to a wider range of people.
2. Develop the CAZ as a model of a sustainable,                                 ways of working to spread footfall around the clock,    6. Create a shared vision, work in partnership and
healthy and green urban centre, with a thriving arts,                           reducing crowds at certain times, and to make the CAZ   apply strong leadership
culture, entertainment and hospitality offer                                    more attractive for people after 6pm.
                                                                                                                                        6.1 Create a long term vision for the CAZ.
2.1 Deliver a step-change improvement in inclusive                              3.4 Create greater polycentricity in London by
                                                                                                                                        6.2 The GLA needs to take the strategic leadership on
and accessible public realm and urban experience with                           identifying the local centres that may be impacted
                                                                                                                                        the future of the CAZ, working with relevant boroughs
a level of ambition beyond those of previous plans,                             most, and which could increase levels of office
                                                                                                                                        and other stakeholders.
including new places that bring people closer to nature,                        buildings and shared co-working spaces outside of the
provide space for families, recreational facilities close                       CAZ.                                                    6.3 Join with other cities to make the case for
to workplaces and residential locations, active spaces                                                                                  investment in central areas to government.
                                                                                4. Strengthen the CAZ’s growth sectors and provide
and play.                                                                       the world’s best environment for collaboration and      6.4 Gather data on the fast moving situation, and apply
2.2 Provide more pedestrianisation, an ambitious new                            innovation                                              a course correction if necessary.
active travel network, and better cycle parking and                             4.1 Encourage growth in the emerging sectors,           Interventions could help save jobs
change facilities.                                                              including across technology and life sciences as the    •   Based on an illustrative 20% point increase in
2.3 Increase the CAZ’s role in hosting arts, culture and                        bedrock of London’s future growth. This includes            visitor numbers and office worker visits that might
festivals with increased funding for grassroots arts and                        providing marketing, space, skills, and incentives to       result from implementing policy recommendations,
culture that reflects the diversity of London.                                  encourage growth.                                           in the ‘widespread homeworking and reinvention’
3. Be agile, embrace experimentation, encourage                                 4.2 Provide support for green shoots, innovation,           scenario 42,000 face-to-face jobs would no longer
temporary solutions and continue to move with the fast                          entrepreneurship and re-skilling of Londoners.              be at risk in the CAZ in 2023. By 2031, this number
pace of change                                                                  5. Take steps to increase the population of the CAZ         would rise to 92,000 face-to-face jobs no longer at
3.1 Generate excitement, provide reasons to visit and                                                                                       risk in the CAZ.
                                                                                5.1 Grow the number of central London residents
maintain vibrancy by making temporary solutions the                             through positive strategic and local planning (though   •   Note that this calculation is illustrative only and we
norm.                                                                           not through low quality accommodation or by                 have not modelled the impact of our suggested
3.2 Promote collaborative spaces through agile public                           compromising strategic functions), focussed on              policy interventions on footfall.
sector regulation, policy and initiatives which help                            Opportunity Areas and re-purposing brownfield sites.
bring forward space suited to joint working and                                 5.2 Increase the mixture of housing stock in the CAZ,
March 2021                                                                                                                                                                                           5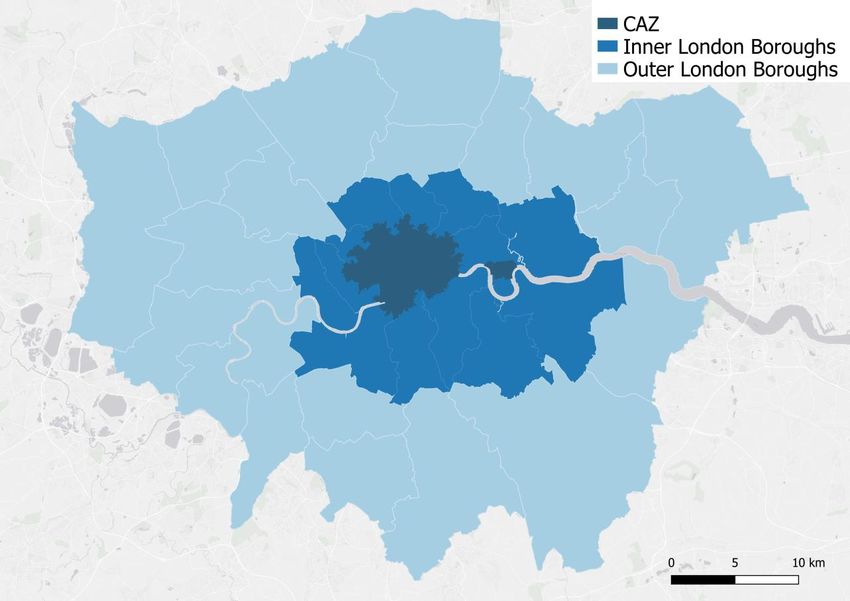
The Economic Future of the Central Activity Zone (CAZ)
Phase 2 Final Report: Scenario development, model findings and policy recommendations
Report to the Greater London Authority (GLA)

Executive summary

A vision for the CAZ                                                                    better serving those accessing the CAZ from 6pm to        •   A higher CAZ residential population, to offer more
                                                                                        6am, within a re-ignited CAZ ecosystem.                       sustainable lifestyles, resilience, increased vibrancy
An ambitious vision for the future of the CAZ to 2030,
                                                                                •       A diverse, people-friendly CAZ, that is a better              and ‘stewardship’ of the CAZ’s resources for
and 2050 should be delivered by the end of 2021.
                                                                                        place to call home, with approaches to liveability,           others, and bringing London more into line with its
This vision should build on the findings from this                                                                                                    global rivals.
                                                                                        wellbeing, culture, with the human experience at its
report, including putting London’s strengths, its
                                                                                        heart, and from the perspective of all Londoners,         •   A re-emphasis on the CAZ as London’s and the
people, the environment and the transition to net zero at
                                                                                        making the most of the capital’s role as a diverse            UK’s global city centre. Marketing of the CAZ as a
the centre:
                                                                                        city.                                                         place to meet and collaborate, with a range of
•   Specific plans to develop the CAZ as a destination                                                                                                spaces, offers and digital infrastructure to attract
                                                                                •       An exciting, ever-changing CAZ, with a greater
    for world-leading arts, culture, entertainment and                                                                                                people and business.
                                                                                        number of temporary solutions, so that the number
    hospitality, that also take account of residents,
                                                                                        of pop-ups and meanwhile uses increases                   We suggest that the vision should be ambitious, clear
    workers and visitors.
                                                                                        dramatically, and so that the CAZ offer keeps             and compelling, and as such, requires strong political
•   A centrepiece of this should be higher quality and                                  changing, remains a talking point, and drives             leadership and direction by the Mayor.
    diverse public realm, more green and natural                                        FOMO (Fear Of Missing Out).                               It should build upon the progress already made by the
    spaces, leading to an improved urban experience,
                                                                                •       An economic strategy that encourages growth in the        London Recovery Programme missions, and either
    higher levels of sustainability, stronger climate
                                                                                        emerging sectors that will drive future prosperity,       folded into that brief, or led by a new CAZ taskforce.
    change resilience, and a better offer for residents,
                                                                                        including tech, creative industries, and life sciences,
    workers and visitors.
                                                                                        through creation of space – including lab-enabled
•   An even more sustainable CAZ that builds on the                                     offices – provision of skills, and other incentives.
    quantity and quality of urban living, delivers on
                                                                                •       An inclusive and equitable CAZ, with opportunities
    active travel opportunities, supports a
                                                                                        and improved life chances for all Londoners, that,
    transformation to sustainable deliveries and
                                                                                        as far as possible, provides a greater mixture of
    servicing, and encourages a recovery in the most
                                                                                        housing stock, and complements other centres in
    sustainable sectors.
                                                                                        London, with a redefined relationship in the light of
•   A thriving arts and culture sector at the centre of the                             the new ways of working, post-pandemic.
    vision, better reflecting the diversity of London, and

March 2021                                                                                                                                                                                                     6
The Economic Future of the Central Activity Zone (CAZ)
Phase 2 Final Report: Scenario development, model findings and policy recommendations
Report to the Greater London Authority (GLA)

Contents
I. Introduction                                                                         10
II. Three future scenarios                                                              13
III. The impacts on London’s economy                                                    29
IV. Conclusions and recommendations for action                                          42
V. Bibliography                                                                         63
Appendix A: Detailed modelling findings and sensitivity tests                           67
Appendix B: Model method                                                                78
Appendix C: Reconciliation with TfL scenarios                                           85
Appendix D: Mayoral recovery programmes                                                 87
Appendix E: Study areas                                                                 96

March 2021                                                                                   7
The Economic Future of the Central Activity Zone (CAZ)
Phase 2 Final Report: Scenario development, model findings and policy recommendations
Report to the Greater London Authority (GLA)

Glossary of terms

                             Department for Business, Energy and Industrial
BEIS                                                                                    LSOA                Lower Super Output Area
                             Strategy
BRES                         Business Register and Employment Survey                    LTN                 Low traffic neighbourhood

CAZ                          Central Activities Zone                                    Mph                 Miles per hour

DfT                          Department for Transport                                   MSOA                Middle Super Output Area
Emerging office-             Media, architecture and creative, IT and                   NIoD                Northern Isle of Dogs
based jobs                   communications, science, marketing
EU                           European Union                                             NO2                 Nitrogen Dioxide

                             Face-to-face industry; industries which rely on in-        OECD                Organisation for Economic Co-operation and Development
F2F
                             person interactions
                                                                                                            Media, architecture and creative, IT and communications,
F&B                          Food and beverage industry                                 Office-based jobs   science, marketing, finance, legal, real estate, headquarters
                                                                                                            and management
FDI                          Foreign Direct Investment
                                                                                        ONS                 Office for National Statistics
FT                           The Financial Times
                                                                                        p.a.                Per annum
FTE                          Full-time equivalent
                                                                                        TfL                 Transport for London
GDP                          Gross Domestic Product                                     Traditional office-
                                                                                                            Finance, legal, real estate, headquarters and management
                                                                                        based jobs
GLA                          Greater London Authority
                                                                                        ULEZ                Ultra Low Emission Zone
GVA                          Gross Value Added

March 2021                                                                                                                                                                  8
The Economic Future of the Central Activity Zone (CAZ)
Phase 2 Final Report: Scenario development, model findings and policy recommendations
Report to the Greater London Authority (GLA)

Important Notice

This report has been prepared specifically for and                              liability in relation to information used by us which has   prospectus, supplementary prospectus, listing
under the instructions and requirements of the Greater                          been provided by others. We emphasise that the              particulars, supplementary listing particulars,
London Authority, under an appointment dated                                    forward-looking projections, forecasts, or estimates are    presentation or other document or communication in
December 2020 in connection with assessment of the                              illustrative only and scenario-based. They are based        respect of the sale, acquisition, offering or transfer of
economic future of the Central Activities Zone (CAZ)                            upon interpretations or assessments of available            any shares or securities or interest in them, whether on
in London.                                                                      information at the time of writing. The realisation of      the primary or secondary market or otherwise, which
This report is prepared for use and reliance by our                             the prospective financial information is dependent          uses, includes or incorporates any report, deliverable or
client only. No third party is entitled to rely on this                         upon the continued validity of the assumptions on           information, or any element thereof, prepared by us
report unless and until they and we sign a reliance letter                      which it is based. Actual events frequently do not occur    under or in connection with this agreement.
in the form attached to our appointment. We do not in                           as expected, and the differences may be material. For       Ove Arup & Partners Limited
any circumstances accept any duty, responsibility or                            this reason, we accept no responsibility for the
                                                                                realisation of any projection, forecast, opinion or         London School of Economics
liability to any third party whatsoever (including
property investors whether by bond issue or otherwise)                          estimate. Findings are time-sensitive and relevant only     Gerald Eve
who has relied on this report in circumstances where                            to current conditions at the time of writing. We will not   March 2021
they and we have not signed a reliance letter in the                            be under any obligation to update the report to address
form attached to our appointment. Accordingly, we                               changes in facts or circumstances that occur after the
disclaim all liability of whatever nature (including in                         data of our report that might materially affect the
negligence) to any third party other than to our client,                        contents of the report of any of the conclusions set                           Matthew Dillon
or to any third party with whom we have agreed a                                forth therein. No person other than our client and any
                                                                                party to who reliance has been expressly permitted by                          matthew.dillon@arup.com
reliance letter (and such liability is subject always to
the terms of our agreement with the client and the                              us pursuant to a reliance letter may copy (in whole or
reliance letter with the third party). In preparing this                        in part), use or rely on the contents in this report
report we have relied on information provided by                                without prior written permission. Any copying or use
                                                                                of this report (in whole or in part) by any party                              Joanna Rowelle
others and we do not accept responsibility for the
content, including the accuracy and completeness, of                            whatsoever shall be accompanied by or incorporate this                         joanna.rowelle@arup.com
such information. In no circumstances do we accept                              notice at all times. We accept no responsibility for, and
                                                                                have not authorised, the contents of any report,

March 2021                                                                                                                                                                                          9
The Economic Future of the Central Activity Zone (CAZ)                                  •

Phase 2 Final Report: Scenario development, model findings and policy recommendations
Report to the Greater London Authority (GLA)

I. Introduction

March 2021                                                                                  10
The Economic Future of the Central Activity Zone (CAZ)
Phase 2 Final Report: Scenario development, model findings and policy recommendations
Report to the Greater London Authority (GLA)

Foreword
Tony Travers, London School of Economics

The future home working behaviour of office workers will have a bearing on the economy, and on the physical appearance of London
As we begin to take tentative steps out of the third                            uncertainty of future home working. We outline how           All of this would have an impact on London’s built
national lockdown, we can reflect on the anniversary of                         footfall from office workers has had a significant           environment and streetscape, as well as its economic,
near-full time home working for many of London’s                                impact on the hospitality, entertainment and arts and        social and environmental outcomes. There would, of
office workers. Many of these individuals will not have                         culture industries in their location, undermining the        course, be opportunities for new companies to move
set foot in their place of work, or indeed in central                           functioning of the CAZ economic ecosystem. We also           into central London or start up there.
London, since March 2020. And many may never do                                 assume that the shift in retail habits, accelerated during   The CAZ must reinvent itself if it is going to adapt to
so again. Now, meeting a client or supplier, and even                           the pandemic, are structural and do not fully reverse.       the losses and changes caused by COVID-19 and new
attending a job interview virtually is the norm, and                            For the period since last spring, central London’s loss,     ways of working and to avoid a 'vicious cycle' of
returning to face-to-face working seems somewhat                                has, to a certain extent, been outer London’s (and the       decline setting in. But there are opportunities too and
novel. Behavioural scientists often advise that it takes                        wider region’s) gain, as office-based employees are          harnessing the positives from these future scenarios is
six weeks to form new, long lasting habits, after a year,                       more likely to spend their leisure and retail time, and      key. As we said in the introduction to our Phase 1
one might expect home working to be firmly                                      money, closer to where they currently work. A partial        Report, each of these outcomes represents a chance to
entrenched.                                                                     return to the CAZ will have an impact on the                 re-assess the functionality and performance of the
However there are signs of a potential gradual return to                        businesses that survive and thrive in different parts of     CAZ. At this major crossroads for the CAZ, for
the office. Last summer UK employers were extremely                             London, and in due course, on the offer that the capital     London, and for society, a vision for the future is
open and adaptable to continued flexible working. By                            makes to tourists and visitors.                              necessary, so that we deal with some of the older
July 2021, they might not be quite so laissez-faire, with                       A full, or near full return could see a resurgent CAZ        problems, as well as the challenges of tomorrow, and
a mixture of trust and productivity at the forefront of                         pick up almost where it left off, with a greater number      so that when the CAZ does recover, it will work better
employers minds. Some employers have come forward                               of individuals making slightly fewer trips, potentially      for everyone. Policy-makers at all level have choices to
and expressed their will to get their people back to the                        leading to higher spend overall. But it is in the            make.
office. At the same time, many employees will have                              scenarios with widespread home working that a
suffered mental health impacts as a result of a winter in                       substantial change and reinvention of the CAZ is
virtual isolation from both friends and colleagues. For                         likely. In this version of the future we may have
many, including a majority of those that responded to                           employers having to work very hard to entice their                             Tony Travers
the surveys we refer to in this report, a balance between                       employees back to the office. We may also have the                             Director
home and office-based working appears to be emerging                            CAZ suffering initially, and then responding to the
as the optimum.                                                                                                                                                London School of Economics
                                                                                lower office worker footfall by evolving the leisure
In this report we model scenarios to take account of the                        offer, and growing its residential population over time.
March 2021                                                                                                                                                                                           11
The Economic Future of the Central Activity Zone (CAZ)
Phase 2 Final Report: Scenario development, model findings and policy recommendations
Report to the Greater London Authority (GLA)
Introduction
Aims of the study
Our scope and phases of work implications to support a sustainable recovery for both out, and to take effect.
The report researches the future of the Central the CAZ, and London in each scenario, with the two The reader should bear this volatility in mind when
Activities Zone (CAZ), to assess the impact of both the time periods in mind: studying this work.
COVID-19 global pandemic and Brexit on the CAZ in • Medium-term (2 – 5 years, i.e. from 2023-2026). Our work assumes that the health emergency as a result
the medium term (2 – 5 years) and long term (5 – 10 • Long-term (5 – 10 years, i.e. from 2026-2031). of the pandemic has concluded within two years but,
years). The CAZ operates alongside the rest of the that some cultural and behavioural legacies may
capital and therefore the study also examines the Although the focus of our modelling is beyond the
immediate recovery phase from COVID-19, some of endure, including a fear of further pandemics, or new
relationship this impact will have on London as a strains, that social distancing conventions may remain,
whole. our recommendations are for immediate action, as well
as some to be taken in the medium and longer term. and that there is not a further significant macro-
Arup, Gerald Eve and the London School of economic shock.
Economics were appointed by the Greater London Our assumptions on COVID-19
As far as possible, we also assume that the medium to
Authority (GLA) to carry out the work in two stages. This work has been produced during a hugely uncertain long-term government response is yet to be determined
• Phase 1, was a baseline review of the CAZ with a period. Both phases of this work were carried out (that is, we do not assume a particular set of policy
particular emphasis on office use trends in the CAZ; during the period between December 2020 and March responses in the work). Additionally, the modelling,
interdependencies within the CAZ ecosystem; and, 2021, a time in which significant public health, including the GLA macroeconomic scenarios which
the interaction of the CAZ with the rest of London economic and political decisions were being made, have fed into this work, was conducted prior to the
and the UK. Our phase 1 report (Arup, 2021) was including: March 2021 budget.
published on 1 February 2021. • A Brexit deal was announced, though it did not Our study area
• Phase 2, covered in this report, builds three cover financial services.
As with the Phase 1 report, the analysis compares the
scenarios which test the scale of the economic • A new Hong Kong migrant visa was made public. CAZ, an area defined using boundaries based on the
impact on the CAZ over the medium and long-term. • The UK left one national lockdown to enter (and London Plan (GLA, 2021c), to other parts of London,
We look at the impact of these scenarios on the begin taking steps out of) another. and the city overall. We also interrogate differences
CAZ and the rest of London across a range of between three areas we have defined within the CAZ:
economic indicators including place based GVA • New strains of the COVID-19 virus spread rapidly
(and in some cases, receded). West End, City and the East and Riparian South. For
and employment across sectors. more information on our study areas, see Appendix E.
We provide policy recommendations and strategy • The UK vaccination programme began to be rolled
March 2021 12The Economic Future of the Central Activity Zone (CAZ) • Phase 2 Final Report: Scenario development, model findings and policy recommendations Report to the Greater London Authority (GLA) II. Three future scenarios March 2021 13
The Economic Future of the Central Activity Zone (CAZ)
Phase 2 Final Report: Scenario development, model findings and policy recommendations
Report to the Greater London Authority (GLA)

Three future scenarios

Scenario development process
Our approach                                                                    Adopting a scenario based approach to assess future                London and the CAZ, rather than those that are
We have developed scenarios of possible economic                                outcomes is a well-established way of dealing with the             within the control of the Mayor and other decision-
futures that address the impact of Brexit, of COVID-                            high uncertainty around the major factors affecting the            makers.
19, and of home working, and other factors for the                              capital in the next few years.                                 •   To have the scenarios as plausible outcomes, with a
CAZ and for the rest of London.                                                 This helps the CAZ, and London, identify areas for                 reasonable probability of occurrence, not at the
Why scenarios?                                                                  competitive advantage, plan policy responses, build an             boundaries of possibility, and for the scenarios to be
                                                                                understanding of how key trends interact, and what the             broadly consistent with the findings of our Phase 1
Scenarios provide a hypothetical illustration of                                various pathways into the future may look like.                    report.
plausible futures which help decision makers to frame
their strategic thinking, and to test and refine options.                       Our scenarios are used to identify both negative               •   At the same time, to give a reasonably wide range
The unique uncertainty at this time, on issues as diverse                       impacts and emerging opportunities for the CAZ and                 of futures that are distinct from one-another.
as the economy, future home working patterns,                                   lead to a suite of policy recommendations, which               •   To frame the scenarios so that they investigate two
population and migration and, future tourism trends,                            include implications for business, transport, arts and             of the key questions in our commission: estimating
are all incredibly important drivers in the performance                         culture, place, and community.                                     the economic impact of a permanent shift to home
and success of the CAZ and London. The scenario                                 Scenario development process                                       working on behalf of office-based workers, and the
planning in this report allows us to tell a story around                        Our focus is beyond the immediate recovery phase                   extent to which any loss in spend and footfall in the
this breadth of possible futures, and for the GLA to                            from COVID-19, and up to the end of the next decade,               CAZ is mitigated by increased activity in other
plan policy responses accordingly. Rather than asking                           to include:                                                        areas of London.
what will happen, scenarios focus us on what could                                                                                             •   To be useful and to help drive policy
happen, enabling plans for not just the predictable, but                        •       Medium-term (2 - 5 years, i.e. from 2023-2026).
                                                                                                                                                   recommendations, and
also the unexpected.                                                            •       Long-term (5 – 10 years, i.e. from 2026-2031).
                                                                                                                                               •   To build on the scenario planning work already
Scenarios are plausible descriptions of how the future                          Our guiding principles in the scenario development                 undertaken by TfL (see p.86 Appendix C).
may develop, based on a coherent set of assumptions                             process have been as follows:
about key relationships and driving forces. Here it is                          •       As far as possible, to have the scenarios relate to
key to consider that, the further we look into the future,                              external factors, that is, things that are ‘done to’
the greater the range of possibilities and uncertainties.

March 2021                                                                                                                                                                                             14
The Economic Future of the Central Activity Zone (CAZ)
Phase 2 Final Report: Scenario development, model findings and policy recommendations
Report to the Greater London Authority (GLA)
Three future scenarios
Scenario development process
Trends common across all scenarios vacant in the CAZ in the next 10 years will be lower location, but office workers ‘save up’ some of this
There are some elements of change that offer a higher grade office accommodation, or retail space. spend for the days that they visit the CAZ, so that the
level of certainty which, following our analysis of • Further growth in appetite for hospitality and leisure, impact of lower footfall on the central area is
trends, we feel confident enough to be common to all which have been growing significantly (the extent of mitigated somewhat. Hospitality and retail spend that
three scenarios. These may be established government growth may differ across scenarios). Nationwide, does not take place in the CAZ is spent closer to the
policy or law, long term trends that have been recreation and culture were the largest drivers in the home location, online, or is ‘lost’. We have also
relatively unimpacted, or even accelerated by COVID- increase in household spending between 2012 and tested a scenario where all food and beverage, retail
19, or because they follow rules of logic. These 2019 (ONS, 2020), is now almost the single largest and entertainment spend is fully transferred from the
include: category of household expenditure, and is particularly CAZ to the working location, pro-rated to the number
important to Londoners (London and Partners, 2020a of days (in Appendix A).
• An assumption that the timescales for removal of the
winter 2020/2021 lockdown measures, as outlined by and 2020b). • The average age of office workers and other visitors
the Prime Minister on 22 February 2021 (HM • Increased digitisation over time (more time spent to the CAZ is likely to decrease, as older employees
Government, 2021), are broadly adhered to, and that working and socialising online, often at home, over are less likely to return more often than younger ones
international travel restrictions are lifted and inbound time), as new technology emerges. (YouGov, 2020; Hassell, 2020), and
international tourism begins to recover during 2021 • Increased pressure to accelerate action to tackle • London’s labour market capture increases as the
and 2022. We assume no further pandemics, but fear climate change, including achieving net zero by 2050 number of days spent working from home increases,
of a future pandemic varies according to each being part of UK law, and with many local authorities as identified in our Phase 1 report and JLL (2020).
scenario. including the Mayor of London committed to reach The Elizabeth line opens 2022, and HS2 opens from
• A ‘flight to quality’ in office space, as identified in that goal by 2030. Note that the Committee on 2029, creating opportunities for greater longer
our Phase 1 report (Arup, 2021). Climate Change’s (CCC’s) pathways to achieving net distance commuting, particularly from the west and
zero suggest that air travel volume is limited to no the Midlands.
• A move to online retail over time. The British Retail
Consortium (2019) and Retail Economics (2019) more than a 60% increase on 2005 levels by 2050 Trends that differ across scenarios
both suggest an decrease in the share of in-person (CCC, 2019) and assume significant aircraft fuel Our scenarios differ in terms of their assumptions to a
retail in future, with significant transfer online, with a efficiencies. number of key variables including the economy, office
pre-pandemic projection of over 50% of retail by • Food and beverage spend by office-based employees worker behaviour, London’s population and the return
value being internet-based by 2030. Together, these follows working location, as per the footfall and on tourism. On the following pages we explore each of
trends mean that much of the property becoming spending trends cited in our Phase 1 report. Retail these variables in more detail.
March 2021
and hospitality spend also broadly follows working 15The Economic Future of the Central Activity Zone (CAZ)
Phase 2 Final Report: Scenario development, model findings and policy recommendations
Report to the Greater London Authority (GLA)
Three future scenarios
Assumptions on the economy
6
Employment and GVA projections COVID-19 trend by 2031. Our less optimistic
Employment Count (Millions)
Our scenarios use the GLA’s economic scenarios scenario uses the GLA’s ‘slow economic
5.5 Historical data
for London (2021g), broadly extrapolating their recovery’ scenario’s employment and matches it
2021-23 growth rates to give a projection until with a slightly modified version of the same GLA
5 No COVID-19
2031, taking account for Brexit and COVID-19. scenario which is in line with the National
Institute of Economic and Social Research’s Fast economic
The GLA have three scenarios for future worst-case medium-run projection (NIESR, 4.5 recovery
economic growth: 2021). Slow economic
recovery
• Fast economic recovery. London’s economy The gradual return to economic growth scenario, 4
returns to its pre-COVID-19 trend growth which assumes a successful vaccine roll-out, and
(rate and level) by 2023. No medium-term or a gradual return to normal, has GVA contribution
long-term economic scarring. declining by 7% in 2020, before rebounding to London Employment 2011-2031 (Source: ONS (2021) and GLA (2021g) and
Arup)
• Gradual return to economic growth. London’s pre-COVID-19 levels by mid-2022. GVA and
economy returns to its pre-COVID-19 trend employment growth rebound by the mid-2020s
growth rate eventually, but only in the long- with GVA growth slightly outpacing the previous GVA Greater London
term (after 5+ years) as there is a degree of No COVID-19 trend, so that this projection
0.8
economic scarring in the medium term. reaches around 100,000 fewer jobs than the No
GVA (£bn, 2020 prices)
• Slow economic recovery. Persistent economic COVID-19 trend by 2031. 0.7 Historical data
scarring means that in the long-term the In the slow economic recovery scenario, 0.6 No COVID-19
economy will see a slow recovery to a London’s GVA contribution is expected to
0.5
diminished trend growth trajectory by 2030. decline by 11% in 2020 and close to 300,000 jobs Gradual return to
Our analysis uses the ‘gradual return to economic will be lost, and it is not expected to return to pre- 0.4 economic growth
growth’ scenario’s GVA and GVA/job for our COVID-19 levels until 2023, and remain below Slow economic
0.3 recovery
most optimistic scenarios, but matches them with the No COVID-19 trend.
the ‘fast economic recovery’ scenario’s
employment to provide a balanced scenario which London GVA 2011-2031 (Source: ONS (2021) and GLA (2021g) and Arup)
assumes that London’s economy reaches the No
March 2021 16The Economic Future of the Central Activity Zone (CAZ)
Phase 2 Final Report: Scenario development, model findings and policy recommendations
Report to the Greater London Authority (GLA)
Three future scenarios
Assumptions on the economy
Stronger growth in arts, culture and hospitality to grow in local centres, and in more diverse, Workforce jobs annual growth rate in 2022
The GLA’s gradual return to growth scenario specialist areas. Sector %
projects that the arts and culture, and hospitality Emerging professional services are expected to Agriculture, forestry and fishing 1.0
industries experience positive growth again, after a drive the office recovery Mining and quarrying -4.3
significant gap during the pandemic. The GLA anticipates the fastest growing office- Manufacturing -1.0
Employment in arts, entertainment and recreation is based sectors within the CAZ will be the tech-and Electricity, gas, steam and air-conditioning supply 1.2
expected to increase by 20% in the year 2022 and science-based industries, which are expected to Water supply; sewerage and waste management -2.4
accommodation and food service activities are also grow at 5.1% and 6.2% in 2022 respectively.
Construction 10.8
projected to grow similarly, at an annual rate of Additionally, in the long run the green economy
15%. An eventual return to pre-COVID-19 levels (clean tech, circular economy start ups, etc) is Wholesale and retail trade; repair of motor vehicles -2.2
appears more likely in arts and culture and expected to increase its share. Transportation and storage -1.1
hospitality given their strong position before These industries saw strong growth between 2015 Accommodation and food service activities 15.3
COVID-19, and the possibility of further and 2019, when the number of people working in Information and communication 5.1
government support for the former. The exact speed the IT, consultancy and related activities within the Financial and insurance activities 1.6
and pattern of growth will depend on footfall and CAZ alone soared from 58,000 to 75,000 within
underlying demand. Real estate activities 5.2
five years.
Construction industries are also expected to see Professional, scientific and technical activities 6.2
They fared well in 2020 and 2021 during COVID-
double digit growth. 19 lockdowns (GLA, 2021g), and are set to recover
Administrative and support service activities 5.6
Challenges continuing for retail far more quickly than face-to-face industries. Public administration and defence; compulsory social security 2.3
Education 1.0
For retail the outlook is less bullish, and the GLA’s
forecast even shows a 2.2% yearly decrease for jobs Human health and social work activities 2.0
in wholesale and retail trade in 2022. Arts, entertainment and recreation 20.1
This reflects traditional brick-and-mortar retailers Other service activities 5.7
struggling with competition from online shopping Activities of households 3.1
and changing consumer behaviour patterns. Workforce jobs annual growth rate in 2022 for the GLA’s gradual
However, there remains an opportunity for retailers return to economic growth scenario, selected highlighting (Source:
GLA 2021g)
March 2021 17The Economic Future of the Central Activity Zone (CAZ)
Phase 2 Final Report: Scenario development, model findings and policy recommendations
Report to the Greater London Authority (GLA)
Three future scenarios
Assumptions on the economy
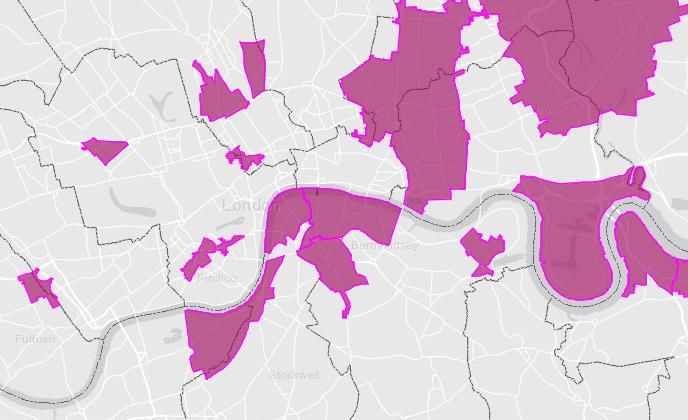
London’s Opportunity Areas, major developments Opportunity Areas are characterised by having
and the CAZ significant development capacity to accommodate new
homes, commercial development and infrastructure,
46,300 houses
Opportunity Areas are those designated by the GLA
for significant development; both housing and linked to existing and planned improvements in public
transport connectivity and capacity.
193,100 jobs
commercial use. Many of these areas contain major are expected to be developed in the Opportunity Areas within
developments that are within, or close to the CAZ’s Many of the Areas located within or adjacent to the and bordering the core CAZ (NIoD futures are additional).
Source: GLA (2021e)
boundaries, including: CAZ are well established and are classified as
• The City fringe and Tech City ‘underway’ or ‘maturing’ in the London Plan,
reflecting that planned development is expected to be
• Isle of Dogs completed over the short to medium term. Together
• Bankside, Borough and London Bridge these Areas will provide over 85,000 new homes and
• Waterloo 270,000 new jobs (GLA, 2021c).
• Elephant and Castle
• Vauxhall, Nine Elms and Battersea
• Victoria
• Tottenham Court Road
• Paddington
• Euston, and
• Kings Cross and St Pancras.
A significant portion of the CAZ, particularly in the City,
NiOD and Riparian South, is given over to Opportunity
Areas (Source: GLA, 2021e)
March 2021 18The Economic Future of the Central Activity Zone (CAZ)
Phase 2 Final Report: Scenario development, model findings and policy recommendations
Report to the Greater London Authority (GLA)
Three future scenarios
Assumptions on office worker behaviour
The future extent of home working reluctance to travel on public transport as a result. employees appear to favour a hybrid option, as shown
The popularity of full-time home working plateaued As a busy place, extremely well served by in the chart. As few surveys ask for the number of days
before COVID-19, but the forced experiment of the sustainable transport, this risks impacting the CAZ per week, and many do not ask for pre-pandemic
lockdowns and social distancing restrictions has led to more than many cities. behaviour, making assumptions on exact number of
the adoption of new working conventions, a greater • Behavioural factors including cultural norms, the days in the office, is challenging, although simple
understanding on behalf of some employers, fear of missing out (of office life, and also of CAZ- calculations suggest the range of possible futures is
complementary technologies and broader social based arts, culture and leisure opportunities), the significant, with a concentration of estimates between
acceptance of these practices. This is likely to be the potential for drifting back over time, seasonality, two and four fifths of 2019 levels.
longest-term impact of the crisis and a human fondness for being at home on days of
Nevertheless, our Phase 1 report identified that this the week closest to the weekends (Arup, 2021). 100%
90%
likelihood to remain at home, or come into the office, • The quality of the supplementary offer (working
varied significantly among individuals and employers, life, social contact, hospitality, retail, arts and 80% Full time
in
according to a number of factors: culture) in the CAZ versus the home location. 70%
workplace
60%
• Depending on industry, certain office-based sectors • Supply-side actors such as pressure from employers Hybrid /
50%
and tasks are performed more efficiently at home. to return, or conversely, employers downsizing some of
40%
Others thrive on human contact and co-creation. office accommodation to save costs. There may also the time
30%
Self-contained and skilled routine work is more be policy on behalf of governments (which may
20% Full time
likely to be successful in working from home particularly impact public sector white collar at home
(Choudhury et al, 2019) than parts of the economy workers). 10%
which are based on non-routine cognitive work. 0%
• Trust and culture between employees and YouGov YouGov BCO WISERD Slack
• There is some evidence that younger and older employers, particularly when productivity is (2020) (2020) (2020) (2020)* (2020)
employees, and men, are more likely to wish to perceived to be at risk. Pre-COVID-19 Post-COVID-19
return to the office, than the middle grades, and Overall there is a great deal of uncertainty about the (reported) (intention)
women (YouGov, 2020, Hassell, 2020). likelihood of continued widespread home working. Pre-pandemic and post-pandemic working locations
• Social distancing rules and conventions may Many employers appear to have put off decisions on YouGov survey based on a cross-section of London workers.
remain, and along with them, the fear of (or the office size until after the pandemic (Arup, 2021), with Other surveys based on UK office workers, or those that were
home working during the pandemic. * In the WISERD results ‘full
occurrence of) another pandemic, and the potential more home working likely post-pandemic. Most time at home’ includes working from home “often or all of the time”.
March 2021 19The Economic Future of the Central Activity Zone (CAZ)
Phase 2 Final Report: Scenario development, model findings and policy recommendations
Report to the Greater London Authority (GLA)
Three future scenarios
Assumptions on office worker behaviour
Experience from Australia and New Zealand as we showed in our Phase 1 report, this and other
Australia and New Zealand have had significantly factors meant that London office workers lagged
fewer COVID-19 deaths than the United Kingdom, and behind their overseas counterparts in returning to
with the exception of some local lockdown restrictions, their desks in summer 2020.
have been relaxing COVID-19 restrictions for several • Londoners have spent a greater period working
months. Both countries were under more severe from home, and under other COVID-19 restrictions,
restrictions, including mandatory working from home, and have therefore had more time to form habits.
for long periods in 2020. As such Australian and New • The pandemic is still in progress in both Auckland
Zealand cities represent case studies for office worker and Sydney, with some restrictions are still in place,
behaviour in London, post-COVID-19. the level of public transport use is still increasing.
In the first two weeks of February 2021, Auckland’s
public transport system carried 63% of the volume of
the equivalent period the previous year. In January the 200%
figure was 61%, and in December the figure was, at 180%
82%, driven by increased travel over the Christmas 160%
period, remarkably close to the normal volume 140%
(Auckland Transport, 2021).
120%
In Sydney the transport network was reportedly 100%
carrying 60% of its normal volume in mid-February Daily
80%
(Sydney Morning Herald, 2021), with increases of 7 day average
approximately 3% week-on-week (TfNSW, 2021). 60%
This is broadly consistent with anecdotal evidence 40%
given to us of a normal 3-4 day in-office post- 20%
pandemic working week in both countries. 0%
Public transport ridership in Auckland in
December, January and February, compared
Whilst this is encouraging, care should be taken when with equivalent day the previous year
applying this directly to the London context. Source: Auckland Transport (2021)
• Travel-to-work distances are longer in London, and
March 2021 20The Economic Future of the Central Activity Zone (CAZ)
Phase 2 Final Report: Scenario development, model findings and policy recommendations
Report to the Greater London Authority (GLA)
Three future scenarios
Assumptions on residential population
10
The population of London was at an all time high then exceeding pre-COVID-19 levels, to surpass
Historical
before the pandemic. Despite reports of recent the No COVID-19 trend by 2030. The CAZ grows data
Population (m)
mass out-migration particularly by EU workers, even more significantly and surpasses the No 9.5
No
and opportunities for in-migration, particularly COVID-19 trend by 2027. COVID-19
from Hong Kong, London’s population continues ‘Moderate growth’ assumes that population
9 Significant
to be substantially governed by birth and death growth
broadly follows the pre-COVID-19 rate, from a Moderate
rates. The GLA expects growth to continue in the lower base, meaning that it is consistently below 8.5
growth
long run, albeit at a slightly slower rate than in the No COVID-19 trend. Stagnation
previous decades. We take the GLA’s housing-led 8
projections as the No COVID-19 baseline. 2011 2013 2015 2017 2019 2021 2023 2025 2027 2029 2031
Our scenarios use the GLA’s significant and London population, 2011-2031 (Source: GLA (2020d) Population and Household
moderate residential growth scenarios and add a Projections)
stagnation projection, which assumes that both the
CAZ’s and London’s populations remain at 2019
levels in the period to 2031. In this scenario, the 0.39
difference between birth and death rates, and
continuing inflow of new residents is 0.37 Historical
counterweighted by workers leaving London as 0.35
Population (m)
remote working and fewer work opportunities No
0.33
make the city less attractive. Note that the COVID-
stagnation scenario is outside of the low range of 19
0.31
Moderate
the GLA’s projections. growth
0.29
‘Significant growth’, the most optimistic GLA
0.27 Significa
projection, has London’s population returning, and nt growth
0.25
2011
2012
2013
2014
2015
2016
2017
2018
2019
2020
2021
2022
2023
2024
2025
2026
2027
2028
2029
2030
CAZ population (Source: GLA (2020d) Population and Household Projections)
March 2021 21The Economic Future of the Central Activity Zone (CAZ)
Phase 2 Final Report: Scenario development, model findings and policy recommendations
Report to the Greater London Authority (GLA)
Three future scenarios
Assumptions on tourism
The impact of tourism on footfall and spend in the similar economic challenges caused by the pandemic, reduce if fears of a future pandemic remain.
CAZ is significant. GLA (2020a) suggested that the disposable incomes may be lower, and foreign leisure We noted in our previous report that Tourism
impact of lost spend from the absence of tourists in travel less likely. Furthermore, the impact of Brexit Economics advised (in autumn 2020) that in the
2020 was some £10.9bn, over five times higher than may also hinder the return of European visitors, who medium-term London will continue its lead as the most
impact from the absence of office workers, at £1.9bn. may be less inclined to visit the UK given new travel popular city destination in Europe, and by 2025 will be
As well as having a high impact, the future of tourism, requirements. comfortably exceeding its 2019 numbers of visitors.
when it will return, and at what rate, appears to be It can be helpful to separate tourists into a number of We did note previously that these projections may be
getting more uncertain. The UK government removed different categories. Office workers that remain after threatened through a continuation of travel restrictions,
all travel corridors in mid-January 2021, and at the work to enjoy the leisure facilities are not treated as fear of a future pandemic, or of future strains. As a
time of writing, requires all international passengers to tourists in this report. result of the most recent restrictions, and the continued
quarantine. Hotel quarantine was introduced from • Day visitors, mostly from London and the south spread of the virus, we are now including a more
certain countries in mid-February. Many other east. downbeat projection for tourism’s recovery within our
countries now require testing, or quarantine scenarios, with recovery to 2019 levels by around the
themselves, which adds cost, risk and unpleasantness to • Overnight domestic visitors.
middle of the decade, or later, depending on the
an overseas trip. The recent suggestions by UK • Overnight international visitors. scenario.
government is that the restrictions may be in place for • Business travellers.
some time (see for example LBC, 2021). Even if
domestic travel is allowed, it is possible that an Of these, we suggested in our Phase 1 report (Arup,
aversion to large cities such as London may persist 2021) that day, domestic, and short-haul international
after COVID-19. This is supported by London seeing visitors were likely to return first, and that the future
only 20% occupancy over the summer of 2020 after for business travel was less buoyant than leisure travel.
restrictions were lifted compared to 90% a year earlier Potentially, there is a secondary impact if the virus
(ONS, 2021). remains a threat, which is a reduced casualisation of
international travel, whereby (long haul trips) are
The global economic recovery will also play a part planned longer in advance, and the length of stay and
here, and if other countries around the world face spend increases. The average age of a tourist may also
March 2021 22You can also read


