The Economics of All-Electric New Construction in Utah - An evaluation of residential new construction costs and energy bill impacts for ...
←
→
Page content transcription
If your browser does not render page correctly, please read the page content below

The Economics of All-Electric
New Construction in Utah

An evaluation of residential new construction costs and
energy bill impacts for single-family and low-rise multi-
family properties across the state

February 2022

Acknowledgements
This analysis and report were produced by Energy and Environmental Economics, Inc (E3) in collaboration
with the Building Electrification Institute and members of an advisory committee. E3 led the economic
modelling efforts and overall report development with input and assistance from the committee. E3 staff
that participated in this project are listed below along with advisory committee members.
Energy and Environmental Economics (E3): Michael Sontag, Brian Conlon, Jun Zhang, Sruthi
Davuluri, and Amber Mahone
Building Electrification Institute (BEI): Tyler Poulson and Jenna Tatum
Utah Clean Energy (UCE): Kevin Emerson and Thomas Kessinger
Salt Lake City Corporation: Peter Nelson
Steven Winter Associates: Robin Neri
Energy and Environmental Economics, Inc. (E3)
44 Montgomery Street, Suite 1500
San Francisco, CA 94104
© 2022 Energy & Environmental Economics, Inc.
415.391.5100 | 44 Montgomery Street, Suite 1500, San Francisco, CA 94104 | www.ethree.com
Table of Contents
List of Figures _____________________________________________________________ i
List of Tables _____________________________________________________________ ii
Acronym Definitions ______________________________________________________ iii
Executive Summary ________________________________________________________ 1
1    Introduction __________________________________________________________ 3
2    Methodology __________________________________________________________ 6
    2.1 Building Prototypes___________________________________________________________ 6
      2.1.1 Adjustments to DOE Prototype Building Characteristics, HVAC Modeling and Sizing _____ 8
    2.2 Technology Packages _________________________________________________________ 8
      2.2.1 Cold Climate Air Source Heat Pumps (ccASHPs) _________________________________ 10
      2.2.2 Technology Costs ________________________________________________________ 11
    2.3 Avoiding Gas Infrastructure Costs and “Electric Ready” Scenario ______________________ 12
      2.3.1 Cost Savings by Avoiding Gas Infrastructure ___________________________________ 12
      2.3.2 “Electric Ready” New Construction __________________________________________ 13
    2.4   Energy Utility Rates__________________________________________________________ 14
3    Results______________________________________________________________ 16
    3.1   Building Energy Consumption__________________________________________________ 16
    3.2   First Year Energy Bills ________________________________________________________ 19
    3.3   Installed Technology Costs ____________________________________________________ 22
    3.4   Net Present Value Lifecycle Cost _______________________________________________ 25
4    Conclusion ___________________________________________________________ 28
5    Summary of Citations __________________________________________________ 29
6    Appendix ____________________________________________________________ 34
    6.1   Single-Family Results ________________________________________________________ 34
    6.2   Multi-Family Results – All Figures Reflected on a “Per Dwelling Unit” Basis _____________ 37

              415.391.5100 | 44 Montgomery Street, Suite 1500, San Francisco, CA 94104 | www.ethree.com
List of Figures
Figure 1. Summary of prototype buildings used in this analysis ......................................................... 7
Figure 2. Map of Utah's ASHRAE climate zones and location of weather stations................................. 7
Figure 3. Summary of Technology Specifications and Assumed Rated Energy Performance for the Single-
Family and Multi-Family Prototypes Modelled for this Report .........................................................10
Figure 4. Site Energy Consumption by Climate Zone and Technology Package for the Single-Family Home
Prototype. “Electrified Loads” in all-electric buildings reflect the energy loads that are served by gas in the
mixed fuel buildings, including space heating, water heating, cooking, and clothes drying. CC Ductless All-
Electric represents packages with a cold climate ductless heat pump. ..............................................17
Figure 5. Site Energy Consumption by Climate Zone and Technology Package for the Multi-Family Building
Prototype (normalized by Dwelling Unit). “Electrified Loads” in all-electric buildings reflect the energy
loads that are served by gas in the mixed fuel buildings, including space heating, water heating, cooking,
and clothes drying. CC Ductless All-Electric represents packages with a cold climate ductless heat pump.
..............................................................................................................................................18
Figure 6. First-year Annual Energy Bills by Climate Zone and Technology Package for the Single-Family
Home Prototype. CC Ductless All-Electric represents packages with a cold climate ductless heat pump. 20
Figure 7. First-year Annual Energy Bills by Climate Zone and Technology Package for the Multi-Family
Building Prototype (normalized by Dwelling Unit). CC Ductless All-Electric represents packages with a cold
climate ductless heat pump. .......................................................................................................21
Figure 8. Installed Technology Costs by Climate Zone and Technology Package for the Single-Family Home
Prototype. Hatched area in bar charts denotes the counterfactual mixed-fuel building. CC Ductless All-
Electric represents packages with a cold climate ductless heat pump. ..............................................23
Figure 9. Installed Technology Cost by Climate Zone and Technology Package for the Multi-Family Building
Prototype (normalized by Dwelling Unit). Hatched area in bar charts denotes the counterfactual mixed-
fuel building. CC Ductless All-Electric represents packages with a cold climate ductless heat pump. ......24
Figure 10. Present Value Lifecycle Costs Over a 15-year Time Horizon by Climate Zone and Technology
Package for the Single-Family Home Prototype. CC Ductless All-Electric represents packages with a cold
climate ductless heat pump. .......................................................................................................26
Figure 11. Present Value Lifecycle Costs Over a 15-year Time Horizon by Climate Zone and Technology
Package for the Multi-Family Building Prototype (normalized by Dwelling Unit). CC Ductless All-Electric
represents packages with a cold climate ductless heat pump. .........................................................27
415.391.5100 | 44 Montgomery Street, Suite 1500, San Francisco, CA 94104 | www.ethree.com iList of Tables
Table 1. Dominion Energy Utah Gas Rates ....................................................................................14
Table 2. Rocky Mountain Power Residential Electric Rates ..............................................................15
Table 3. City of St George Utilities ...............................................................................................15
Table 4. Quantified Results From Figure 6.....................................................................................20
Table 5. Quantified Results from Figure 7. Costs are reflected on a per dwelling unit basis...................21
Table 6. Quantified Results for Figure 8. See Section 2.3.1 for further details on additional gas
infrastructure costs not reflected below. ......................................................................................23
Table 7. Quantified Results for Figure 9. See Section 2.3.1 for further details on additional gas
infrastructure costs not reflected below. ......................................................................................24
415.391.5100 | 44 Montgomery Street, Suite 1500, San Francisco, CA 94104 | www.ethree.com iiAcronym Definitions
Acronym Definition
AC Air Conditioning
AFUE Annual Fuel Utilization Efficiency
ASHP Air Source Heat Pump
ASHRAE American Society of Heating, Refrigerating and Air-Conditioning
Engineers
ccASHP Cold Climate Air Source Heat Pump
COP Coefficient of Performance
CZ Climate Zone
DOE U.S. Department of Energy
EF Energy Factor
EIA Energy Information Administration
EPA U.S. Environmental Protection Agency
EV Electric Vehicle
ER Electric Resistance
GHG Greenhouse Gas
HFCs Hydrofluorocarbons
HPWH Heat Pump Water Heater
HVAC Heating, Ventilation, and Air Conditioning
ICCT International Council on Clean Transportation
IECC International Energy Conservation Code
kWh Kilowatt-hour
MMBtu Million British Thermal Units
NEEP Northeast Energy Efficiency Partnership
NO2 Nitrogen Dioxide
NOx Nitrogen Oxides
NPV Net Present Value
PM2.5 Fine Particulate Matter
PNNL Pacific Northwest National Laboratory
RECS Residential Energy Consumption Survey
SEER Seasonal Energy Efficiency Ratio
SWEEP Southwest Energy Efficiency Project
TMY3 Typical Meteorological Year weather data format
UBCC Uniform Building Code Commission
UCE Utah Clean Energy
UEF Uniform Energy Factor
415.391.5100 | 44 Montgomery Street, Suite 1500, San Francisco, CA 94104 | www.ethree.com iiiExecutive Summary
This report features an analysis of the energy use and financial outcomes of two different approaches to
constructing new residential properties in Utah. Specifically, this report evaluates installed cost impacts,
energy use, and resulting energy bill costs for:
• Newly constructed all-electric single-family homes and low-rise multi-family buildings built with
equipment and appliances that only use electricity; and,
• Newly constructed “mixed fuel” single-family homes and low-rise multi-family buildings built
with equipment and appliances that use both electricity and natural gas (shortened to “gas” in
remainder of report).
Interest in all-electric properties has been increasing throughout Utah due to the associated air quality,
public health, and environmental benefits from this type of construction. These benefits are increasingly
accessible as all-electric technologies like air-source heat pumps (ASHPs) and heat pump water heaters
(HPWHs) continue to improve in energy performance, particularly for colder climates, thus reducing the
operating costs of these technologies for basic household energy needs like space heating and water
heating.
This analysis relies on pre-existing datasets and modelling software from the U.S. Department of Energy
(DOE) to estimate the installation costs, operational energy use, and ongoing utility bills for newly
constructed all-electric residential properties and “mixed fuel” properties. The analysis was completed for
all three common climate zones in Utah, as defined by the International Energy Conservation Code (IECC).
Key takeaways from this report include:
➢ All-electric homes and multi-family properties can be built at lower cost in Utah compared to
mixed-fuel properties, which can help improve housing affordability across the state by
reducing housing construction costs;
➢ When including energy efficient technologies like electric heat pumps, all-electric homes can
result in energy bill savings for customers in all major climate zones in Utah;
➢ Equipment selection is important for maximizing energy bill savings and lifecycle benefits for
residential buildings. Financial outcomes are optimized through use of high-performing HVAC,
water heating, and other equipment;
➢ In addition to lower construction costs and enhanced energy bill affordability, all-electric
properties can deliver air quality benefits and carbon reductions while also taking advantage of
ongoing technology improvements.
These results may seem counter to certain prevailing attitudes about gas appliance use in Utah, including
the relative affordability of efficient all-electric appliances. However, the findings are in line with other
research across the country that has documented both construction cost savings and ongoing energy cost
savings associated with all-electric homes.
Economics of All-Electric New Construction in Utah 1Executive Summary Audience Note: this report was written for use by various audiences in Utah, including building professionals, housing developers, policymakers, government agencies, non-profit organizations, and members of the public who are interested in the potential of all-electric new construction in the state. Details on assumptions, data sources, and modelling approach are included within the report and its appendices. Economics of All-Electric New Construction in Utah 2
Introduction

         Introduction

Consumer Economics of All-Electric New Construction
This report provides objective data on the consumer economics of all-electric new construction in Utah.
The data presented in this report will guide members of the public, including building professionals,
housing developers, and policymakers to make well-informed decisions on building design and building
policy. This report does not put a monetary value on the environmental and social benefits of all-electric
new construction and only quantifies the costs experienced by a homebuilder, homeowner, or property
occupant such as a renter.

Consumer economics is split into two categories in this report:

    -    Installed cost: The cost to purchase and install given building systems, such as HVAC or water
         heating, during new construction. This is a function of equipment specifications and supporting
         infrastructure within a residential building.
    -    Energy bills: The ongoing costs of operating a building through electricity and gas bills. This is a
         function of equipment efficiency, building envelope characteristics, and retail energy rates.
         Occupant behavior is another factor impacting energy use, but only a single baseline set of
         assumptions was used in this analysis.

Together, these cost categories can guide decision-making in different applications. Some housing
developers may prioritize larger upfront investments with paybacks from reduced energy bills over the
building lifecycle. Other housing developers may be more sensitive to first costs and seek to minimize
upfront installed costs. Policymakers and non-profit organizations may seek building designs with lower
energy bills to provide more financial security for residents in affordable housing developments.

Finding economically beneficial opportunities for all-electric buildings in Utah will help realize other
associated benefits such as reducing air pollution to improve personal and public health and reducing
carbon emissions to help mitigate climate change. The remainder of this section explains certain public
health and environmental benefits of all-electric new construction, first focusing on local air quality and
then the reduction of carbon emissions. While the air quality and climate benefits of all-electric new
construction were not modeled in this analysis, the studies and reports referenced below make it clear
that all-electric properties will benefit local air quality and reduce carbon emissions over time.

All-Electric Homes Improve Indoor and Outdoor Air Quality
Utah residents consistently rank poor air quality among their highest issues of concern. A representative
survey of statewide residents commissioned by Envision Utah found that air quality was perceived as the
third highest rated issue in terms of “importance to Utah’s future,” ranking it ahead of other issues such

Economics of All-Electric New Construction in Utah                                                              3
Introduction as healthcare, housing, and economic development. 1 These concerns are informed by direct experience in northern Utah where the Salt Lake City-Provo area ranks among the worst 5% of U.S. metropolitan regions in terms of number of poor ozone days annually and 24-hour particle pollution according to the 2020 “State of the Air” study by the American Lung Association. 2 All-electric properties offer a solution for improving both indoor and outdoor air quality by eliminating onsite fossil fuel combustion from gas, propane, and fuel oil appliances. Recent research from groups such as RMI has documented the indoor air quality consequences of combusting gas in stoves and cooktops. 3 Additionally, research by the U.S. Environmental Protection Agency (EPA) states that homes with gas cooking appliances experience nitrogen dioxide (NO2 ) pollution concentrations that are 50% to over 400% higher than in homes with electric cooking appliances. This same EPA study also noted that the link between gas cooking appliances and NO2 pollution remains strong even when adjusting for several factors within the home. 4 In terms of outdoor air pollution, RMI research has indicated that “because gas appliances lack effective emission controls, they emit more than twice as much NOx as gas power plants [in the U.S.], despite consuming less gas overall”. 5 Drawing off peer-reviewed research from the Harvard T. Chan School of Public Health, RMI published a state-by-state summary that reflects annual public health impacts of $361 million per year in Utah from burning fuels such as gas, oil, biomass, and wood in buildings. 6 In addition to appliance electrification, the installation of electric vehicle (EV) charging infrastructure in newly constructed buildings represents an additional opportunity to reduce local pollution and improve public health in Utah. Along with reducing carbon emissions, EVs can deliver sizable benefits for outdoor air quality. Research published by the Southwest Energy Efficiency Project (SWEEP) and Utah Clean Energy (UCE) highlighted major reductions in contributions to air pollution along the Wasatch Front in Utah for an all-electric vehicle compared to a new gasoline vehicle. The study evaluated both tailpipe emissions and upstream impacts of generating electricity at power plants and found that along the Wasatch Front, EVs reduce VOCs by 99%, reduce NOx emissions by 90%, and reduce PM2.5 emissions by 81% relative to a gasoline vehicle. 7 As a complementary solution to all-electric buildings, the transition to EVs will be accelerated if more homes and buildings install EV charging infrastructure during construction. 1 “2014 Values Study Results,” Envision Utah, 2014, https://yourutahyourfuture.org/images/final_values_study_report.pdf 2 “State of the Air,” American Lung Association, 2020, https://www.lung.org/research/sota/city-rankings/msas/salt-lake-city-provo-orem-ut#pm24 3 “Gas Stoves: Health and Air Quality Impacts and Solutions,” RMI, 2020a, https://rmi.org/insight/gas-stoves-pollution-health/ 4 “Integrated Science Assessment for Oxides of Nitrogen – Health Criteria,” U.S. EPA, 2008, https://cfpub.epa.gov/ncea/isa/recordisplay.cfm?deid=194645 5 “Factsheet: Why EPA Must Address Appliance Pollution,” RMI, 2021a, https://rmi.org/wp-content/uploads/2021/04/rmi_factsheet_appliance_pollution.pdf 6 “What is the Health Impact of Buildings in Your State?,” RMI, 2021b, https://rmi.org/health-air-quality-impacts-of-buildings-emissions 7 “The Potential for Electric Vehicles to Reduce Vehicle Emissions and Provide Economic Benefits in the Wasatc h Front,” Southwest Energy Efficiency Project (SWEEP) and Utah Clean Energy (UCE), 2017, https://www.swenergy.org/data/sites/1/media/documents/publications/documents/2017_EV_Emissions_Update_Wasatch_Fr ont_Jan-2017.pdf Economics of All-Electric New Construction in Utah 4
Introduction

All-Electric Homes Reduce Carbon Emissions
In addition to improving local air quality, all-electric buildings have the potential to reduce carbon
emissions, particularly as the electric grid becomes cleaner and is supplied by an increasing amount of
renewable energy. Burning gas in buildings creates a sizable amount of carbon emissions across the U.S.
and in Utah. In Salt Lake City, for example, an estimated 26% of citywide carbon emissions were attributed
to onsite natural gas combustion in buildings and facilities in 2015. 8

Research published in Colorado9 , New York10 , and California11 , as well as nationally12 , identify building
electrification and corresponding electricity sector decarbonization as key pillars to decarbonizing the
building sector, and the economy more broadly. The carbon benefits of electrification in Utah are
forecasted to increase over time as the parent company of Utah’s largest electricity provider, Rocky
Mountain Power, has published a plan that would reduce greenhouse gas emissions from the electric grid
by 74% by 2030 relative to 2005 baseline. This is part of an even longer-term transition to renewable
energy by the utility’s parent company, PacifiCorp, which envisions carbon emissions from the grid being
reduced 98% by 2050. 13

Alongside the carbon benefits of electric heat pumps, installing EV charging infrastructure to support the
increased use of EVs will also help reduce emissions over product lifecycles. Among numerous studies on
this topic, the International Council on Clean Transportation (ICCT) found that “[GHG] emissions over the
lifetime of average medium-size BEVs [Battery Electric Vehicles] registered today are already lower than
comparable gasoline cars by 60%–68% in the United States”. 14 Similar to emissions trends anticipated with
electric heat pumps, the ICCT research notes that the carbon benefits of EVs will increase substantially
over time as the electric grid continues to become cleaner.

One additional consideration includes greenhouse gas emissions from refrigerants associated with certain
electric heat pump technology. Similar to central air conditioners (ACs), air source heat pumps (ASHPs)
require refrigerants to move heat in order to control interior space temperature and water temperature.
However, as research from the University of California-Davis has indicated, lifecycle carbon emissions from

8 “Climate Positive 2040,” Salt Lake City Sustainability Department, 2017, http://www.slcdocs.com/slcgreen/CP0320.pdf
9 “Colorado Greenhouse Gas Reduction Roadmap,” Colorado Energy Office, Energy and Environmental Economics, Inc, 2021,
   https://energyoffice.colorado.gov/climate-energy/ghg-pollution-reduction-roadmap
10 “Pathways to Deep Decarbonization in New York – Final Report,” Energy and Environmental Economics, Inc, NYSERDA, 2020,

   https://climate.ny.gov/Climate-Resources
11 “Deep Decarbonization in a High Renewables Future,“ Energy and Environmental Economics, Inc, 2018,

   https://www.ethree.com/wp-content/uploads/2018/06/Deep_Decarbonization_in_a_High_Renewables_Future_CEC -500-
   2018-012-1.pdf
12 “Net-Zero America: Potential Pathways, Infrastructure, and Impacts”, Larson et al, 2021,

   https://netzeroamerica.princeton.edu
13 “PacifiCorp’s updated plan accelerates a bold energy future with low-cost, reliable, sustainable power for its customers, ”

   Rocky Mountain Power, 2021a, https://www.rockymountainpower.net/about/newsroom/news-releases/2021-integrated-
   resource-plan.html
14 “A global comparison of the life- cycle greenhouse gas emissions of combustion engine and electric passenger cars,” The

   International Council on Clean Transportation (ICCT), 2021, https://theicct.org/publications/global-LCA-passenger-cars-
   jul2021

Economics of All-Electric New Construction in Utah                                                                               5
Methodology

efficient heat pump technology are lower relative to a gas furnace in residential applications in the U.S.,
even when accounting for all factors including refrigerant use. 15 Refrigerant concerns are expected to
decline over time due to recent federal legislation that requires new refrigerant rules from EPA, including
a “phase down [in] the production and consumption of HFCs [hydrofluorocarbons] by 85% below baseline
levels within the next 15 years.” 16

The above benefits combine to make all-electric new construction an attractive option for both individual
households and the broader energy systems that can be improved by smart electrification. Utahns can
immediately benefit from newly constructed all-electric homes, particularly with the continued
deployment of renewable energy and smart appliances that reduce pollution, help manage electric loads,
and enhance system-wide affordability. Given the non-monetized benefits of building electrification, it is
important to study the direct economic impacts on consumers to determine if there is an incremental cost
to realizing these benefits. The following sections in this report explore this question.

          Methodology

2.1 Building Prototypes
This report analyzes two residential building types in Utah—single-family homes and low-rise multi-family
buildings—and reflects results across all three major climate zones in the state. Building assumptions and
location characteristics were drawn from existing federal government datasets typically used to perform
energy code modelling for Utah and other states.

Building energy consumption for each building prototype was calculated with data from Pacific Northwest
National Laboratory’s (PNNL) database of Residential Prototype Building Models. 17 To reflect Utah’s
unique amendments to the 2015 IECC new construction building standards, prototypes were provided by
staff at PNNL that directly match these specifications; see PNNL report on cost effectiveness of the Utah
building code for further details on included specifications. 18 Figure 1 below provides a summary of the
building prototypes used in the analysis for this report.

15 “Greenhouse gas emission forecasts for electrification of space heating in residential homes in the United States ,” U.C. Davis
   Western Cooling Efficiency Center, 2021, https://ucdavis.app.box.com/s/dqja4itdlh1wwicyjh6wag5yswwf97tc
16 “Fact Sheet: Biden Administration Combats Super-Pollutants and Bolsters Domestic Manufacturing with New Programs and
   Historic Commitments,” The White House, 2021,
   https://www.whitehouse.gov/briefing-room/statements-releases/2021/09/23/fact-sheet-biden-administration-combats-
   super-pollutants-and-bolsters-domestic-manufacturing-with-new-programs-and-historic-commitments/
17 “Prototype Building Models,” Pacific Northwest National Laboratory (PNNL), Accessed 2021,

   https://www.energycodes.gov/prototype-building-models#Residential
18 “Cost-Effectiveness Analysis of the Residential Provisions of the 2015 IECC for Utah,” Pacific Northwest National Laboratory

   (PNNL), 2016, https://www.energycodes.gov/sites/default/files/2019-09/UtahResidentialCostEffectiveness_2015.pdf

Economics of All-Electric New Construction in Utah                                                                               6
Methodology
Figure 1. Summary of prototype buildings used in this analysis
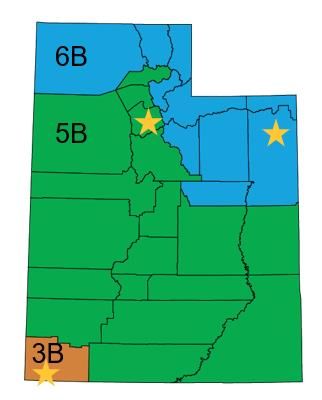
Building simulations based on these prototype models were then performed in the U.S. Department of
Energy’s (DOE) EnergyPlus modelling software with Utah-specific weather considerations. Utah’s
geography spans three climate zones as designated by the American Society of Heating, Refrigerating and
Air-Conditioning Engineers (ASHRAE) for its model standards referenced in energy codes such as the IECC.
The three climate zones and specific weather stations utilized are Climate Zone 3B (St. George Regional
Airport), Climate Zone 5B (Salt Lake City International Airport), and Climate Zone 6B (Vernal Regional
Airport) (see Figure 2). These sites were selected based on weather data availability and records to
conform with TMY3 (Typical Meteorological Year) standards and modelling software needs.
TMY3 Weather Station
Climate Zone 3B St George Regional Airport
ID: 724754
Climate Zone 5B Salt Lake City Int’l Airport
ID: 725720
Climate Zone 6B Vernal Regional Airport
ID: 725705
Figure 2. Map of Utah's ASHRAE climate zones and location of weather stations19
19 “Utah Climate Zone Map,” Building Codes Assistance Project, Accessed 2021, http://bcapcodes.org/wp-
content/uploads/2012/01/cz-map_utah.png
Economics of All-Electric New Construction in Utah 7Methodology
2.1.1 Adjustments to DOE Prototype Building Characteristics, HVAC Modeling and Sizing
This analysis utilizes building envelope performance and most end-use energy loads directly from the
standard EnergyPlus model runs for the building types and Utah climate zones listed above. Some
additional adjustments were made to these models to better reflect Utah’s building stock and new
construction technology options. Plug load energy consumption was decreased by 25% and fan energy
use was decreased by 50% to better align with empirical end use consumption reflected in the Energy
Information Administration (EIA) Residential Energy Consumption Survey (RECS) database. 20
To facilitate modeling of additional heat pump space heating technology options, space heating service
demand was extracted from the EnergyPlus models and post-processed to reflect specified heat pump
performance curves and custom sizing. Non-cold climate heat pumps were sized to cover all space heating
loads in a building at an outside temperature of 20 degrees Fahrenheit, and electric resistance heating
was assumed to provide supplementary backup heat at temperatures below this threshold. Cold climate
heat pumps were sized to provide the full building heating load, with no supplementary backup heat.
2.2 Technology Packages
This analysis evaluates examples of newly constructed all-electric residential building types and compares
these to mixed fuel alternatives in which both electric and gas appliances are installed in the building.
Scenarios with both electricity and gas are described as “mixed fuel” throughout this report.
Four technology packages were included in the analysis and are summarized in Figure 3 below. The
specified efficiencies and equipment selections are the same for both single-family and multi-family
building prototypes, although it is noted that equipment sizing and installation costs vary by prototype.
The four technology packages are:
Mixed Fuel Baseline: Represents a baseline case with both electricity and gas service and
specifies equipment that meets federal minimum efficiency standards.
Ducted All-Electric: Includes all-electric equipment including a heat pump water heater and
ducted air-source heat pump (ASHP). The ASHP provides both space heating and cooling. This
package is only included for single-family homes due to the prevalence of ducted HVAC
currently in these building types.
Ductless All-Electric: Includes all-electric equipment including a heat pump water heater and a
ductless ASHP (a.k.a. “mini-split”). The ASHP provides both space heating and cooling.
Cold Climate (CC) Ductless All-Electric: Includes all-electric equipment including a heat pump
water heater and a ductless cold climate ASHP. The ASHP provides both space heating and
20 “Residential Energy Consumption Survey (RECS),” U.S. Energy Information Administration (EIA), 2015,
https://www.eia.gov/consumption/residential/
Economics of All-Electric New Construction in Utah 8Methodology
cooling. This package is only included as an option in colder climate zones 5B and 6B in Utah as
an alternative to basic ASHP equipment.
All-electric prototypes in climate zone 3B, as well as the Cold Climate Ductless All-Electric prototypes in
Climate zones 5B and 6B, assume no supplemental heat as the heat pumps are sized to meet peak heating
loads. The all-electric prototypes in climate zones 5B and 6B with non-cold climate heat pumps assume
electric resistance backup heat. For ducted ASHPs, the backup heating system is assumed to be resistance
coils installed within the system. For ductless ASHPS in colder climates, supplemental heat is sometimes
provided by electric resistance baseboard heating when non-cold climate heat pumps are installed.
However, this pathway increases costs and was not included in this analysis. Alternatively, the modeling
reflected in this report for the two colder Utah climate zones (5B and 6B) includes cold climate ductless
heat pump scenarios which have improved upfront and operating cost characteristics .
Heat pump technology continues to improve and builders or homeowners may also choose to install more
efficient heat pump equipment than modeled in this analysis, which may have a higher upfront cost, but
further reduce energy bills over the lifetime of the equipment.
Each technology package was evaluated using DOE’s EnergyPlus modeling software for the specified
building prototypes and results were uniquely calculated for each of the three climate zones in Utah. The
Economics of All-Electric New Construction in Utah 9Methodology models calculated energy use on an hourly basis and details were then annualized for representation in this report. Figure 3. Summary of Technology Specifications and Assumed Rated Energy Performance for the Single-Family and Multi-Family Prototypes Modelled for this Report 2.2.1 Cold Climate Air Source Heat Pumps (ccASHPs) Due to recent technology improvements, there is a class of commercially available air source heat pump that can provide efficient space heating, even during extremely cold temperatures. Cold climate air source heat pumps (ccASHPs) are defined as being capable of performing with a Coefficient of Performance (COP) ≥ 1.75 at 5°F21 22 and many available products exceed this requirement 23 . To reflect this technology option, 21 “Cold Climate Air-Source Heat Pump Specification”. Northeast Energy Efficiency Partnerships (NEEP), 2019. https://neep.org/sites/default/files/media-files/cold_climate_air-source_heat_pump_specification-version_3.1_update_.pdf 22 ENERGY STAR Program Requirements for Central Air Conditioner and Heat Pump Equipment”. Department of Energy, 2021. https://www.energystar.gov/sites/default/files/Final%20Draft%20Version%206.0%20ENERGY%20STAR%20CAC - HP%20Specification_0.pdf 23 See NEEP Cold Climate Air Source Heat Pump Product List: https://ashp.neep.org/ Economics of All-Electric New Construction in Utah 10
Methodology

ccASHPs are included in this analysis for the two colder climate zones (5B and 6B). Energy performance
and costs are uniquely indicated for these ccASHP options relative to traditional ASHPs for each of these
climate zones.

According to recent research from the Northwest Energy Efficiency Alliance, a new class of ductless ASHPs
“…are capable of providing comfortable heating for a home when outdoor temperatures are as low as
negative 15°F. These units are well suited for cold climates with little or no need for supplemental or
backup heating.” 24 For context, the coldest outdoor air temperature recorded at the Salt Lake City
International Airport since 1990 is -12°F in 1996 and the temperature has not gone below -6°F since
2000. 25 Additionally, ASHP efficiency and performance are not affected by wind chill and therefore allow
heat pumps to provide reliable space heating amidst challenging winter weather conditions.

The modelling efforts for this research report utilized a conservative approach and did not rely on data
from the best performing ccASHPs available on the market. Accordingly, actual energy costs and system
performance could be better than represented if contractors select the best available cold climate
technologies for installation in Utah homes.

2.2.2 Technology Costs

The installed technology costs in this report reflect the estimated full cost to install a given piece of
equipment in a newly constructed residential building, including primary equipment, complementary
parts (e.g., wiring or piping), labor, and estimates for contractor soft costs and mark-ups. Technology costs
were derived from public sources 26 , 27 , 28 and adjusted to reflect Utah’s labor and material rates29 . More
information on technology costs for each building prototype and equipment package are included in
Section 3.3 of this report. Complete cost details are available in spreadsheet format in the accompanying
Utah BE Study Capital Cost Source Data zip file.

24 “Cold Climate DHP Specification,” Northwest Energy Efficiency Alliance (NEAA), 2019, https://neea.org/our-work/cold-
   climate-dhp-specification
25 “Salt Lake City – Lowest Temperature for Each Year,” Current Results, Accessed 2021,

   https://www.currentresults.com/Yearly-Weather/USA/UT/Salt-Lake-City/extreme-annual-salt-lake-city-low-temperature.php
26 Note: Public sources used to determine labor hours, underlying ancillary equipment needs, and with equipment costs that

   scale with system size. Final equipment costs were scaled by the equipment sizes determined by building energy modeling
27 “Residential Building Electrification in California,“ Energy and Environmental Economics, Inc., AECOM, 2019

   https://www.ethree.com/wp-
   content/uploads/2019/04/E3_Residential_Building_Electrification_in_California_April_2019.pdf
   Capital cost data available at https://www.ethree.com/e3-quantifies-the-consumer-and-emissions-impacts-of-electrifying-
   california-homes/
28 “Codes and Standards Enhancement (CASE) Initiative 2022 California Energy Code: All -Electric Multifamily Compliance

   Pathway,” TRC, 2020. https://title24stakeholders.com/wp-content/uploads/2020/08/SF-Additions-and-Alterations_Final_-
   CASE-Report_Statewide-CASE-Team.pdf
29 Note: Most primary cost data was based in California. Adjustments were made based on BLS data on relative labor and

   material rates. Data source: “Occupational Employment and Wage Statistics,” U.S. Bureau of Labor Statistics, Accessed May
   2020. https://www.bls.gov/oes/current/oessrcma.htm

Economics of All-Electric New Construction in Utah                                                                       11
Methodology

2.3 Avoiding Gas Infrastructure Costs and “Electric Ready” Scenario

2.3.1 Cost Savings by Avoiding Gas Infrastructure

In addition to the appliance-related costs included in this study, there are additional construction costs
for mixed fuel buildings that are important to consider.

Most notable are the costs of installing utility-side gas infrastructure for a mixed fuel property, including
the gas distribution pipeline and related infrastructure to connect a building to the gas system. Given that
electricity is a prerequisite for any new development, the ability to eliminate gas infrastructure in an all-
electric building presents a unique opportunity to cut construction costs while still providing for energy
needs. Examples of gas-related infrastructure that can be eliminated from all-electric developments
include:
     ➢ Gas utility distribution lines, connections, and meters;
     ➢ Gas piping that distributes gas to appliances throughout the property;
     ➢ Certain types of venting and other infrastructure for gas equipment; and,
     ➢ Distributed ductwork which can be eliminated if the property uses ductless air-source heat pumps
         (a.k.a. “mini-splits”) for space heating and cooling needs.

Estimates for running gas piping to each end use within a building were included in the cost estimation
method for this study and are incorporated in the construction cost estimates for each appliance type.
The other three types of costs indicated in the bullets above were not fully reflected in the per-appliance
construction cost estimates in this study, but can result in cost, timing, and design requirements for a
property which can be avoided in an all-electric building. The anticipated financial savings for avoiding gas
will vary by property and utility. However, separate research has analyzed certain avoided gas
infrastructure costs in various parts of the country and can help inform expectations for a future, localized
analysis in a Utah:

       •    Research conducted by Group14 Engineering in Colorado notes that for single-family homes,
            “Natural gas piping and connection for new construction typically costs $5,000 - $8,000 [per
            building]. This includes the Xcel Energy natural gas connection fee.” This study proceeded to use
            an average estimate of $6,500 per home for avoided gas connection and piping costs in its single-
            family home analysis. 30

       •    RMI assumed an “out-of-pocket cost of $2,100 for the gas connection of a new home” across
            seven cities analyzed in a 2020 report on new construction. However, the report noted that “this
            estimate is conservative, as our research shows that the out-of-pocket cost range for a new

30   “Electrification of Commercial and Residential Buildings: An evaluation of the system options, economics, and strategies to
     achieve electrification of buildings,” Group14 Engineering, 2020, https://www.communityenergyinc.com/wp-
     content/uploads/Building-Electrification-Study-Group14-2020-11.09.pdf

Economics of All-Electric New Construction in Utah                                                                                 12
Methodology
customer gas connection per lot is $0 to $15,000 [or more],”31 demonstrating a wide range of
potential financial impacts associated with installing gas utility connections. In some instances, a
portion of the gas line extension costs are socialized and paid for by the broader ratepayer base
of utility customers, thus further complicating full cost impact estimates.
The cost estimates above also do not factor in the interior space requirements and expense of HVAC
ductwork, which can be avoided with an all-electric ductless air-source heat pump system for space
heating and cooling. Estimates of avoided ductwork vary by location and project, but one recent
assessment has suggested a range of $1,900 - $4,000 for ductwork labor and materials for a new 2,000
square foot single-family home. 32 This cost doesn’t reflect the additional interior space considerations and
costs associated with running ductwork throughout an attic, ceilings and walls. Avoiding ductwor k by
utilizing ductless air-source heat pumps also provides the benefit of enhanced energy performance and
lower energy bills, as ductwork results in 20% – 30% energy losses in the typical home as air “is lost due
to leaks, holes, and poorly connected ducts,” according to ENERGY STAR. 33
These findings indicate that developers in Utah and elsewhere can likely save additional construction costs
above and beyond those modeled by this study by building all-electric homes and properties. Developers
should investigate possible savings based on site-specific expenses and design requirements associated
with providing gas infrastructure and appliances in their local market and specific situations.
2.3.2 “Electric Ready” New Construction
Alongside the growing momentum for all-electric residential properties, “Electric Ready” new
construction is gaining traction as a separate but related type of construction. Electric Ready buildings
include installation of the necessary electrical capacity, conduit, and wiring needed to more affordably
transition to electric appliances and install EV charging infrastructure in the future, while still installing gas
services upfront for some energy uses. Electric Ready properties may not have lower upfront construction
costs compared to mixed fuel buildings because of the need to install additional electrical infrastructure,
but they avoid major retrofit costs in the future and are gaining traction as familiarity and confidence in
efficient electric appliances and electric vehicles continue to grow.
Electric readiness bolsters consumer choice by providing future flexibility to homeowners to electrify their
appliances and own an electric vehicle. This improved consumer choice, along with a desire to cut local
air pollution by reducing or eliminating fossil fuel combustion in homes, has elevated Electric Ready new
construction as a priority solution among certain Utah stakeholders. In November 2021, Utah Clean
Energy and the Salt Lake City Building Services Department co-submitted an application to the Utah
Uniform Building Code Commission (UBCC) requesting a code update that would require sing le-family and
31 “The New Economics of Electrifying Buildings,” RMI, 2020b, https://rmi.org/insight/the-new-economics-of-electrifying-
buildings/
32 “How Much Does It Cost to Install Ductwork?,” FIXR, 2021, https://www.fixr.com/costs/ductwork
33 “Duct Sealing,” ENERGY STAR, Accessed 2021, https://www.energystar.gov/campaign/heating_cooling/duct_sealing
Economics of All-Electric New Construction in Utah 13Methodology
low-rise multi-family new construction to be constructed as Electric Ready. 34 This application reflected
upfront cost estimates of $925 and $1,350 for the two residential property types for achieving electric
readiness. In comparison, the cost premium of retrofitting a residential building to Electric Ready
outcomes was estimated to be 416% for a single-family home and 267% for a low-rise multi-family
property. The Electric Ready code application is currently pending consideration by the Utah UBCC and
potentially the Utah State Legislature.
2.4 Energy Utility Rates
Retail utility rates and rate structures from three Utah energy utilities—Dominion Energy, Rocky Mountain
Power, and St. George Utilities—were used to calculate energy bill costs for this analysis. The utility rates
utilized for modelling were based on the incumbent utility for each of the three climate zone locations
referenced in Section 2.1. Hourly building energy consumption outputs from the DOE EnergyPlus model
were used to estimate annual customer utility bills for each building prototype. The following tables
display assumed retail utility rates, reflecting the current energy rates and rate structures of the utility
providers at the time of report publication. Table 1 displays the Dominion Energy Gas Rates for General
Services (applicable to all Utah climate zones). Table 2 displays Rocky Mountain Power Residential
Electricity Rates (used in Utah climate zones 5B/Salt Lake City and 6B/Vernal). Table 3 displays residential
electricity rates for City of St George Utilities (used in Utah climate zone 3B/St. George).
To calculate lifecycle utility costs, a 2%35 inflation rate was assumed and a 0.75%36 Compound Annual
Growth Rate (CAGR) above inflation was incorporated for both gas and electricity rates. For the total
lifecycle costs over a 15-year period, a 7% nominal discount rate was assumed for the net present value
of utility bills because people are assumed to discount the value of future savings.
Table 1. Dominion Energy Utah Gas Rates 37
Dominion Energy Utah - Gas General Service Rate
Apr-Oct Nov-Mar
Energy Charge Tier I (first 450 therms) $0.794154 $0.923379
($/therm)
Tier II (additional therms) $0.666779 $0.7960005
Monthly Meter Charge – Single-Family $6.75/customer
Monthly Meter Charge - Multi-Family $6.75/customer
34 “Electric Ready Homes: A Clean Air Innovation for Utah,” Utah Clean Energy, Accessed 2021,
https://utahcleanenergy.org/electric-ready-homes/
35 The average annual US inflation rate from January 2000 through January 2020 is approximately 2%. Source:
https://www.bls.gov/data/inflation_calculator.htm
36 0.75% Compound Annual Growth Rate is consistent with rate forecasts in the US EIA Annual Energy Outlook:
37 “Dominion Energy Utah Tariff,” Dominion Energy, 2022, https://cdn-dominionenergy-prd-001.azureedge.net/-
/media/pdfs/utah/rates-and-tariffs/utah-
tariff.pdf?la=en&rev=842fde2ab8af46dcaf7766a725816e25&hash=00B378D6ED0B163DE77D9313A0AE9C6A
Economics of All-Electric New Construction in Utah 14Methodology
Table 2. Rocky Mountain Power Residential Electric Rates38
Rocky Mountain Power Residential Service - Electric Service Schedule No. 1
June-Sept Oct-May
Energy Charge Tier I (first 400 kWh) $0.090279 $0.079893
($/kWh)
Tier II (additional kWh) $0.117210 $0.103725
Monthly Meter Charge – Single-Family $10/customer
Monthly Meter Charge - Multi-Family $6/customer
Table 3. City of St George Utilities 39
City of St George Utilities - Residential Electricity Service
Year-Round
Energy Charge Tier I (first 800 kWh) $0.075053
($/kWh)
Tier II (additional kWh) $0.091320
Monthly Meter Charge – Single-Family $18.65/customer
Monthly Meter Charge - Multi-Family $18.65/customer
38 “Rocky Mountain Power – State of Utah Price Summary – In Effect as of January 1, 2022,” Rocky Mountain Power, 2022,
https://www.rockymountainpower.net/content/dam/pcorp/documents/en/rockymountainpower/rates -
regulation/utah/Utah_Price_Summary.pdf
39 “Utility Rates,” City of St. George Utilities, Accessed 202 2, https://www.sgcity.org/utilities/utilityrates
Economics of All-Electric New Construction in Utah 15Results
Results
This portion of the report details the construction costs, energy use, and energy bill results for the
modeled new single-family and low-rise multi-family properties in each of the three primary climate zones
in Utah. These results are meant to help Utah stakeholders understand estimated energy use outcomes
and financial implications of all-electric new construction in Utah relative to mixed fuel properties built
with both electric and gas appliances.
3.1 Building Energy Consumption
Building energy modeling outputs are reported using site energy use40 , with results disaggregated by fuel
type and for each end use technology. Site energy use was evaluated by converting both electricity
consumption and gas consumption to a single common metric: Million British Thermal Units (MMBtu).
Source energy41 modelling was not completed for this analysis due to the changing dynamics of utility-
scale electricity generation and more complicated lifecycle implications of both electricity and gas service.
The results for single-family and low-rise multi-family properties are reflected in Figure 4 and Figure 5
below.
Based on the results of the energy models, all-electric homes consume significantly less site
energy than mixed fuel homes on a per-unit basis. The primary driver of this outcome is the fact
that electric heat pump appliances have much a higher onsite efficiency than their gas
counterparts.
Figure 4 indicates that the ductless heat pump package consumes less site energy than ducted heat pumps,
in part due to avoided fan energy consumption with ductless heat pumps. Avoiding HVAC ductwork has
the additional benefit of eliminating leaks, holes and poorly connected ducts, which result in 20% – 30%
energy losses in the typical home as cited earlier.
Generally, homes in colder climates consume more energy due to increased space heating demands and
the modelling results indicate higher annual site energy use in buildings located in colder Utah climate
zones. Additionally, the efficiency of air-source heat pump systems is impacted by cold weather and as
temperature drops then heating efficiency decreases. When temperatures became very cold, the
modelling assumed that non-cold climate heat pumps would be supplemented by electric resistance space
heating in climate zones 5B and 6B. However, in spite of these performance losses, the all-electric
scenarios still result in lower site energy consumption than mixed fuel buildings that rely on gas for space
heating and water heating.
40 Note: site energy is not intended to be used as a metric of environmental performance in this report; it is intended as a more
direct way to display outputs of the building energy models
41 In this report, site energy refers to energy that is consumed on site at a building. Source energy refers to all of the raw fuels
required to operate the building, incorporating losses with transmission, distributi on, and production. For additional details,
see: https://www.energystar.gov/buildings/benchmark/understand_metrics/source_site_difference
Economics of All-Electric New Construction in Utah 16Results Figure 4. Site Energy Consumption by Climate Zone and Technology Package for the Single- Family Home Prototype. “Electrified Loads” in all-electric buildings reflect the energy loads that are served by gas in the mixed fuel buildings, including space heating, water heating, cooking, and clothes drying. CC Ductless All-Electric represents packages with a cold climate ductless heat pump. Economics of All-Electric New Construction in Utah 17
Results

Figure 5. Site Energy Consumption by Climate Zone and Technology Package for the Multi -
Family Building Prototype (normalized by Dwelling Unit). “Electrified Loads” in all-electric
buildings reflect the energy loads that are served by gas in the mixed fuel buildings, including
space heating, water heating, cooking, and clothes drying. CC Ductless All-Electric represents
packages with a cold climate ductless heat pump.

Economics of All-Electric New Construction in Utah                                           18
Results

3.2 First Year Energy Bills
Energy bill impacts were calculated based on modeled site energy consumption multiplied by local utility
rates. While the site energy consumption is much lower for every all-electric technology package, the
estimated energy bills are closer between the all-electric and mixed fuel development types. However, in
most scenarios across all Utah climate zones, the all-electric building results in lower energy bill costs than
the mixed fuel building (see Figures 6 and 7).

In the warmer region of Climate Zone 3B in Utah (St. George), all of the all-electric technology packages
resulted in lower annual energy bills relative to a property with gas equipment for both single-family
homes and low-rise multi-family buildings. Modelling for Climate Zone 3B uniquely leveraged City of St.
George Utilities rates, which has lower wintertime retail electricity rates than Rocky Mountain Power and
helps further improve the economics of all-electric homes in this region.

For single-family homes in the colder climate zones further north in Utah (Climate Zones 5B and 6B), the
ducted ASHP package has slightly higher first-year energy bills, which is due to the higher costs of space
heating and a partial reliance on backup electric resistance heat on the coldest days. All-electric new
construction using a ductless ASHP package (or a cold climate ductless heat pump in colder regions) is
estimated to result in lower energy bills for all scenarios in all climate zones relative to a mixed fuel single-
family home because these systems are more efficient than their ducted ASHP counterparts.

For low-rise multi-family properties there are similar opportunities to reduce energy bills by pursuing all-
electric new construction. Only ductless ASHPs were modeled for this property types; first-year annual
energy costs for all-electric properties were lower than mixed fuel properties in all of the climate zones
evaluated across every climate zone.

One additional energy bill benefit of all-electric new construction for both single-family and multi-family
properties is the elimination of a fixed monthly gas charge. This is reflected in the modelling and improves
consumer economics in all-electric properties and helps sustain positive bill impacts for owners and
renters responsible for paying the energy bill.

Economics of All-Electric New Construction in Utah                                                            19
Results

Figure 6. First-year Annual Energy Bills by Climate Zone and Technology Package for the Single-
Family Home Prototype. CC Ductless All-Electric represents packages with a cold climate
ductless heat pump.

Table 4. Quantified Results From Figure 6
 First Year Energy Bills                                Gas               Electricity       Total
                                                Fixed     Volumetric Fixed     Volumetric
                                                Charge    Charges    Charge    Charges
                 Mixed Fuel                           $81       $591      $224       $792     $1,688
  CZ 3B (St
                 Ducted All-Electric                   $0         $0      $224     $1,297     $1,520
  George)
                 Ductless All-Electric                 $0         $0      $224     $1,068     $1,292
                 Mixed Fuel                           $81     $1,006      $120       $852     $2,059
 CZ 5B (Salt
                 Ducted All-Electric                   $0         $0      $120     $1,948     $2,068
 Lake City)
                 CC Ductless All-Electric              $0         $0      $120     $1,511     $1,631
                 Mixed Fuel                           $81     $1,040      $120       $788     $2,029
    CZ 6B
                 Ducted All-Electric                   $0         $0      $120     $2,089     $2,209
   (Vernal)
                 CC Ductless All-Electric              $0         $0      $120     $1,614     $1,734

Economics of All-Electric New Construction in Utah                                                  20
You can also read


