Pre Master Plan Solar Energy Production in Palestine - December 2016 - Prepared by : Palestinian Environmental NGOs Network - Friends of Earth ...
←
→
Page content transcription
If your browser does not render page correctly, please read the page content below
Pre Master Plan
       Solar Energy Production in Palestine

                         December 2016

                           Prepared by :
Palestinian Environmental NGOs Network – Friends of Earth Palestine
               Dr. Ayman Rabi      Dr. Isam Ghanem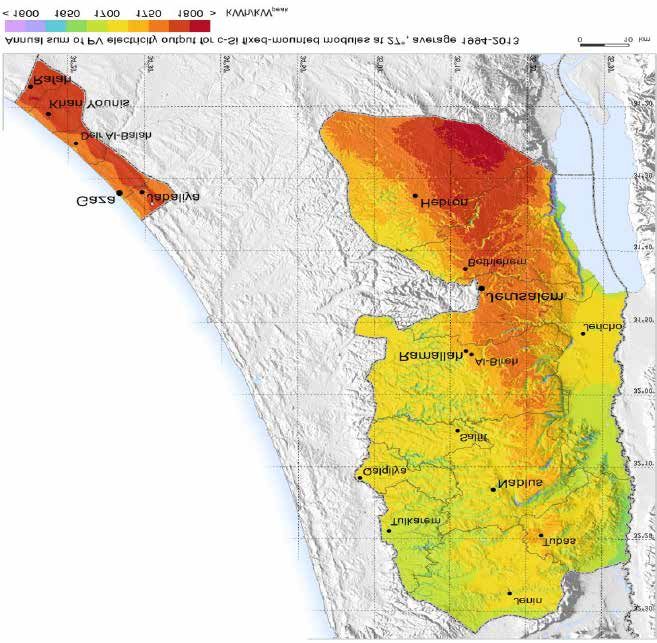
Pre Master Plan
Solar Energy Production in Palestine:
   Opportunities and Challenges

             December 2016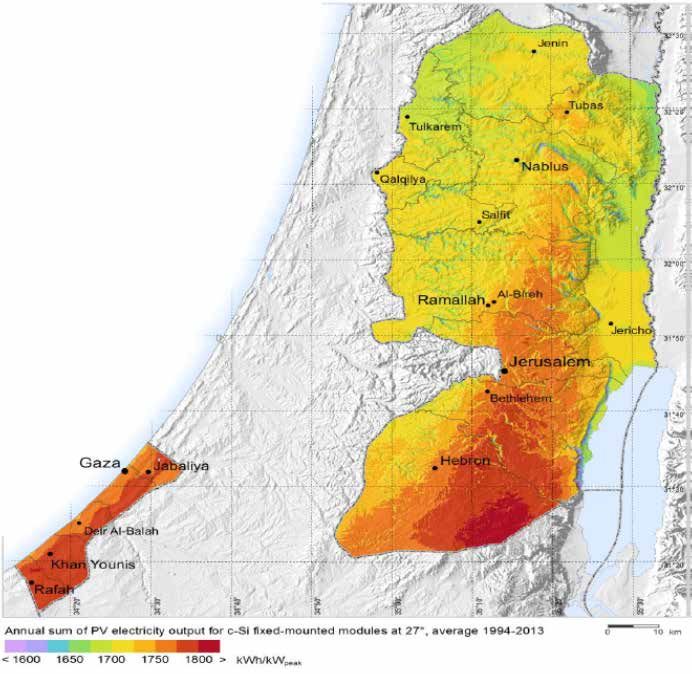
Acknowledgments

PENGON- Friends of earth Palestine would like to thank the Palestinian
Ministry of Energy and Natural Resources for their follow up, revision
and support throughout the study implementation and finalization
process. Special thanks to Eng. Ayman Ismail, and Eng. Basil Yaseen
whose comments were very helpful in clarifying and improving the
outcomes of this study.

Acronyms

DNI		      Direct Normal Irradiation
GHI		      Global Horizontal Irradiation
GTI		      Global Tilted Irradiation (GTI)
GWh		      Giga What per hour
JDECO		    Jerusalem District Electricity Company
HEPCO      Hebron Electric Power Company
SELCO 		   Southern Electric Company
NEDCO      Northern Electricity Distribution Company
GEDCO		    Gaza Electric Company
MWh		      Mega what per hour
KWh		      Kilo What per hour
PCBS		     Palestinian Central Bureau of Statistics
m2		       Meter square

                                        Solar Energy Production in Palestine | 3
Table of Contents

 Acronyms                                                   3

 List of Figures                                            5

 List of Tables                                             6

 1.     Introduction                                        7

 2.     Objectives                                          8

 3.     Methodology                                         9

 4. Situation Analysis                                      10
 4.1. Electricity supply and Demand                         10
 4.2. Electricity Demand                                    14
 4.3. Analysis of solar irradiation in Palestine            20
 4.4. Metrological data analysis                            26
    1. Temperature effect on solar irradiation              26
    2. Humidity and wind effect on solar irradiation        30
    3. Sky Clearance Index                                  32
    4. Potential solar energy production in Palestine       34
 5. Enabling Governance Setup                               37
 5.1. Policies and Strategies                               37
 5.2. Legal and regulatory environment                      38
 6. Challenges and Constraints                              41
 6.1. Political Situation                                   41
 6.2. Electric System Capacity and Efficiency               41
 7.     Economic feasibility of photovoltaic power plants   42
 7.1.   Electricity prices and PV systems in Palestine      42
 7.2.   Investment Cost                                     43
 7.3.   Economic Feasibility Analysis                       43
 8.     Conclusions and Recommendations                     46

4 | Solar Energy Production in Palestine
List of Figures

Figure 1: Main Electricity Supply Stations to West Bank                  11

Figure 2: Electricity Distribution Companies in Palestine                12
Figure 3: Monthly household electricity consumption (a) and
                                                                         13
Electricity consumption by Sector (b)
Figure 4: Amount of Electricity Supply by Governorate                    14

Figure 5: Electricity Peak Demand toward 2025                            15

Figure 6: Electricity Demand BAU Scenario MWH/Yr                         16
Figure 7: Electricity Demand BAU Scenario By Governorate
                                                                         17
MWh/Yr
Figure 8: Electricity Demand CS MWh/Yr                                   17
Figure 9: Electricity Demand CS Scenario MWh/Yr by
                                                                         18
Governorate
Figure 10: Comparing BAU and C Scenarios with saving
                                                                         19
amount
Figure 11: Saved Carbon emission by adopting CS                          19
Figure 12: Average Global Tilted Irradiation of Palestine (1994
                                                                21
- 2013)
Figure 13: Global Tilted Irradiation (GTI) in Palestinian areas          24

Figure 14: Measured Irradiation data in 3 Palestinian areas              25
Figure 15: Irradiation and temperature relation A) Hilly areas
                                                                         28
in the West Bank (Level A)
Figure 16: Clearness index (%) in Palestinian areas                      33
Figure 17: Annual PV electricity output from an open-space
                                                             35
fixed PV system] with a nominal peak power of 1 kW [kWh/kWp]

                                            Solar Energy Production in Palestine | 5
List of Tables

 Table 1: Sources of electricity in Palestine based on yearly
                                                                   10
 consumption (PCBS 2014)
 Table 2: Hebron basic solar parameters                            22

 Table 3: Jericho basic solar parameters                           22

 Table 4: Nablus basic solar parameters                            23

 Table 5: Monthly averages of maximum temperatures                 27
 Table 6: Basic parameters of selective sites in the three areas
                                                                   30
 in Palestine
 Table 7: Daily shining hours in Palestinian areas                 33
 Table. 8: Annual average of electricity yield for fixed PV
                                                                   36
 system at optimum angle
 Table 9: JDECO electricity dynamic tariff                         42

 Table 10: Payback period of PV Systems                            44
 Table 11: The Net Present Value (NPV) assuming that the land
                                                              45
 required for the PV’s is purchased at cost (10000$/dunum)
 Table 12: The Net Present Value (NPV) assuming that the land
                                                              45
 required for the PV’s is rented at cost 500$/dunum/year

6 | Solar Energy Production in Palestine
1.     Introduction

Energy problem in Palestine is among many other problems that affect
social and economic conditions of the Palestinian People. The fact that
most of the energy is imported with relatively higher prices places more
economic burdens on the poor and marginal people. The current poverty
rate in Palestine is estimated at nearly 26% and the rate of absolute
poverty is nearly 13% (PCBS, 2012). This indicates that nearly 1.1 million
poor in Palestine with monthly income under the defined poverty line.
It was also reported that, on average, nearly 34 % of income is spent on
food and nearly 8.5% spent on energy (electricity and liquid gas). This
reflects the vulnerability of the society especially the poor and marginal
segments and limits their ability to obtain the energy they need for their
daily use.
Furthermore, the fact that the electricity used in the West Bank and
Gaza Strip is totally controlled by Israel either directly or indirectly
places additional complexity and increase the energy insecurity of
the Palestinian communities at large. The only power generation is
currently in Gaza using fossil fuel. Palestinians used to generate nearly
100 megawatt of electricity from the Gaza power plant compared to
their annual needs of 242 megawatt. The locally produced quantity has
considerably decreased due to the repeated bombarding of the electric
power station by Israel while the produced portion is being dependent
on Israeli controls of fuel supply to Gaza as well. The fuel quantities
allowed to enter Gaza are sufficient to produce nearly 65 megawatt
of energy which is equivalent to only 20% of the electricity demand in
Gaza. The situation in the West Bank is relatively better but there are still
some 135 communities with a total population of nearly 216,000 people
nearly 13% of the West Bank population) which either lack reliable
power supply or have no power supply at all.
The current pre master plan will try to highlight the main challenges
facing the power generation in Palestine and also will shed light on
the potential energy sources available in Palestine especially the solar
Energy.

                                              Solar Energy Production in Palestine | 7
2.        Objectives

The main objective of this pre master plan is to define the main
alternatives and potential of solar energy production in Palestine and
to propose the best locations for the production of solar energy across
Palestinian Areas.

8 | Solar Energy Production in Palestine

3.     Methodology

The current premaster plan has been developed by adopting the
following methodology:
1. Reviewing existing published material on renewable energy and
   electricity consumption and generation.
2. Reviewing the National strategies, laws and policies, Solar atlas
   related to renewable energy and electricity in Palestine.
3. Meeting with relevant stakeholders, mainly Palestinian Energy
   Authority and discuss the main issues and needs as well as gaps.
4. Calculating electricity demand based on the electricity supply rate
   per capita of the year 2013 and considering the population number
   and growth rate for each governorate as reported by Palestinian
   Central Bureau of Statistics.
5. Considering two scenarios for projecting demand. The first is BAU to
   continue the use of electricity at the same supply level of 2013.while
   the second scenario is the conservation scenario which assumes
   that a conservation of 5% is applied per year.
6. Organizing a workshop to discuss the draft premaster plan with
   relevant stakeholders and modify the draft based on inputs and
   comments from the stakeholders.

                                           Solar Energy Production in Palestine | 9
4. Situation Analysis
4.1. Electricity supply and Demand
Total electrical energy consumption in Palestine was reported by PCBS
2014 to be 5,301GWh. This quantity is almost entirely imported from
outside sources but mainly from Israel Electric Corporation (IEC) as
shown in Table 1.
Table 1: Sources of electricity in Palestine based on yearly consumption (PCBS
2014)
Percentage of
N Electricity source Quantity (GWh)
total supply
1 Israel (IEC) 4702 88.7%
2 Gaza Electricity Company 392.3 7.4%
3 Egypt 121.9 2.3%
4 Jordan 84.8 1.6%
Total 5301 100%
The West Bank is mainly supplied by three 161/ 33 KV substations: one
in the south close to Hebron, a second in the middle part o West Bank
near Salfeet town close to Nablus, and a third in the northern part of
Jerusalem, Figure 1.
10 | Solar Energy Production in PalestineFigure 1: Main Electricity Supply Stations to West Bank
The supplied electricity from different sources is managed by local
Palestinian companies, municipalities, committees, cooperatives and
associations. The largest of these are the Jerusalem District Electricity
Company (JDECO), the utility serving the southern area around Hebron
- the Hebron Electric Power Company (HEPCO), the newly formed utility
serving the rest of the southern area - the Southern Electric Company
(SELCO), and the utility that is being established to serve the northern
area – the Northern Electricity Distribution Company (NEDCO) - Tubas
Electricity company and the Gaza Electric Company (GEDCO), figure 2.
The electricity supplied to the centre of the West Bank is managed largely
by JDECO via 33kV and 11kV distribution lines at several connection
Solar Energy Production in Palestine | 11points with the IEC including, Ramallah, Jericho, Bethlehem and the
eastern part of Jerusalem.
Figure 2: Electricity Distribution Companies in Palestine
12 | Solar Energy Production in PalestineAvailable power capacity doesn’t meet the demand in all Palestinian
areas. Lack of electricity, in addition to high costs of imported electric
power are the main factors affecting low Palestinian consumption of
electric power. According to PCBS, the monthly average household
electricity consumption (based on consumption during January 2015)
varies from 265 KWh in Gaza to 442 KWh in the Middle part of West
Bank as shown in figure 2 (a). Moreover, the main electric consumption
goes to domestic sector followed by commercial sector as shown in
Figure 2 (b).
(a) (b)
Figure 3: Monthly household electricity consumption (a) and Electricity
consumption by Sector (b)
In the mean time there is big variation in electric supply across
Palestinian governorates in the West Bank and Gaza with the largest
supply registered in Hebron followed by Gaza City according to 2013
statistics as reported by Juaidi et.al (2016) as shown in Figure 4.
Solar Energy Production in Palestine | 13Figure 4: Amount of Electricity Supply by Governorate This huge variation is largely due to population number from one part and also the commercial and light industrial activity presence on the other part. As population grows and development needs increase, it is also expected that the need will increase as well. The next section will address the demand for electricity in various parts of West Bank and Gaza. 4.2. Electricity Demand Electricity demand in Palestinian areas was doubled in the last decade. In 2005 Palestinian areas consumed 2.5GWh (World Bank, 2007). In 2008 the average electricity consumption was about 282.2 megawatt; currently it has reached a peak demand of 400 megawatt and is expected to increase to about 495 megawatt in 2020 (ENPI, 2010). The peak demand usually occurs during winter when people use electricity for indoor heating. Peak demand is of a particular significance especially when there is a lack of fuel for use in indoor heating instead of electricity. Summer involves another peak demand period manifested in the need for air conditioning leading to additional electricity consumption. 14 | Solar Energy Production in Palestine
However, the summer peak is lower than the winter peak, because fewer
households have access to air conditioning equipments than those with
access to the relatively affordable electric indoor heaters. According to
the Palestinian Energy Authority, it is expected that peak demand on
electricity will double toward the year 2025 as shown in Figure 5.

              Figure 5: Electricity Peak Demand toward 2025

In addition to the expected growth in peak demand, it is also projected
that demand for electricity will increase in the coming decade due to
population growth, urban expansion and development of commercial
and industrial activities. However, for the purpose of this pre master
plan, the main factors that will be considered for calculating electricity
demand will be population growth and the per capita electricity supply
based on available supply figures for 2013. In addition, two scenarios for
demand will be considered as follows:
1. Business as usual scenario (BAUS) is that demand will grow as
    population grows at the same level of supply as per 2013 per capita
    supply level and that same efficiency level exist.
2. Conservation Scenario (CS) is that demand will grow with population
    but more conservation measures are considered in line with the

                                           Solar Energy Production in Palestine | 15
energy efficiency action plan proposed by the Palestinian Energy
Authority. In this scenario it will be assumed that electricity annual
saving will be in the magnitude of 5%.
Based on the above two scenarios electricity demand during the coming
decade up to 2030 is expected to be as follows:
1. BAU Scenario:
It is projected that electricity demand will reach 4372 GWh/year in the
West Bank while it will reach 3131 GWh/year in Gaza toward 2030 as
shown in Figure 6.
Figure 6: Electricity Demand BAU Scenario MWH/Yr
In addition, demand for each governorate varies according to population
number. Based on 2013 electricity supply rate, it was realized that
per capita electricity supply was 1045 KWh/Yr for all governorates.
Considering this rate and given population growth in each governorate
according to PCBS population figures and growth rate, it was realized
that the largest demand is in Hebron Governorate and will reach 1184.3
GWh/Yr followed by Gaza with 1033.7 GWh/Yr as shown in Figure 7.
16 | Solar Energy Production in PalestineFigure 7: Electricity Demand BAU Scenario By Governorate MWh/Yr
2. Conservation Scenario
It is projected that electricity demand will reach 4153 GWh/year in the
West Bank while it will reach 2974.7 GWh/year in Gaza toward 2030 as
shown in Figure 8.
Figure 8: Electricity Demand CS MWh/Yr
Solar Energy Production in Palestine | 17Considering the same assumptions related to BAU scenario in relation
to population growth and electricity supply rate and applying the 5%
conservation target per year it was realized that the highest demand is
still in Hebron with total of 1125 GWh/Yr followed by Gaza with 0.9821
GWh/yr as shown in figure 9.
Figure 9: Electricity Demand CS Scenario MWh/Yr by Governorate
It is clear that the conservation scenario is more preferable in a sense
that it will rationalize electricity use and will save nearly 615 M$ over
the planning period up to 2030. In the mean time it will reduce carbon
emission by 3.25 M ton as shown in Figures 9 and 10.
18 | Solar Energy Production in PalestineFigure 10: Comparing BAU and C Scenarios with saving amount
Figure 11: Saved Carbon emission by adopting CS
In the light of projected growth in demand for electricity, the heavy
reliance on external sources (especially Israel) for the supply of
electricity, the high costs of electricity and environmental impacts
associated with using traditional energy sources to generate electricity,
efforts now are centred in finding alternative sources that can supply
adequate and sustainable energy, taking into account cost-effective and
environmental concern mainly climate change and reduction of emission.
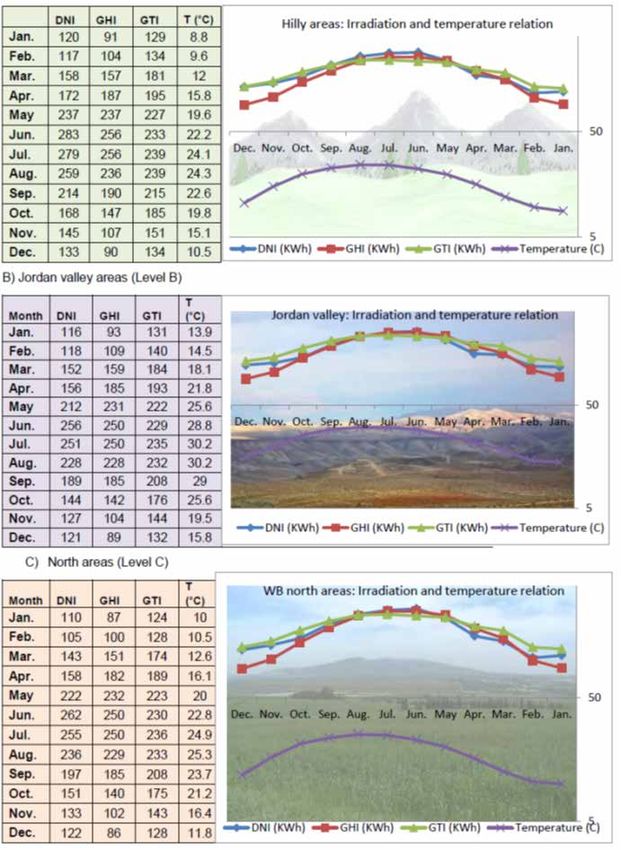
Solar Energy Production in Palestine | 19Renewable energy projects are of special interest in Palestine and highly encouraged by Palestinian Energy Authority through the Solar Initiative which anticipates the generation of nearly 130 GWh from renewable resources by the year 2020 to help meet the growing electricity demand in Palestine and increase Palestinian energy security. The following sections will address the solar energy potential and characteristics in West Bank and Gaza. 4.3. Analysis of solar irradiation in Palestine General irradiation map of Palestine, figure 12, shows that Palestinian areas can be classified into three irradiation areas as follows: A) Areas with highest irradiation: areas coloured in red with radiation above 2300kwh/m2 are covering middle and south areas. For basic purposes those are hilly and coastal areas in Ramallah, Jerusalem, Bethlehem, Hebron and all Gaza strip governorates. B) Areas with medium irradiation: areas coloured in brown with radiation between 2200-2300kwh/m2 that are covering mainly Jordan valley and northern hilly areas in Palestine. Those areas are Jericho and southern part of the Jordan valley, in addition to Tubas governorate and some other areas in the northern middle part of the West Bank. 20 | Solar Energy Production in Palestine
Figure 12: Average Global Tilted Irradiation of Palestine (1994 - 2013)

C) Area with low irradiation: areas coloured in yellow with radiation
   less than 2200kwh/m2 are covering the most areas of West Bank
   north. It includes Tulkarem, Qalqilia and Jenin and other rural areas
   in the western side of the West Bank.
In average Global Horizontal Irradiation (GHI) is higher than 1900 kWh/
m2 /year and Direct Normal Irradiation (DNI) is higher than 2000 kWh/
m2/ year, what indicates good conditions for development of solar
industry. Long-term averages of basic solar parameters for the three
irradiation levels of Palestinian areas are presented in tables 3, 4 and
5 sowing Direct Normal Irradiation (DNI), Global Horizontal Irradiation
(GHI) and Global Tilted Irradiation (GTI). Data in these tables were
collected based on the Atlas of Solar Resources of the State of Palestine
2014. Data shows the monthly and yearly long-term averages of DNI,
GHI, and GTI received by plane at optimum angle of 27°.

                                              Solar Energy Production in Palestine | 21
Table 2: Hebron basic solar parameters
Direct Normal Irradia- Global Tilted Irradiation
GHI (kWh/m2)
Month tion (kWh/m2) (kWh/m2)
Min Max Average Min Max Average Min Max Average
January 86 151 120 76 104 91 104 152 129
February 91 153 117 86 121 104 110 159 134
March 109 208 158 127 183 157 144 216 181
April 120 229 172 162 215 187 167 225 195
May 197 269 237 214 254 237 204 242 227
June 244 302 283 244 263 256 224 239 233
July 246 298 279 248 263 256 231 244 239
August 234 280 259 231 240 236 233 243 239
September 173 242 214 176 200 190 197 228 215
October 135 209 168 132 161 147 163 205 185
November 91 184 145 78 124 107 106 179 151
December 104 163 133 79 102 90 114 156 134
Year 2285 2058 2262
Table 3: Jericho basic solar parameters
Direct Normal Irradia- Global Tilted Irradiation
GHI (kWh/m2)
Month tion (kWh/m2) (kWh/m2)
Min Max Average Min Max Average Min Max Average
January 95 142 116 85 104 93 117 150 131
February 97 145 118 98 120 109 125 158 140
March 120 184 152 138 178 159 158 209 184
April 124 200 156 168 207 185 174 217 193
May 170 241 212 206 246 231 198 236 222
June 220 274 256 239 257 250 221 235 229
July 217 272 251 241 256 250 228 240 235
August 191 255 228 219 234 228 222 238 232
September 151 218 189 173 193 185 192 219 208
October 118 191 144 132 153 142 162 196 176
November 83 149 127 78 116 104 104 164 144
December 100 150 121 79 98 89 113 149 132
Year 2070 2025 2226
22 | Solar Energy Production in PalestineTable 4: Nablus basic solar parameters
Direct Normal Irradia- Global Tilted Irradiation
GHI (kWh/m2)
Month tion (kWh/m2) (kWh/m2)
Min Max Average Min Max Average Min Max Average
January 77 134 110 76 97 87 102 141 124
February 80 144 105 81 119 100 102 156 128
March 105 189 143 126 178 151 142 210 174
April 111 209 158 156 205 182 161 215 189
May 180 256 222 205 248 232 197 239 223
June 230 283 262 240 258 250 221 237 230
July 228 274 255 239 257 250 225 242 236
August 206 262 236 220 235 229 223 240 233
September 166 222 197 174 193 185 195 220 208
October 129 206 151 129 154 140 158 199 175
November 79 175 133 73 120 102 97 174 143
December 94 157 122 77 98 86 110 150 128
Year 2094 1994 2191
It can be noticed from the three tables that they have very similar patterns
in terms of GHI values. In addition, differences between sites can be
expressed by relative standard deviation, which compares monthly and
yearly values. Small variability of values is caused by similar geographical
characteristics, and this indicates that all sites will experience similar PV
power performance. But, it’s good to note that uncertainty of mentioned
data can be estimated from 4-9% for monthly GHI, 5-10% for GTI, and
10 -15% for DNI according to the Atlas of Solar Resources of the State
of Palestine. Moreover, satellite based data can’t replace long-term
metrological data. The last is very essential for assessment, engineering
design and hence for investment costs.
The other aspect of mentioned data is the type of solar technology
used. In case of investing in solar concentrators (CPV and CSP) Direct
Normal Irradiation (DNI) is the relevant solar parameter. If investing in
PV systems, Global Tilted Irradiation (GTI), i.e. sum of direct and diffuse
solar radiation falling at the surface area is the relevant and most
important solar parameter for potential evaluation.
Solar Energy Production in Palestine | 23Since the most common investments in solar energy are PV power
plants, Global Tilted Irradiation (GTI) is therefore the most important
parameter to be considered, figure 13. shows average monthly values of
potential energy production during the year.
Figure 13: Global Tilted Irradiation (GTI) in Palestinian areas
According to a comparative study of the existing solar irradiation data
sources given by PENRA, the average solar irradiation in Palestine is
given 5.4KWh/m2.day. In some areas the maximum irradiation reaches
8.5KWh/m2.day in June while the minimum goes down in December
and reaches 2.8KWh/m2.day.
Moreover, the 15-minute time series measured solar irradiance data
for selected sites representing those three areas are available for the
period from May 2008 to September 2009 for Jericho area and from
2012 to 2014 for other areas (PA central meteorological department
in Ramallah-2015 and Jericho metrological station). Based on 15-min.
measured irradiation figure 14 is formed. It shows a maximum and a
minimum solar radiation for those areas as follows:
1. Area with irradiation level A: max. of 680W/m2 and a min. of 350W/
m2.
24 | Solar Energy Production in Palestine2. Area with irradiation level B: max. of 1000W/m2 and a min. of 550W/
m2.
3. Area with irradiation level C: max. of 1250W/m2 and a min. of 450W/
m2.
A) drawing is based
on measured data
2014 from cen-
tral metrological
department (high
irradiation levels
area)
B) drawing is based
on data from
Jericho metrolog-
ical station (2008,
2009)
(medium irradia-
tion level area)
C) drawing is based
on measured data
2014 from cen-
tral metrological
department (low
irradiation levels
area)
Figure 14: Measured Irradiation data in 3 Palestinian areas
Solar Energy Production in Palestine | 2515-min. measured irradiation data in the above figures confirms that Palestinian areas have high potential solar energy with a rate of 800W/ m2 throughout the year. However, more meteorological data is needed to be able to better understand this potential. The following section will shed light on the main meteorological parameters that affect irradiation in Palestine. 4.4. Metrological data analysis A general overview of existing and available metrological data such as humidity, ambient air temperatures and wind for 1-5 years can be summarized as follows: 1. Temperature effect on solar irradiation Knowledge of air temperature values is important, as it determines the working environment of the solar system. In thermal solar applications air temperature is one of the important inputs for calculations and design. Thermal solar technologies like solar heaters benefit more of high temperatures, while photovoltaic technology is sensitive to air temperatures above 40°C. The PV technology works the most effectively at mild and cooler air temperature and stable sunny weather, the extremely high air temperature and intermittent weather pattern reduces slightly the power output. Collected irradiation and temperature data are analyzed. For the main solar photovoltaic technology table 6 shows the maximum temperatures. Maximum air temperature is calculated by PENRA Solar Atlas as average of maximum values of temperature during each day (assuming full diurnal cycle - 24 hours) of the given month. Monthly averages of maximum daily values show their typical daily amplitude in each month. 26 | Solar Energy Production in Palestine
Table 5: Monthly averages of maximum temperatures
Area     Jan.   Feb. Mar.     Apr.   May    Jun.    Jul. Aug.    Sep.   Oct.   Nov.   Dec.
Hilly
         14     15.3   18.7   23.8   28.1   30.7   32.5   32.5   30.6   27.1   21.3    16
area
Jordan
         18.2   19.2   23.5   28.3   32.7   35     36.3   36.3   35     31.8   24.7   20.3
valley
WB
         14.8   15.7   18.7   23.3   27.8   30.6   32.5   32.9   31.2   28     22.2   16.8
North

Looking at table 6 in Palestinian areas, we can conclude;
1. None of the areas has a maximum temperature over 40°C on monthly
   average base, so all solar technologies work well in Palestine.
2. The hottest months in the Palestinian territory are July and August.
   The temperature in summer reaches up to 35°C.
3. Solar photovoltaic power plants have the maximum use of “available”
   solar irradiation during January, February, March, November
   and December. Good use of solar irradiation also can be made in
   April, May and October. During the other four months of the year,
   particularly in July and August power plants are less efficient due
   to high temperatures. Even though, photovoltaic power plants have
   the maximum power output during summer months due to high
   “available” irradiation crossing the atmosphere.
The influence of monthly averages of air temperature on solar
irradiation is analyzed in figure 6. Temperature data is given for the air
temperature on 2m height that is suitable for solar energy applications.
Temperature data from PENRA is compared with long-term measured
data from 1975-2005 that were mentioned on rate base in PCBS Report
2005. Comparison shows uncertainty in the range of 5% only as shown
in figure 15.

                                                    Solar Energy Production in Palestine | 27
Figure 15: Irradiation and temperature relation A) Hilly areas in the West Bank
(Level A)
28 | Solar Energy Production in PalestineAnalyzing the effect of monthly temperature averages on solar irradiation
in Palestinian areas, the following can be noticed:
1. 1. Generally the average temperature all over the year is
moderateand all Palestinian areas are suitable for solar energy
investments.
2. Solar energy production can be doubled between summer and
winter. Increased energy in summer is a good economic indicator,
while from the other hand it says that other energy sources should
be used in winter. In such case load management is a very essential
step for maximizing the benefits of solar investments. Acuteness of
this case can be noticed for PV stand-alone systems compared with
grid connected systems.
3. Generally the irradiation indicators have the same tendency as
temperature indicator. Only Global Horizontal Irradiation (GHI) has
more attenuation in winter season when temperature decreases.
Photovoltaic solar energy output has accordingly more attenuation
in winter. For standalone photovoltaic systems an alternative source
of energy can be used in winter. For grid-connected PV systems, the
grid compensates the lack of PV energy production in winter.
4. DNI has a stable tendency to increase from January to August, the
only declination can be noticed in March in northern as well as
in Jordan valley areas. This should be considered only when solar
systems are using tracking technology.
5. In Jordan valley area air temperature raises over 40°C in the mid-
day hours during summer months; this decreases the performance
indicator of the power plant. Monocrystalline panels have better high
temperature performance. The use of monocrystalline panels can
partially respond to high temperatures in Jericho area. Performance
indicator of the PV plant in the other months of the year can be near
the standard conditions.
6. Assessing the effect of temperature on PV-plant it can be concluded
that the maximum power point (MPP) attenuates in a maximum
of 15% in a form of voltage drop on the mid-day time only when
temperature reaches its maximum values particularly in summer.
Solar Energy Production in Palestine | 29In the early hours of summer days as well as in late hours MPP is
minimally affected. The last minimal effect of temperature is correct
too for winter, spring and autumn seasons. Air should be allowed to
circulate behind the back of each PV-module, so the temperature
doesn’t rise. This is essential procedure to conserve the electrical
output of the modules.
2. Humidity and wind effect on solar irradiation
Basic parameters (relative humidity, evaporation and wind speeds) in
selected Palestinian sites are shown below in tables 6. Tables show that
Jericho has a lowest humidity in Palestine, but still a humid area.
Particles of water vapour are highly concentrated in the lower layers
of the coastal areas in Gaza strip and in semi-coastal atmosphere of
almost all West Bank areas. In the same time the concentration of
vapour had no permanent character, it changes by time and air spot.
Main inhabitant Palestinian areas in the West Bank are 50km only from
the Mediterranean Sea, in the same time Dead Sea south to Jericho is
a big water surface increasing the humidity. Wind directions limit the
concentration of vapours in the atmosphere. In Jericho as a lowest area
many vapours stay in the atmosphere due to the fact that low winds are
circulating in the same air of the Jordan Valley basin. Table 7 presents
the basic parameters on humidity and evaporation in three selected
stations (Jericho, Hebron and Nablus).
Table 6: Basic parameters of selective sites in the three areas in Palestine
a- Hebron site representing hilly areas (irradiation level A)
Month Jan Feb Mar Apr May Jun Jul Aug Sep Oct Nov Dec
Relative humid- 76.5 75.6 71 62.3 59.9 64.3 66.2 68.9 69 67.4 64.4 71.3
ity (%)
Rate of wind 13.8 13.6 10.8 13.5 12 11.6 12 11.7 12.1 11.3 11.5 11.6
speed, km/h
Evaporation, 2046.9 (mm) among the year
30 | Solar Energy Production in Palestineb- Jericho site representing areas with irradiation level B
Month Jan Feb Mar Apr May Jun Jul Aug Sep Oct Nov Dec
Relative humid- 53.9 54.0 46.8 40.8 38.8 40.3 43.5 45.5 44.1 43.8 45.2 48.9
ity (%)
Evaporation, 58 67 156 217 259 286 309 282 233 148 102 76
mm
Rate of wind 7.6 5.6 6.5 8.2 8.7 9.1 8.8 9.1 7.5 4.8 4.3 5.1
speed, km/h
c- Nablus site representing areas with irradiation level C
Month Jan Feb Mar Apr May Jun Jul Aug Sep Oct Nov Dec
Relative humid- 76.3 76.7 73 65.4 62.3 66 67.8 69.1 67.5 63.5 61.3 69.8
ity (%)
Rate of wind 8.2 8.1 8.1 9.5 9.4 10 10.6 10.2 8.9 8.5 7.1 7.1
speed, km/h
Evaporation, 1991.3 (mm) among the year
Particles of water vapour are invisible, and absorption of solar radiation
occurs in the invisible infrared region of the solar spectrum.
The rate of wind speed in Jericho is 7.1km/h, in table 4.1 above the
monthly rates are given. Winds carry light solid particles from the sandy
peach in the south as well as from dry fields in areas around the university
site to the atmosphere. Mixing with air the solid particles become as a
fixed component of the atmosphere “aerosols”. Diffuse of radiation by
aerosols occurs in the visible region in addition to ultraviolet region of
the solar spectrum. Under high aerosols concentrations the normal blue
colour of the sky changes into white and in some cases in Jericho the sky
has a colour closer to yellow when southern winds and air temperatures
are too high in summer. Atmosphere in other middle Palestinian areas
are affected too with southern winds when dust becomes a clear
atmosphere component for several days. Lowest atmosphere layers
and accordingly low-laying areas have a maximum concentration of
aerosols, while areas with heights above 700m have the lowest aerosols
concentration. Western winds from the side of Mediterranean Sea are
considered clean compared to eastern and southern winds from deserts.
Solar Energy Production in Palestine | 31Diffuse radiation is intensive under high concentrated aerosols. Radiation attenuates by aerosols depending on the Aerosol Optical Depth (AOD). There are no measurements in Palestine for the AOD. No publication or report shows this indicator. It can be only estimated together with other factors in the area increasing the diffuse radiation such as water vapour, industrial dust, pollution caused by burning of agricultural waste and any other air polluting factor. Depending on long-term measured irradiation data gives more accurate results, including the effect of aerosols concentration in the atmosphere. During most of the days winds in Palestine are classified as low winds. Low winds from the other hand can have a positive effect on PV systems performance as it plays an important role in cooling the modules. But the direction of winds is important too for solar energy, as some wind directions in summer time bring dust also to the modules from the surrounding deserts and accordingly increase the cost of O&M. 3. Sky Clearance Index Formation of clouds is a result of different types of air movements. The combination of these processes triggers strong cloud dynamics. Therefore clouds are primary attenuation factor of solar radiation, which has direct effect on solar energy production. Accordingly power plants aren’t able to generate energy from sunrise to sunset. Clearance of the sky and cloudy hours are essential factors in power generation calculations. For some Palestinian areas daily shining hours (clouds free) were measured by meteorological stations. Based on the last “Climatic Report for Palestinian areas” issued by Palestinian Central Bureau of Statistics (PCBS) 2009 table 8 is formed. It shows the daily rates of measured shining hours among each month. 32 | Solar Energy Production in Palestine
Table 7: Daily shining hours in Palestinian areas
Month           Jan    Feb    Mar     Apr   May    Jun     Jul    Aug    Sep   Oct    Nov   Dec

Shining hours
(h) in Jordan    5.8    6.8       8   9.4   11.2   11.9    11.9   10.9   9.8    7.8   7.5    5.7
valley areas
Shining hours
(h) in West
                  6      7        8   9.5   11.5   12.3    12.5   11.5   9.9    8.1   7.8    5.3
Bank middle
areas
Shining hours
(h) in West
                 5.4   6.1    8       9.1   11.2   11.4    11.5   11.5   9.2   7.6    7.2   5.5
Bank South-
ern areas

        Annual rate of shining hours at which PV systems work at full capacity (h)           5.7

Based on data in table 8, the annual rate of daily shining hours is 8.64h/
day in the southern part of the West Bank, 8.9h/day in Jordan river area
and 9.1h/day in the middle West Bank areas, while the annual rate of
shining hours in Palestine at which PV systems work at full capacity is
5.7 h. Based on measured shining hours data, in addition to Palestine
monthly rate of potential solar hours (from sunrise to sunset calculated
on 15th of each month) a clearance index if formed in figure 16.

                Figure 16: Clearness index (%) in Palestinian areas
                                                          Solar Energy Production in Palestine | 33
The clearness index in figure 16 indicates that Palestinian areas in general has a clear sky conditions most of the year. The maximum values of the clearness index are obtained during the period from May to September with maximum shining hours. This means that the highest utilization of solar power is obtained during 5 months (May-Sep.), in the same time a high solar power can be produced also in March, April, and October. Only 4 months of the year can be characterized with low solar power (January, February, November and December). In addition to clouds, high aerosols concentration in the atmosphere are considered in this index. Clearance index serves also as a form that shows the deviation of theoretical solar resource data of actual during power generation processes. As more meteorological data can be obtained from the site, where the PV power plant is to be located, the power generation analysis can be more accurate. Figure 16 shows low deviation during summer, and so a more stable process of power generation. This also confirms the previous conclusions in regard of load management in winter conditions and the advantages of grid-connected PV power systems. 4. Potential solar energy production in Palestine Main Palestinian cities and urbanized areas are interconnected by relatively dense road network. Good accessibility is a precondition for efficient energy network based on exploitation of solar resource. From the point of view of natural geographic conditions, PV installations can be advised to be optimally located on slightly inclined terrain oriented to the South, in territory with low natural pollution sources (e.g. sand, bare land), that can be available in both eastern and western parts of the West Bank, and in the eastern side of Gaza strip. An optimal location of PV systems can be advised in area that are not too much windy or on the hills where winds have a positive effect on performance of the systems. Locations such as the western part of the West Bank winds have a cooling effect on PV modules. However, in Gaza strip where wind speed is higher, as well as in the West Bank eastern areas where winds can bring dust or pollution from urbanized, deserts 34 | Solar Energy Production in Palestine
and agricultural areas is not preferable due to the fact that winds in these
regions has a negative effect by increasing dirt on surface of PV modules
which reduces efficiency and increases Operation and maintenance cost.
Figure 17 shows the specific PV electricity output per year from a typical
open-space PV system with a nominal peak power of 1 kWp system,
i.e. the values are in kWh/kWp. Calculating PV output for 1 kWp of
installed power makes it possible to scale the estimate of PV power
production plant of any size. The power production strongly depends on
geographical location of the power plant.

Figure 17: Annual PV electricity output from an open-space fixed PV system]
              with a nominal peak power of 1 kW [kWh/kWp]
                                             Source: Solar Atlas of the State of Palestine

                                            Solar Energy Production in Palestine | 35
Potential electrical production and the performance ratio of PV power
plants considering climatic conditions for sites in different irradiation
level areas is shown in table 9. In Palestine, the average values of specific
PV power production from a reference system, described in table, vary
between 1700 and 1765 kWh/kWp for the selected three areas. A
maximum value of energy that can be produced in Gaza and very south
of West Bank is higher than 1800 kWh/kWp.
Tab. 8: Annual average of electricity yield for fixed PV system at optimum angle
Palestinian areas with different irradiation levels
Level A Level B Level C
PV electricity yield 1765 1715 1703
for fixed-mounted
modules at optimum
angle
kWh/KWp kWh/KWp kWh/KWp
Optimum angle 27° 27° 27°
System perfor- 78.1% 76.5% 78.0%
mance ratio (PR) for
fixed-mounted PV
Source: Solar Atlas of the State of Palestine
Despite various climatic zones of selected sites, electricity production
in PV power plants is similar for most Palestinian area and depends
on irradiation. Power production mapping show that during summer
months, Palestinian sites profiles have a small range of difference in
monthly power production, thus, high and stable production can be
reached during summer season from May to August.
Considering all climatic facts, the highest PV electrical production in
Palestine is Gaza site, and the least productive site is Jericho, 1703 kWh/
kWp. Jericho site is specific due to its location in Jordan Rift Valley and
electricity generation is reduced by higher air temperatures. However,
the use of tracking systems can increase the energy output of PV power
plants by 40%.
36 | Solar Energy Production in Palestine5. Enabling Governance Setup
5.1. Policies and Strategies
The Palestinian Energy Authority issued a renewable energy strategy
that aims to gradually achieve 10% of electricity production from
renewable sources by 2020. According to the strategy, the goal can be
achieved if certain prerequisites are attained. The first prerequisite is the
approval of legislation and regulations to apply and promote relevant
technologies. The second prerequisite is the adoption of the necessary
financial sources to remunerate incentives and the adoption of feed-in
tariffs which could foster investments from the private sector. The third
is to build the capacity of the workforce so that it has the basic skills to
apply and deal with renewable technologies. The fourth is the adoption,
improvement, and construction of a plan for renewable energy sources
that would last until 2020.
According to the strategy, it is foreseeable that 130 MW will be generated
from renewable projects by 2020, and the major portion of green power
will be generated by solar energy. The strategy comprises two phases.
The first phase involved conducting feasibility studies and preparing
bids for the Palestinian market, as well as deploying small-scale projects
and implementing the Palestinian Solar Initiative. The first phase has
extended between the periods of 2012-2015 and aimed at attaining 25
megawatts from predetermined sources of renewable projects.
In terms of remuneration, the strategy differentiated feed-in tariff prices
according to the type and capacity of renewable projects, but it did not
determine the type of feed-in tariff to be adopted, and it also did not
determine the reduction formula which is used for the tariff’s annual
adjustment.
There are two options for the implementation of a feed-in tariff policy:
shifting the price gap between the spot market price and the tariff price
to end-users’ bills or supporting the gap with government subsides. In
this regard, the Palestinian Regulatory Council pledged to cover this
amount for distribution companies in the year 2013. It is worth to
Solar Energy Production in Palestine | 37pointing out that the feed-in tariff was amended only once in 2013,
but the feed-in tariff for 2014 was neither released nor referred to the
adjustment index.
5.2. Legal and regulatory environment
The most recent law related to renewable energy in Palestine, is the
Decree Law related to renewable energy and energy efficiency issued in
2015. Article 2 of the Decree Law states that the objective of the law is to
encourage utilization of renewable energy sources and their applications
in increasing the its contribution to total energy balance and achieve
secure energy provision in line with renewable energy strategy. It also
aims at environmental protection and also at fulfilling the sustainable
development requirements.
The decree law has specified the roles and responsibilities of the various
institutions and bodies involved in the energy regulation, monitoring,
production, distribution and transfer of energy. It also describes the
role and responsibility of Energy Research Center in terms of its role
in conducting research to define the best alternatives and locations
for renewable energy production and raising awareness and capacity
building in this sector.
Although 18 of the Decree Law encourages the investment in renewable
energy production through granting it all the privileges that investment
law provides, article 12 of the Decree restricts the production for
commercial purposes for limited period to be regulated by license. It
also didn’t define the feed in tariff that electric companies shall apply for
generated electricity from renewable sources and left it to be adopted
by the council of Ministers upon Energy Authority recommendation.
The second relevant law is the Electricity Decree Law N.13 that was
issued in 2009. The Decree has the main objectives of restructuring and
improving the electricity sector, as well as fostering national and foreign
investment in order to obtain an adequate power supply and properly
priced services. The Decree stipulates the establishment of an Electricity
Regulatory Council. The Decree also identified the Council’s duties and
responsibilities.
The Council has taken important decisions with regard to streamlining
38 | Solar Energy Production in Palestineand rectifying the companies currently working in the field. The council
attempted to merge the electricity distributors under four main
companies and made an effort to regulate and re-licence companies and
to avoid the simultaneous practice of the three actions of generating,
transmitting, and distributing. Although the Decree, along with its
derivative regulations, have paved the way for the organization and
restructuring of the electricity sector, the current conditions on the
ground seem to be uncontrolled. This is because the Decree is supposed
to apply to the whole Palestinian jurisdiction and not only to the West
Bank area. Furthermore, enforcement of the law is somewhat difficult in
all Palestinian areas.
Nevertheless, the Decree is the first step in sector regulation and in
achieving a new structure. In addition, the Electricity Decree Law
stipulated the establishment of a fully government-owned National
Transmission Company. The company is obligated to allow generators
and suppliers to use the national grid. It is also authorised to purchase
and sell power from any source and to resell the purchased power to
distribution companies.
Moreover, the Decree law distinguished the Energy Authority (EA) duties
and pinpointed the Regulatory Council’s responsibilities. The Council’s
main financial sources have also been predetermined. Furthermore, the
Decree defined the criteria that can help the Council to review and study
electricity tariff prices in order to advice the EA, with the EA consequently
taking the decision to adopt an adequate new tariff.
Additionally, the Decree defined the penalties for actions such as stealing,
destroying, or ravaging any component of the electricity network’s
infrastructure. Later in 2012, the Decree was amended in order to
modify some of the penalties related to offences in the electricity sector.
The Electricity Decree is complemented by instructions and bylaws issued
by the EA and the Council of Ministers in order to ensure its effective
enforcement. An electricity tariff, correcting status for companies and
local councils, licensing roles, and licensing fees are within the bylaws
and administrative decisions that have shaped a tools package for the
regulatory framework of Palestine’s electricity sector.
With regard to renewable energy sources, the Electricity Decree Law
explicitly mentions that the EA must work on encouraging research
Solar Energy Production in Palestine | 39about alternative energy sources, as well as regulating its exploitation using bylaws. Despite the abovementioned hurdles, efforts to restructure the electricity sector have moved forward. After issuing the Electricity Decree, the EA issued instructions 1 and 2 in 2010, which require companies and local councils to rectify their status. These instructions directly order companies and councils to comply with the Electricity Decree Law. According to the instructions, each company that works in the field should register as a public share company to be eligible for and obtain a practicing license. Otherwise, noncompliant companies will be subject to penalties. Moreover, the local council’s electricity service must become integrated with the main distribution companies, and they are no longer authorised to deliver electricity services separately. Lastly, the environmental law is somewhat address the issue, indirectly, and provides some ground for encouraging clean energy production and reduction of emissions. 40 | Solar Energy Production in Palestine
6.     Challenges and Constraints

        6.1. Political Situation
The Israeli government has not been carrying out its responsibilities
to serve the Palestinian population, particularly in the area under
the Israeli governments’ administrative and security control, the so-
called ‘Area C’, which comprises the major portion of the Palestinian
jurisdiction. Moreover, the geographical disconnection within the
Palestinian jurisdiction, the land separation between the Gaza Strip and
the West Bank, has hindered the Palestinian government from adopting
a single electricity policy among its districts. Similarly, in the West Bank,
the lengthy distance between populated areas, as well as Israeli control
over Area C, has impeded Palestinians from continuously improving
their electricity network.
Finally, the restrictions imposed on Palestinians to generate and
or developing their own electricity and continued destruction of
infrastructure, mainly the repeated destruction of power plant in Gaza
is the best example.

        6.2. Electric System Capacity and Efficiency
Unfortunately, Palestinian distribution systems’ capacity are limited
and are generally not maintained causing frequent power cuts and high
power loss in addition to other technical problems. This renders the
service inefficient and the demand higher than supply. Moreover, the
inadequate network causes a supply shortage for the industrial sector,
while the proportion of maintenance cost of electricity is very high
(nearly 35% of the operation cost).

                                             Solar Energy Production in Palestine | 41
7. Economic Feasibility of Photovoltaic Power Plants
7.1. Electricity prices and PV systems in Palestine
For PV investments in Palestine with capacities more than 1MW, PENRA
should be involved in the contract. Jerusalem Electricity Company
(JDECO) that has franchising in the Middle West Bank area (Ramallah,
Bethlehem, Jericho and East Jerusalem) can be considered as a model.
JEDCO offers PV investors a flat rate for electrical energy price. This rate
is now 0.094≈0.1 $/kwh ( 0.1 and can be negotiated for further little
increase to meet the dynamic electricity prices purchased from Israeli
IEC, the main electricity supplier for JDECO.
The fluctuation of purchased electricity prices is reflected directly on
JDECO prices to local consumers “subscribers”. As an example JDECO
tariff in the last two years was as follows:
Table 9: JDECO electricity dynamic tariff
Price per consumer’s category ($/kwh)
Tariff date 1-160 kwh/ 251-400 kwh/ More 601 kwh/
month month month
Since 1 Jan. 2014 0.134 0.168 0.200
Since 1 Feb. 2015 0.116 0.151 0.174
Since 13 Sep. 2015 0.115 0.143 0.167
Note: Conversion from local currency to US$ based on 2015 September
rate.
42 | Solar Energy Production in Palestine7.2. Investment Cost
The investment cost of 1 MWp Photovoltaic (PV) power plant can be
summarized as follows:
1. 1 MWp on-ground structured PV power plant,
2. Estimated cost is based on local market price ratings,
3. Capex of 1MWp PV plant is 1 - 1.2MUS$ including modules, inverters,
electrical cabling, mounting structure, civil work, installation and
engineering cost. And,
4. Opex is estimated to 32,000US$ including O&M including 5 cleaning
cycles, spare parts, inverter maintenance, power lines, in addition to
insurance and administrative cost.
7.3. Economic Feasibility Analysis
The economic feasibility analysis of 1 MWh PV power plant based on the
investment cost presented in section 6.2 and assuming that:
1. Purchase price of produced electricity will be a flat rate on 0.095 $/
KWh as applied by JEDCO and this is today’s selling price of Israeli
Company.
2. A yearly average of energy output of 1765MWh with 0.7% annual
decrease of energy production and 1% increase in the operational
cost each 5 years.
It was realized that the payback period of the investments in PV systems
can be realized in the 8’th year as shown in table 10.
Solar Energy Production in Palestine | 43Table 10: Payback period of PV Systems
Energy
Annual
Life production Energy Investment
Operational Net Reve- Net profit
Cycle of 1MW Revenue & return
costs ($US) nue ($US) amount
(Year) PV plant ($US) ($US)
($US)
(kWh/a)
0 0 $0 $0 $0 $1,100,000.00 $0
1 1765000 $167,675 $32,000 $135,675 $964,325 $0
2 1752645 $167,558 $32,000 $135,558 $828,767 $0
3 1740376.485 $166,385 $32,000 $134,385 $694,382 $0
4 1728193.85 $165,220 $32,000 $133,220 $561,162 $0
5 1716096.493 $164,063 $32,000 $132,063 $429,099 $0
6 1704083.817 $162,915 $32,320 $130,595 $298,504 $0
7 1692155.23 $161,775 $32,320 $129,455 $169,049 $0
8 1680310.144 $160,642 $32,320 $128,322 $40,727.00 $87,595.00
9 1668547.973 $159,518 $32,320 $127,198 $127,198.00
10 1656868.137 $158,401 $32,320 126,081$ $126,081.00
11 1645270.06 $157,292 $32,643 124,649$ $124,648.80
12 1633753.17 $156,191 $32,643 123,548$ $123,547.80
In addition the Net Present Value (NPV) of the investment for 20 years
of assumed life time of the PV system was calculated under various
assumptions as follows:
1. Assuming that the land required for the PV’s is purchased at cost
(10000$/dunum). In this case the NPV is positive with value of
191,793$ at interest rate of 6% and will be better when we apply the
environmental friendly rate of 3.5% with value of NPV is $519977
while the Internal rate of return IRR is nearly 8% as summarized in
Table 11.
44 | Solar Energy Production in PalestineTable 11: The Net Present Value (NPV) assuming that the land required for the
PV’s is purchased at cost (10000$/dunum).
Investment Interest Rate NPV IRR Payback
Cost
1250000$ 3.5% $519,977 0.08 9
1500000$ 6% $191,793 9
2. Assuming that the land required for the PV is rented at cost 500$/
dunum/year. In this case the NPV is positive with value of 252,147$
at interest rate of 6% and will be better when we apply the
environmental friendly rate of 3.5% with value of NPV is $561916
while the Internal rate of return IRR is nearly 9% as summarized in
Table 12.
Table 12: The Net Present Value (NPV) assuming that the land required for the
PV’s is rented at cost 500$/dunum/year
Investment Interest Rate NPV IRR Payback
Cost
1100000$ 3.5% $561,916 0.09 9
1100000$ 6% $252,147 9
It should finally be noted that if PV power plant is contracted on net
metering principle instead of flat rate price on electricity can be increased.
Net metering system is now offered by JEDCO to local electricity
consumers including industries and commercial centres. JEDCO tariff
for those enterprises reaches 0.26$/KWh. Using net metering system
energy prices on produced PV electricity can be increased, as well as it
considers PV production as for own purposes.
Solar Energy Production in Palestine | 458. Conclusions and Recommendations
• It was concluded that the current electricity supply level is not
sufficient to cover the needs in all areas in West Bank and Gaza Strip
and that there are still more than 216000 people in 135 communities
are either lacking adequate electricity or not connected to electricity
grid. In the mean time, the supply in Gaza is not sufficient at all and
that availability is by rotation among various areas for duration of
4 - 6 hours.
• Electric consumption is higher in the areas with higher population
which indicates that the main electricity consumption goes to the
household followed by commercial and light industrial activities.
• Demand for electricity will grow as population grows and will reach
7503 GWH / Yr under BAU scenario while it will be 7128 GWH/Yr
under conservation scenario.
• The conservation scenario is preferable to the BAU scenario in a
sense that it will save nearly 615 M$ over the planning period under
this premaster plan and will also reduce the C emission by 3.25
Million Ton over the planning period until 2030.
• Solar radiation is best in the central and southern parts of the West
Bank and Gaza where the highest is in Gaza and lowest in Jericho.
• The main challenges facing the investment in large solar energy
projects is the un clear laws and regulations related to the investment,
the tariff that can be applied and the difference in responsibilities
among various governing bodies. Even when there is laws, the
implementation of such laws is not easy due to political situation.
• It is clear that investing in renewable energy projects is economically
and environmentally feasible, yet, to encourage the development
and investment in this sector an incentive policy needs to be clearly
developed to address this issue.
• It is recommended to utilize empty spaces in the south - south
eastern slopes in the West Bank for generating electricity from solar
energy in order to meet the growing demand in Hebron area since
the highest demand is recorded there. In the mean time, due to
46 | Solar Energy Production in Palestinespace limitation in Gaza, it is recommended to utilize the roofs of
public buildings, light industrial establishments, greenhouse tops,
etc. to generate more electricity from solar energy.
• To comply with renewable energy strategy target of generating 10%
of electricity demand proposed by Palestinian energy authority, it
means that there is a need to generate 713 MWh/ Year over the
planning period toward 2030. This means that investment required
to generate this quantity is nearly 784 Million $ in case of considering
renting the land required for the investment. If we consider buying
the land required for the PV, considering the spacing and inclination
at angle 27 degree, it means that 9269 dunums are needed. Assuming
that average price per dunum in the eastern slopes is nearly 7000$
(can be much less depending on the area), it means that we shall add
approximately 65 Million $ to the investment or a total investment
of 849 Million $ approximately over the coming 13 years.
Solar Energy Production in Palestine | 47You can also read