Entrepreneurship During the COVID-19 Pandemic: Evidence from the Business Formation Statistics1 By John Haltiwanger June 2021 Abstract - National ...
←
→
Page content transcription
If your browser does not render page correctly, please read the page content below
Entrepreneurship During the COVID-19 Pandemic: Evidence from the Business Formation
 Statistics 1
 By
 John Haltiwanger

 June 2021

 Abstract
Applications for new businesses from the U.S. Census Bureau’s monthly and weekly Business
Formation Statistics (BFS) fell substantially in the early stages of the pandemic but then surged
in the second half of 2020. This surge has continued through May 2021. The pace of
applications since mid-2020 is the highest on record (earliest data available is 2004). The large
increase in applications is for both likely new employers and nonemployers. These patterns
contrast sharply with those in the Great Recession when applications for likely new employer
businesses and in turn actual startups of employer businesses declined sharply and persistently.
The surge in new business applications has been uneven across sectors. Ten 3-digit NAICS
industries account for 75% of the surge. Dominant industries include Nonstore Retail (alone
accounting for 33% of the surge), Professional, Scientific and Technical Services, Truck
Transportation, and Accommodation and Food Services. Given that existing small businesses in
Retail Trade and Accommodation and Food Services have suffered especially large declines in
the pandemic, these patterns are consistent with restructuring induced by the pandemic.

1
 University of Maryland and NBER. This paper, without implication, draws on collaborative research with
numerous colleagues I have worked with in the development and analysis of the Business Formation Statistics
(BFS). The research and development papers for the BFS with these colleagues are cited extensively in the text and
included in the references. This paper uses only public domain data from the BFS and other sources. Thanks to
Lucia Foster, Josh Lerner, Scott Stern, and participants at the 2021 NBER Conference on Entrepreneurship and
Innovation Policy and the Economy for helpful comments on an earlier draft and to Chris Roudiez for excellent
research assistance. The views expressed in the paper are those of the author alone.
The COVID-19 induced recession (henceforth COVID-19 Recession) began with an

extraordinarily large contraction in economic activity. The net employment contraction between

February and April 2020 exceeded 20 million for total nonfarm employment. Since then,

employment has recovered substantially but as of April 2021 is still more than 8 million below

the level in February 2020. 2 The massive contraction and recovery have been very uneven.

Existing small businesses have been hit especially hard especially in sectors such as

Accommodations and Food Services, Health Services, and Other Services where remote work

and remote interactions between businesses and consumers are difficult. Even in sectors that

have experienced a net increase in jobs from February 2020 to early 2021 such as Finance and

Insurance, existing small businesses have exhibited indicators of negative net growth, business

sentiment and recovery through early 2021. 3

 This characterization of existing small businesses being hit very hard with only limited

recovery contrasts with the patterns of new business applications from the Business Formation

Statistics (BFS). After an initial sharp decline from late March through May, new business

applications started to surge by June 2020. This surge has continued through May 2021.

Overall, calendar year 2020 is the highest year on record for new business applications since

2004 (the first year the BFS is available). 4 The surge in new business applications in 2020 and

2
 Statistics from www.bls.gov for Current Establishment Survey total non-farm employment.
3
 See Buffington et al. (2021) for details about this characterization of the impact on existing small businesses. The
evidence briefly summarized here is from the Census Small Business Pulse Survey (SBPS) discussed at length in
this paper. Fairlie (2020) presents evidence that existing small businesses were hit hard by examining self-
employment patterns from the CPS. Abraham et al. (2021) raise questions about how well the CPS captures self-
employment relative to the administrative data. The concerns they raise apply primarily the unincorporated self-
employment statistics from the CPS. Haltiwanger and Rendell (2021) find that the while the new applications for
likely employers closely tracts actual new employer startups from the BDS (consistent with the evidence shown
here) that the flow into unincorporated self-employment businesses does not match the patterns from the BFS or the
BDS in terms of new employer startups.
4
 The surge in new business applications in the BFS are matched by other sources such as the Startup Cartography
Project (SCP) as reported in Fazio et al. (2021). The latter covers only 8 states but offers rich and novel findings
into how these patterns vary across narrow geographic areas. See further discussion below in section III.

 1
2021 includes a surge in applications for both likely employer and likely nonemployer

businesses. These patterns contrast not only with the experiences of existing small businesses in

2020 but also with business applications in the Great Recession. In the Great Recession, new

applications for likely employers as well as actual employer business startups declined sharply.

 The surge in new applications in 2020 and 2021 for likely employer businesses is

surprising especially given historical experience and the evidence and expectations early in the

pandemic. The decline in new applications for likely employer businesses early in the pandemic

exhibited a similar pattern to the sharp downturn after the collapse of Lehman Brothers in the

Fall 2008. 5 Even some aspects of the rapid fiscal policy response did not appear to bode well for

starting new employer businesses in the pandemic. A key component of the CARES act of

March 2020 is the Payroll Protection Program (PPP) designed to protect jobs of existing small

businesses. Given the unprecedented nature of the shutdown of the economy in the pandemic, it

is not surprising that there was strong support to protect jobs in this manner. However, from the

perspective of economic theory (see, e.g., Acemoglu et al. (2018)) subsidizing incumbents can

potentially suppress business entry. Viewed from this perspective, the surge in new business

applications in 2020 that has continued into 2021 is even more surprising. The analysis in this

paper provides insights and guidance into the underlying likely sources of these surprising

patterns.

 In considering these issues, it is critical to distinguish between new applications for likely

employer and likely nonemployer businesses. In the Great Recession, applications for likely

5
 New applications for likely employers and actual employers started to decline prior to the Great Recession at least
partly due to the decline in financial conditions (e.g., the collapse in housing prices) that preceded the Great
Recession. See Fort et al. (2014) and Davis and Haltiwanger (2019) for more analysis of the decline in employer
startups in the Great Recession. See Dinlersoz et al. (2021) for an in-depth comparison of business applications in
the Great Recession relative to the COVID-19 Recession.

 2
new nonemployer businesses increased consistent with a countercyclical component of self-

employment. In the pandemic, the surge in new business applications has been especially large

for likely nonemployer businesses with the surge four times larger than the increase in the Great

Recession.

 The BFS is derived from administrative data from the Internal Revenue Service (IRS) on

Employer Identification Number (EIN) applications. All employer businesses in the United

States are required to have an EIN to file payroll taxes. New non-employer businesses also file

for an EIN if forming a partnership or an incorporated business. Even new sole proprietor non-

employers often file for an EIN to facilitate their business activity (e.g., working with other

businesses or opening a business bank account). The EIN application form includes the name

and address of the applicant and business, business start date, type of business entity, principal

industry, and planned date of initial wage payments (if applicable). The filing date and business

location information are used to aggregate individual applications to weekly and monthly

frequency. The IRS transmits these applications to Census on a weekly flow basis in virtually

real time. 6

 The detailed information on the application permits decomposing new business

applications (BA) into likely employers and likely nonemployers. Businesses that have a high

propensity of becoming an employer business based upon, for example, the application

indicating planned wages are designated as High-Propensity Business Applications (HBA).

Consistent with Bayard et al. (2018), evidence presented in this paper shows that there is a tight

6
 Bayard et al. (2018) describe in detail how certain types of applications are automatically excluded from the BFS
since they are tax entities not for engaging as employer or nonemployer self-employment activity. For example,
applications for trusts and estates are excluded. It is also worth noting that the application process itself is largely
online and automated so that disruptions in IRS activity early in the pandemic have apparently had little or no
impact on the tracking and reporting of applications.

 3
relationship between HBA and actual new employer startups over the subsequent 8 quarters.

The difference between BA and HBA is referred to as likely nonemployers (NHBA) in this paper

and the analysis below shows that fluctuations in NHBA closely track fluctuations in

nonemployers. The public domain BFS also includes series by geography (state) and industry.

The geographic and industry variation permits analysis of the dispersion in entrepreneurial

activity across sectors and locations.

 This surge in new business applications in the pandemic is of interest given the important

role that employer startups play in job creation, innovation, and productivity growth

(Haltiwanger et al. 2013; Alon et al. 2018; Acemoglu et al. 2018; and Guzman and Stern, 2020).

More generally, new employer startups are an important point of the ongoing creative destruction

dynamics in the U.S. economy (see, e.g., Davis and Haltiwanger, 1999). The surge in likely

nonemployer new applications is also of interest given increasingly important role that gig

workers are playing in the U.S. economy (see, e.g., Abraham et al. 2021).

 The potentially changing nature of the relationship between applications and transitions

in the pandemic period necessitates appropriate caution in interpreting the patterns of nascent

entrepreneurship from the BFS during the pandemic period. Still, the historically tight

relationships indicate that these have been highly predictive indicators of entrepreneurship in the

past. In addition, the patterns of new applications by sector and industry during the pandemic

presented below are consistent with the shifts towards remote activity interactions between

businesses and workers (i.e., telework) and businesses and consumers (i.e., online retail and

restaurant purchases with accompanying delivery to customers residential locations). These

patterns suggest that the surge in new applications reflect ongoing restructuring in the economy

 4
induced by the pandemic. There are open questions about how much of this will persist and, to

the extent there is persistence, whether the pandemic is accelerating pre-pandemic trends.

 The paper proceeds as follows. Section II provides a description of the BFS to help

interpret the striking patterns of this novel data. Section III presents the main results providing

insights on the basic patterns, the contrast between the patterns in the COVID-19 recession and

the Great Recession, and the sectoral and geographic differences in applications during the

pandemic. Analysis of the relationship between new business applications and indicators of

business and worker turnover is presented in section IV. Section V includes a discussion of

whether programs like the Paycheck Protection Program (PPP) have impacted the observed surge

in new business applications. Concluding remarks, including discussion of next steps for

research, are provided in Section VI.

II. Description of Business Formation Statistics

 The public domain BFS series are available weekly from 2006:w1 through the present

and monthly from 2004:m7 through the present. 7 The weekly series include total applications

(BA), high propensity applications (HBA), applications with planned wages (WBA), and

applications for corporations (CBA) at the national and state level (all not seasonally adjusted).

The monthly series include all the same application series and some formation series. For the

latter, actual new employer business formations from these applications over the next four and

eight quarters (BF4Q and BF8Q) as well as projections for new business formations (PBF4Q and

PBF8Q) are released at the national, sectoral, and state level. The series are available both

seasonally adjusted and unadjusted (only the seasonally adjusted monthly series are used in the

current paper). The BFS data are very timely: weekly data are released for a given reference

7
 As of the writing of this paper, the weekly series is available though 2021:w21 (through May 29, 2021) and the
monthly series is available though 2021:m4.

 5
week on the Thursday after the reference week and monthly data are released within two weeks

of the end of the reference month. The NHBA series used in this paper is constructed directly

from the difference between BA and HBA.

 Applications designated likely employers (HBA) include applications that have at least

one of the following indicators on the application: (i) are from corporations, (ii) indicate hiring

an employee (iii) indicate a first wages paid/planned date, and (iv) in certain industries:

manufacturing, food and accommodation services, health care, and part of retail. Overall, HBA

have less than 50% likelihood of becoming employer businesses within 8-quarters after

application, but fluctuations in HBA (see Figure 2 below) closely track actual employer startups.

Applications denotes as likely nonemployers (NHBA) have a low probability of becoming

employer businesses of only 3.8%. 8 However, as shown below fluctuations in NHBA closely

track fluctuations in nonemployers.

 The empirical model used to predict transitions for the series PBF4Q and PBF8Q is

described in detail in Bayard et al. (2018). Briefly, the projections are based on a linear

probability model (LPM), which relates observed transitions of business applications to

employer businesses in the Longitudinal Business Database (LBD) to a set of predictors from the

EIN application form. The variables include indicators of the business start date, type of entity,

industry, limited liability status, reason for applying, and wage date. The model also controls for

location (state), week of application submission within the year, presence of prior EIN, and

whether the application indicates a trade name, or a distinct business address. The covariates of

the empirical model also include interactions between industry, wage date, type of entity, and

reason for applying. Figure 6 of Bayard et al. (2018) shows that projected transitions track actual

8
 See Bayard et al. for the rates of employer business formation associated with different application characteristics
(2018).

 6
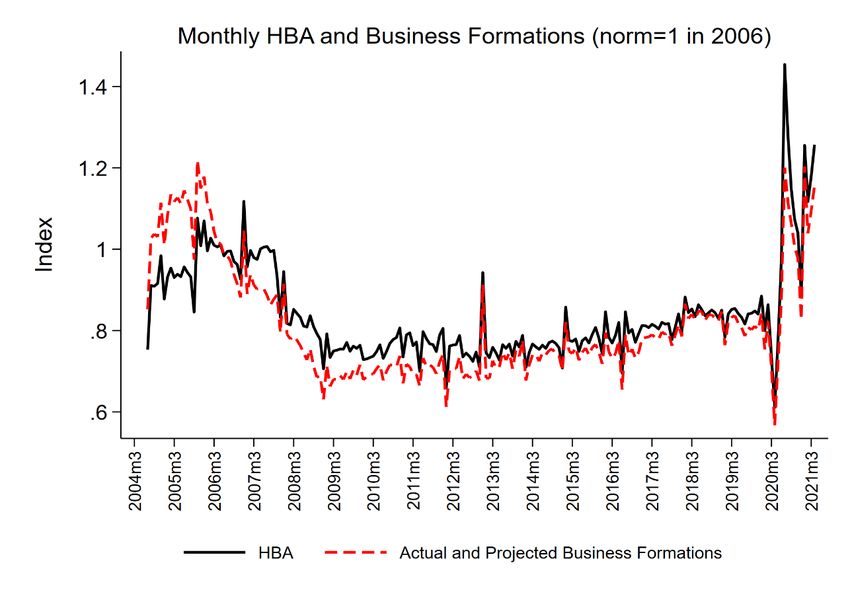
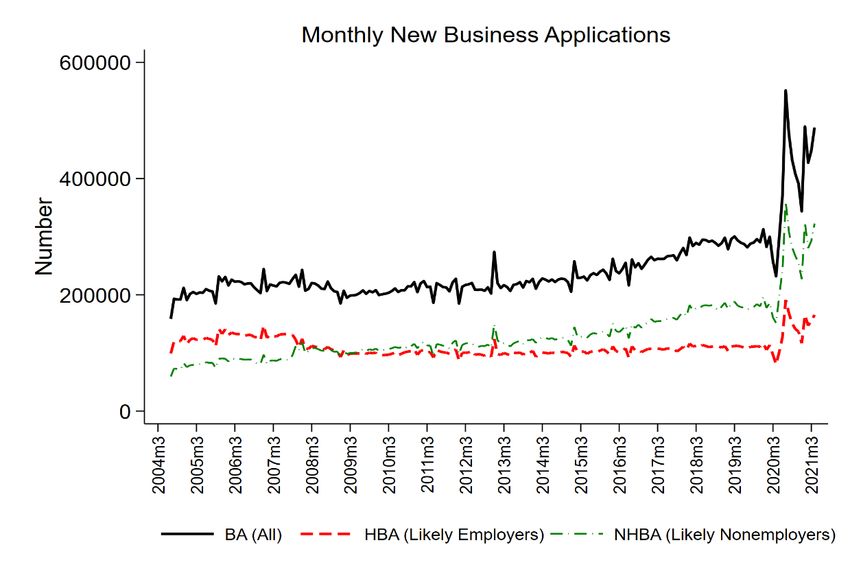
transitions closely, both within and out of sample. In the analysis in this paper, the focus is on the

spliced business formations using the actual formations up through 2018 and the projected

transitions thereafter. During the period that the actual and projected transitions are available

(from 2004 to 2018) these series closely track each other.

III. Evidence on Entrepreneurship in the Pandemic

 This section starts with some basic facts about business application series before

proceeding to analyses from cyclical, sectoral, and spatial perspectives.

 A. Basic Facts

 The patterns of new business applications (BA, HBA, and NHBA) from 2004:m7 through

2021:m4 are shown in Panel A of Figure 1. Panel B repeats Panel A but narrows the time frame

to 2019:m1 to 2021:m4 to permit greater focus on the pandemic. The upward trend in NHBA

and the downward trend in HBA from 2004:m7 through 2020:m2 are evident. 9 At the outset of

the pandemic there is a sharp decline in BA, HBA and NHBA in March through May 2020.

However, by June 2020 the number of applications of all types exceeds any month from January

2019 through February 2020. The surge in applications of all types peaks in July 2020 but the

numbers in August 2020 to March 2021 exceed the number of applications in all prior months

back to 2004:m7 for BA and NHBA and in all prior months back to 2007:12 for HBA.

 HBA tracks actual (through 2018) and projected transitions to new employer startups as

shown in Figure 2. Indices are depicted in Figure 2 given differences in levels and the projected

transition series is for transitions to employer business over the next 8 quarters. The transition

rate is lower than 50% (see Bayard et al. 2018) even for HBA, highlighting that HBA should be

interpreted as an indicator of nascent entrepreneurship in terms of potential new employer

9
 In fact, HBA is greater than NHBA from 2004 through 2008 when NHBA begins to be larger than HBA.

 7
startups. However, since the correlation in the monthly indices series is 0.88 it is apparent that

variation in this indicator of nascent entrepreneur closely tracks variation in new employer

startups. 10 It is, of course, of great interest to identify the determinants of the applications that

successfully make the transition to an actual employer startup. Bayard et al. (2018) highlight

that there is enormous spatial variation in both application and the transition rates. Active

research is underway to identify the sources of such variation.

 The BFS does not provide indicators of actual or projected new nonemployers. However,

a comparison of NHBA with published nonemployer statistics indicates a tight relationship.

Figure 3 presents indices of the actual total number of nonemployers and the predicted number

of nonemployers. 11 The correlation between the actual and projected series is almost one.

 B. Cyclical

 The weekly data enable a detailed comparison of the dynamics of new business

applications in the COVID-19 Recession and the Great Recession. For both recessions, a simple

event study characterization of the dynamics is instructive where the patterns of business

applications prior to and after a reference week 0 are examined (see Dinlersoz et al. (2021) for a

related empirical analysis). 12 For the COVID-19 Recession, week (0) is defined as week 10 of

2020 (the week ending March 13, 2020). Given the weekly data are not seasonally adjusted, it is

10
 This is the correlation through 2018 using only actual startups.
11
 The predicted number of nonemployers uses the actual number of nonemployers in 2006, exit rates from
nonemployers (from Davis et al. 2009), and projecting entry into nonemployers from NHBA (see appendix for
details). Appropriate caution for interpreting this calculation as this is a crude calculation. NHBA only includes
applications for new EINs that are likely nonemployers. Nonemployers includes sole proprietors without EINs. The
index approach helps overcome these limitations.
12
 Dinlersoz et al. (2021) conduct a closely related but more sophisticated econometrics exercise using state-level
weekly data. The findings reported here are consistent with their findings. This closely related work using a
regression framework enables establishing that the variation presented here reflects not only economically
significant but also statistically significant differences. The findings reported here include applications through
April 2021 while Dinlersoz et al. (2021) report pattens through the end of 2020. Also, Dinlersoz et al. (2021) use
DHS growth rates to accommodate the state-level variation they exploit while the analysis reported here uses
national totals.

 8
instructive to compute the cumulative difference (backwards and forwards) relative to week 10

of 2020 with the cumulative difference relative to week 10 of a base period which we choose to

be week 10 of 2018. For the Great Recession, the reference week 0 for the crisis that is

considered is week 37 of 2008 (the week just prior to the Lehman Brothers collapse). The

cumulative differences computed for the Great Recession use 2006 as the base period (with week

0 of the base period being week 37 of 2006). The cumulative differences are reported 63 weeks

after the reference week 0 for both the Great Recession and the COVID-19 recession. For the

latter, this reflects cumulative differences through May 29, 2021.

 The patterns for the COVID-19 Recession are depicted in the upper panel of Figure 4.

Prior to the crisis (i.e., prior to week 10 in 2020) applications for likely employers in the first 10

weeks of 2020 were similar to those for the base period of 2018. As such there is not much

cumulative difference going backwards. After week 0 of the crisis, applications fell initially in

2020 relative to base period of 2018 but then have risen substantially. Through May 2021, new

applications for likely employers were almost 500K greater over a similar period from March

2018 through May 2019. For likely nonemployers, the first part of 2020 had slightly higher

applications than the comparable first part of 2018. Applications for nonemployers also declined

initially early in the crisis but then quickly rebounded. Through May 2021, new applications for

likely nonemployers were more than 1.3 million greater than a similar period from March 2018

through May 2019.

 The lower panel depicts the same exercise for the Great Recession. The patterns are

dramatically different. For likely employer applications, applications in the 10 weeks prior to the

reference week in 2006 are higher than those in 2008. This is evident from Figure 1. After the

Lehman Brothers collapse, applications for likely employers fell substantially for the 63

 9
subsequent weeks compared to the reference period. These patterns for likely employers in the

Great Recession are also evident for actual new employer startups as shown in Figure 2.

 The decline in actual employer startups in the Great Recession has been examined at

length elsewhere (see Davis and Haltiwanger (2019) and references therein). The analysis here

highlights the decline in actual entrepreneurship is anticipated by the observed decline in nascent

entrepreneurship in the BFS. One interesting feature of the decline in both nascent and actual

entrepreneurship for employer businesses over this period is that the decline began before the

start of the Great Recession (December 2007) and as such prior to the Lehman Brothers collapse

in September 2008. While the trend decline in the pace of actual entrepreneurship precedes

2006, the sharp cyclical downturn in employer startups that is often linked to the Great Recession

begins in 2006 prior the start of the Great Recession. Davis and Haltiwanger (2019) highlight

that the sharp decline in actual entrepreneurship that began in 2006 is associated with the sharp

decline in housing prices that also began in 2006. An interesting area for future research is to

investigate the differing impact of changing financial conditions on nascent versus actual

entrepreneurship.

 Turning back to Figure 4, for nonemployers the 10 weeks in 2008 prior to Lehman

collapse had similar patterns than the comparable period in 2006. After Lehman’s collapse,

applications for nonemployers increased relative to the comparable period in 2006. While this is

qualitatively similar to the COVID-19 Recession, the latter is four times larger than the increase

in the Great Recession. Moreover, by 52 weeks after the crisis week 0 in the Great Recession,

the cumulative difference had stopped increasing. In contrast, for the COVID-19 Recession, the

cumulative difference continued to surge for weeks 52 to 63.

 10
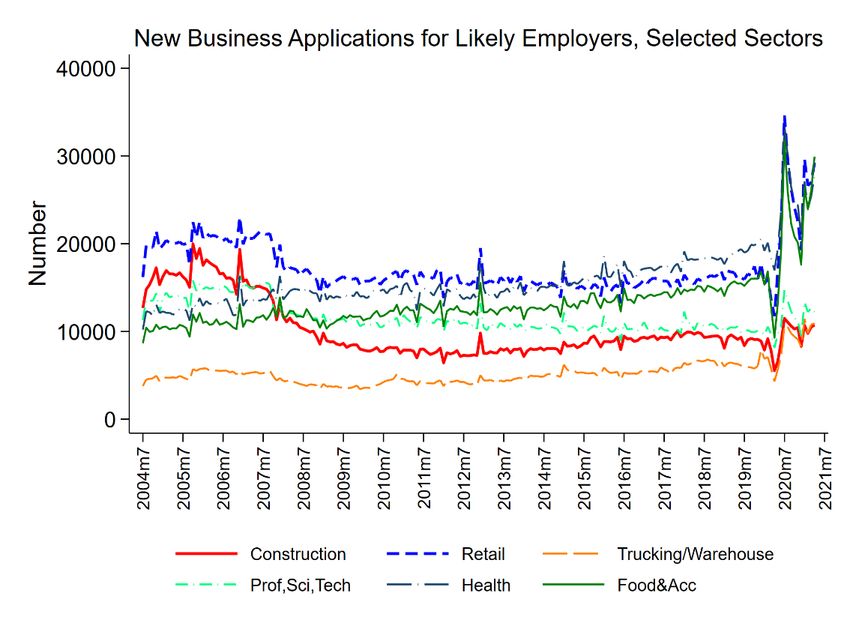
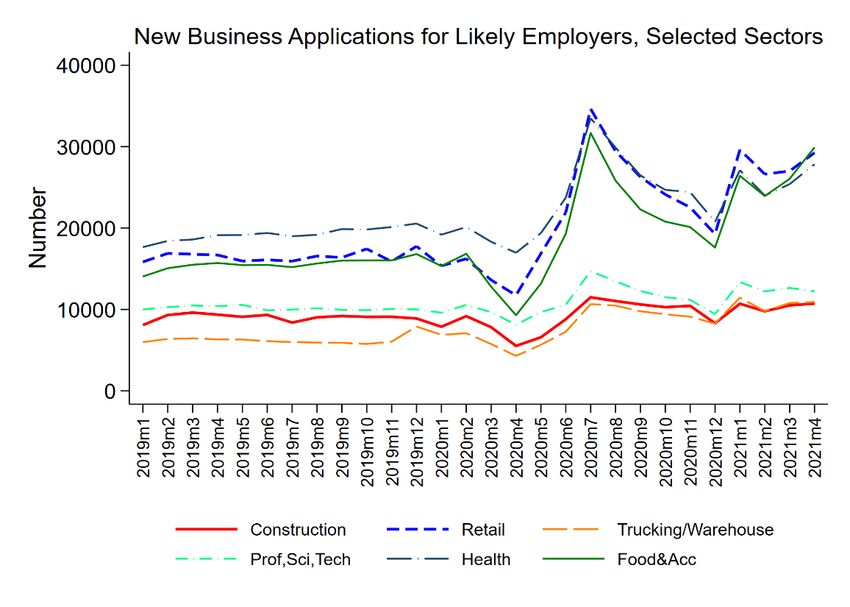
Why are the patterns for applications for likely employers and likely nonemployers so

different between the Great Recession and the COVID-19 Recession? This is an open and active

area of current research; however, some factors already appear to be important. First, financial

conditions are dramatically different across these episodes. The financial crisis that is at the root

of the Great Recession included a decline in housing prices, a decline in net worth for

households, and substantial challenges for bank balance sheets. Small business lending

collapsed over this period. Some of this reflected likely reflected demand side factors but Davis

and Haltiwanger (2019) identify a credit supply channel that adversely impacted young

businesses. In contrast, financial markets have been robust in the COVID-19 Recession with

housing prices rising and financial intermediaries much healthier in this period.

 Secondly, the COVID-19 Recession has induced a change in the structure of the U.S.

economy towards more remote activity and this provides incentives for new businesses to

explore such potential opportunities. The restructuring component of the surge in business

applications can be investigated by examining the changing sectoral composition of new

business applications. This is the topic of the next section.

 C. Sectoral

 The surge in new business applications in the pandemic has been uneven across

industries. The top panel of Figure 5 shows the monthly patterns of applications for likely new

employers for selected sectors for the 2004:m7 to 2021:m4 period while the bottom panel shows

the patterns for the 2019:m1-2021:m4 period. The surge in new applications for likely

employers in the pandemic is dominated by Retail Trade but other sectors with substantial

 11
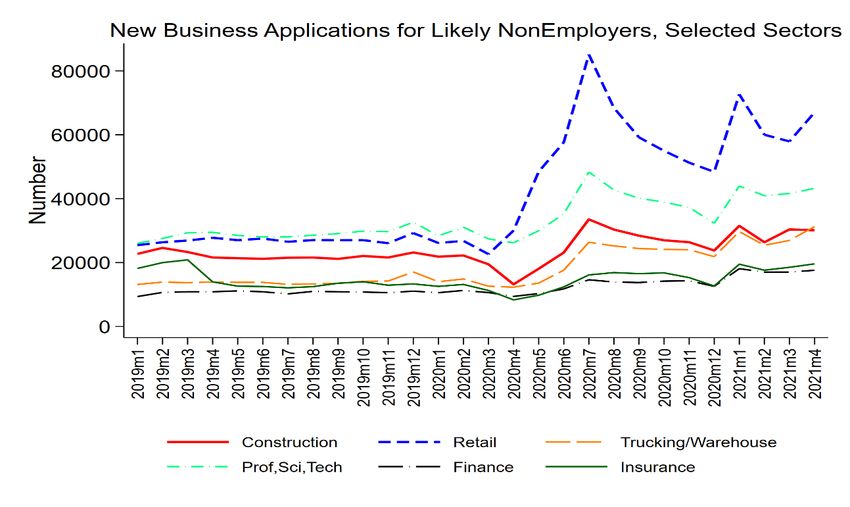
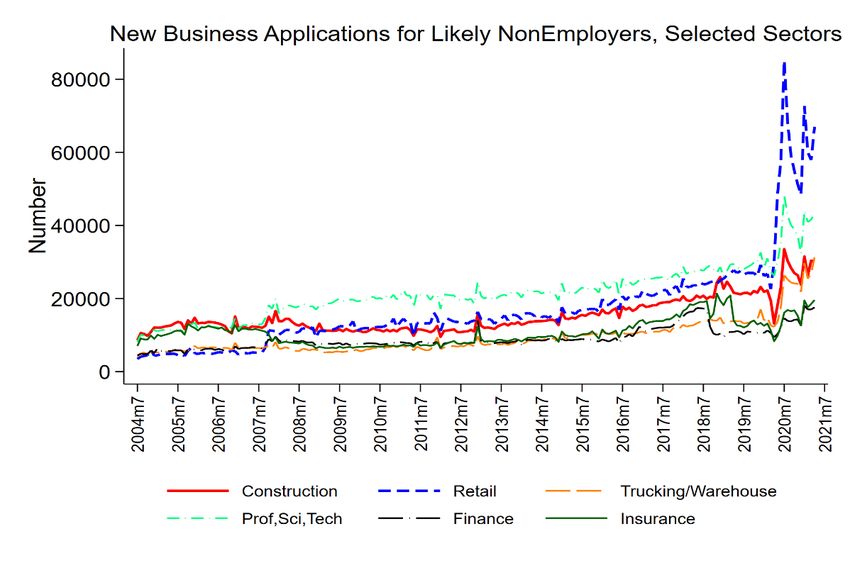
increases including Food and Accommodations and Health Services. 13 New applications for

likely nonemployers for selected sectors are reported in Figure 6. The surge in 2020 is

dominated by Retail Trade accompanied by Professional, Scientific and Technical Services;

Construction; and Trucking and Warehousing.

 A special release in October 2020 of the weekly BFS covering 2019:w1-2020:w40

provides more industrial detail for overall applications. Figure 7 presents the 3-digit NAICS

sectors with the largest change in the number of new applications over the first 40 weeks of 2020

compared to the first 40 weeks of 2019. The largest change in share is for Nonstore Retailers

which increased its number of applications by about 200K over this period. In 2019, Nonstore

Retailers accounted for only 9% of overall applications. Thirty-three percent of the increase in

applications from 2019 to 2020 is accounted for by this industry alone. The top ten industries

listed in Figure 7 account for 75% of the increase in applications over the first 40 weeks of 2020

compared to 2019.

 Figures 5-7 highlight the uneven nature of surge in applications across industries. Figure

8 presents the between sector dispersion in year-over-year growth rates of the monthly growth

rates of HBA and NHBA. The top panel shows that dispersion in new application growth rates

across sectors for HBA rose in the Great Recession, declined in its aftermath, and exhibited an

upward trend through 2019. The dispersion fell in the early stages of the pandemic but has risen

steadily since May 2020.

 Between sector dispersion in NHBA did not change much in the Great Recession but like

dispersion for HBA has exhibited a positive trend from 2012 to 2019. After falling early in the

13
 Appropriate caution is required in interpreting the results for Accommodations and Food Services as well as
Health Services given that applications in both sectors are automatically classified into HBA. As explained in
Bayard et al. (2018) applications in those sectors have a higher-than-average propensity of becoming employers.

 12
pandemic, between sector dispersion in NHBA growth rates has risen sharply since March 2020.

Dispersion peaked in August 2020 and has fallen since then but remains above levels pre-2020.

 All this highlights that the pandemic surge in business applications is associated with

intensified restructuring on several dimensions. For one, entry by itself an important component

of restructuring in terms of business turnover. Second, the uneven patterns across sectors that

change rapidly over a short period of time suggests that the restructuring has an important

between sector component. The sectors with especially high business application rates provide

guidance about the nature of this restructuring. The dramatic rise in sectors such as Nonstore

Retail is consistent with the shift towards remote interactions between businesses and consumers.

The rise in applications in sectors such as Retail Trade and Food and Accommodations are

notable given the employment losses in those sectors as well as the especially adverse effects of

the pandemic on existing small businesses in these sectors. From Feb 2020 to April 2021

employment losses in these two sectors are 400K and 2.2 million, respectively. 14

 Putting these BFS patterns into perspective, the SBPS from the Census Bureau highlights

that existing small businesses have been pivoting their business operations during the pandemic

in several ways (see Buffington et al. (2021)). Remote work activity has increased dramatically

especially in some sectors like Information. Moreover, online activity connecting existing small

businesses to customers has increased substantially. The surge in new applications mirrors this

shift in business activity. However, strikingly the SBPS shows that even by January 2021,

existing small businesses in all sectors exhibit negative indicators in terms of growth, business

sentiment and expectations. The surge in applications in the BFS concentrated in specific sectors

14
 Statistics from www.bls.gov CES employment by sector.

 13
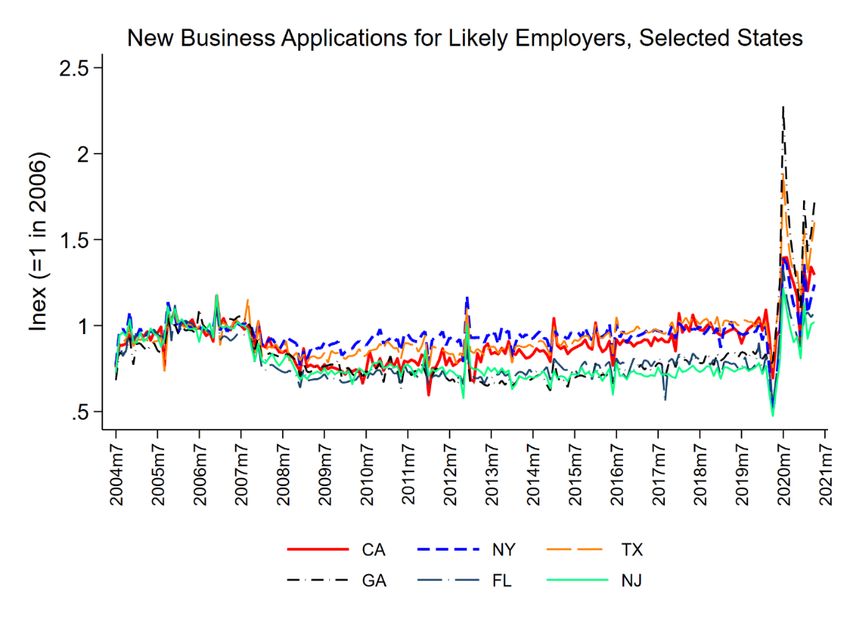
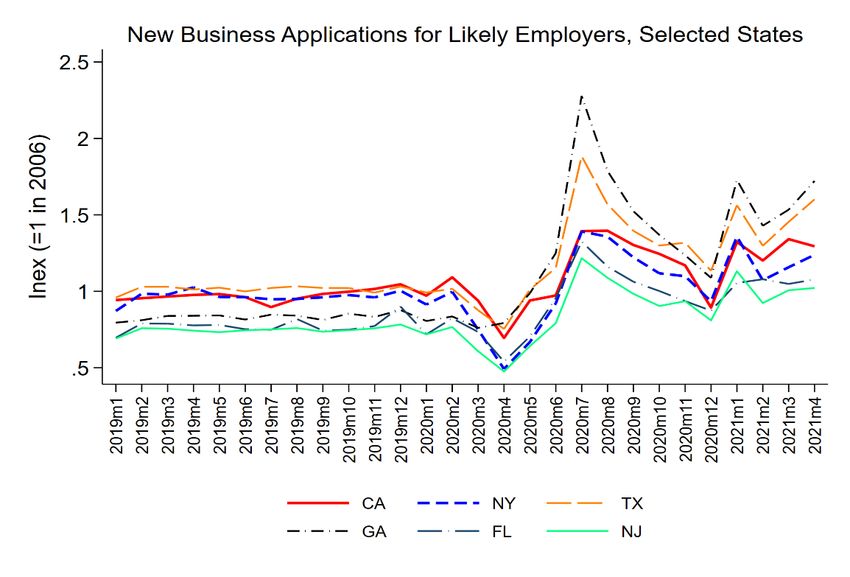
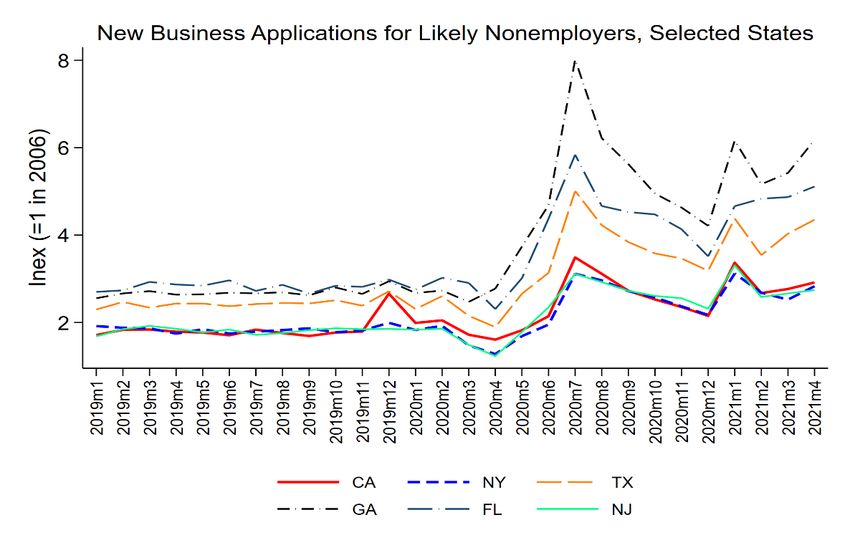
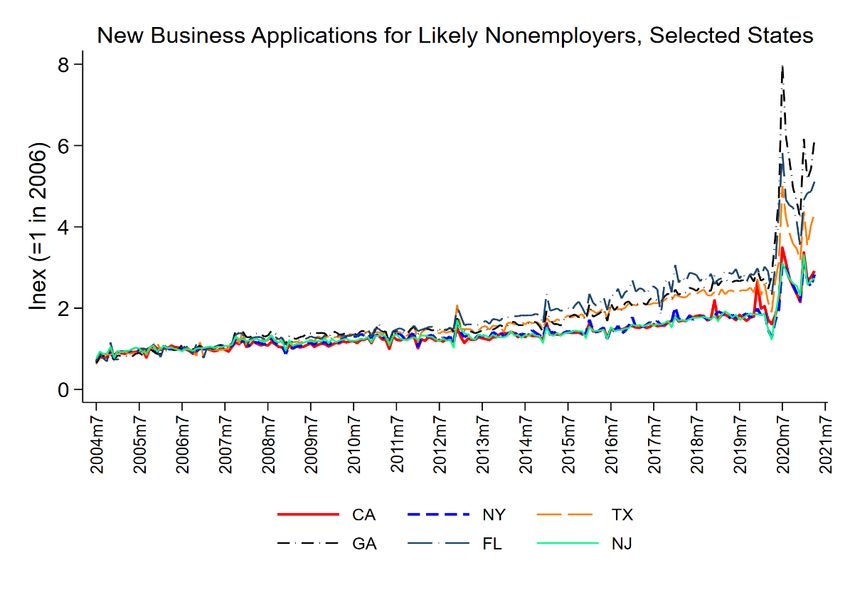
suggests the restructuring involves a shift away from existing small businesses towards new

businesses.

 D. Spatial

 The surge in new business applications in the pandemic has also been uneven across

locations. The top panel of Figure 9 shows the monthly patterns of applications for likely new

employers for selected states for the 2004:m7 to 2021:m4 period while the bottom panel shows

the patterns for the 2019:m1-2021:m4 period. For this state-level analysis, index numbers equal

to one on average in 2006 to adjust for the size of the state at specific point in time (2006). The

surge in new applications for likely employers in the pandemic is especially large in Georgia,

Florida and Texas compared to California, New York, and New Jersey. New applications for

likely nonemployers for the same selected states are reported in Figure 10. The surge in 2020 for

likely nonemployers is again especially large in Georgia, Florida and Texas compared to

California, New York, and New Jersey.

 Figures 9 and 10 highlight the uneven nature of surge in applications across states. 15

Figure 11 presents the between state dispersion in year-over-year growth rates of the monthly

growth rates of HBA and NHBA. The top panel shows that dispersion in new application

growth rates across states changed little in the Great Recession and has been reasonably stable

through 2019. The dispersion rose substantially in May through July and has declined since

then. However, it remains at a level higher than pre pandemic.

15
 Fazio et al. (2021) present evidence across 8 states that is broadly consistent with that presented here in terms of
an uneven surge in applications across geographic areas. A novel and interesting finding in this work from the SCP
project is that the surge in new firm formation has been especially in zip codes including a high proportion of
African-American residents and in particular higher median income African-American neighborhoods.
Investigating the cross sectional and time series patterns of entrepreneurship by race and ethnicity at both the
individual and neighborhood level should be a high priority for future research.

 14
Between state dispersion in NHBA also did not change much in the Great Recession and

has been reasonably stable through 2016 but exhibited a decline and then recovery in the 2017-

18 period. Between state dispersion in NHBA in the pandemic follows the patterns for HBA

closely rising sharply from May through July 2020 and then declining through March 2021 but at

a level higher than pre pandemic.

 Comparing the patterns of between sector and between state dispersion (Figures 8 and 11,

respectively), the increasing dispersion in between sector growth rates is more persistent than the

increase in dispersion in between state growth rates. While more research is needed on

understanding these differences, these patterns suggest a more profound restructuring between

sectors than between states. Interestingly, Buffington et al. (2021) find that the uneven impact of

the pandemic on existing small businesses is more persistent between sectors than between

states.

 What we do not know from the public-domain BFS is how the restructuring across

sectors and states are related. For example, in the locations where existing small businesses in

specific sectors have been hit the hardest, are new applications surging? Alternatively, it may be

that it is in the locations where existing small businesses in specific sectors have fared the best

that new applications are surging. In other words, is the observed restructuring within

sector/location cells are between sector/location cells? Future research using the micro data

underlying the BFS can be used to investigate these issues.

IV. New Business Applications, Business and Worker Turnover

 Figure 2 makes clear the tight relationship between new business applications for likely

employers (HBA) in each month and new employer business startups in the subsequent 8

 15
quarters. As discussed above, new employer startups play a disproportionate role in job creation,

innovation, and productivity growth. This contribution is a noisy and complex one as startups

are part of an ongoing creative destruction dynamic in the economy. While it is beyond the

scope of this paper to explore this latter connection fully, in this section the relationship between

new business applications for likely employers and indicators of business and worker turnover is

explored.

 For this purpose, the monthly applications for likely employers are aggregated to the

quarterly frequency to enable analysis of indicators from the Business Employment Dynamics

(BED). The latter provides quarterly estimates of business births and deaths (at the

establishment-level). Estimates of hires, separations and job openings from Job Openings and

Labor Turnover Survey (JOLTS) are also used. While JOLTS is available at the monthly level,

for the analysis in this section these measures are also aggregated to the quarterly frequency to

facilitate a joint analysis of the indicators from the BFS, BED and JOLTS.

 Simple bivariate Vector Autoregression (VAR) are used to quantify joint dynamics.

Technical details of the specifications are described in the appendix. The analysis of these

dynamics is restricted to the quarterly data from 2004:3-2019:4. This restriction in this dynamic

VAR analysis is for a number of related reasons. First, as is evident from Figure 1, there are

dramatic fluctuations in the business applications during the COVID-19 pandemic that are

unprecedented in magnitude. Second, new business applications are inherently forward looking

since the BFS shows that it can take more than one year for HBA applications to yield actual

new employer business startups. 16 Given the potentially substantial lags, the surge in business

applications in the second half of 2020 is unlikely to have its full effect on other indicators until

16
 This can be seen by the finding that SBF8Q exceeds SBF4Q.

 16
several quarters in the future. Given the nature of the analysis, appropriate caution is needed in

making inferences about the implications of the surge in applications during the pandemic for

business and worker turnover. Still the analysis in this section provides guidance about the

potential future impact of the pandemic surge in applications based on historical patterns.

 Figure 12 reports cumulative impulse response functions of a quarterly innovation in

HBA to establishment openings and closings. 17 A one standard innovation in HBA yields a

substantial and significant increase in business births over the next 16 quarters (see panel A).

This evidence is consistent with Figure 2. The novel insight from Figure 12 is that a one

standard innovation in HBA also yields a substantial and significant increase in business deaths

over the next 16 quarters (panel B). In unreported results (available upon request), there is no

evidence of reverse causality. 18 That is, there is no evidence that an innovation in business births

or deaths yields subsequent significant changes in new business applications.

 Figure 13 illustrates that distinct but related dynamics are present for hires and

separations. A one standard deviation in HBA yields substantial and significant increases in

hires and separations rates over the next 16 quarters. 19 Figure 14(a) shows that the impact on

hires is greater than the impact on separations as the net employment growth impact (hires minus

17
 The mean establishment birth and death rates are about 3 percent per quarter with a standard deviation of about
0.2.
18
 That is, an innovation in the business births or deaths variable yields no substantial subsequent change in HBA
applications. These statements hold regardless of the Choleski ordering used in the VAR analysis. See the appendix
for more detail. The orthogonalized MA representation of the impulse response functions can be given a causal
interpretation. Often the causal inferences depend on the Choleski ordering but not in this case.
19
 The mean hires and separations rates are about 10.7 and 10.5 percent per quarter, respectively. The corresponding
standard deviations are about 0.9 and 0.8 percent, respectively. For the net employment growth rate (from hires
minus separations) the mean is 0.2 per quarter with a standard deviation of 0.5. The job openings rate has a mean of
about 10 percent per quarter with a standard deviation of 2.5.

 17
separations from JOLTS) is positive. There is also a substantial and significant impact on job

openings over the next 16 quarters (Figure 14b). 20

 The results in this subsection are suggestive and call for further research. Figures 12

through 14 do not provide guidance on the mechanisms underlying these patterns but highlight

the close connection between new business applications and business and worker turnover. For

example, the surge in business deaths following an innovation in new applications may reflect

creative destruction forces at work or alternatively but relatedly the propensity of many new

businesses to exit. More generally it may be that new business applications react quickly to

current or expected changes in economic conditions that are harbingers of indicators of business

and worker turnover. Further evidence and discussion of these issues is provided in Asturias et

al. (2021). This latter research provides evidence that an innovation in the growth in HBA yields

a substantial and persistent increase in non-farm payroll employment growth. This latter finding

is consistent with the implied larger impact of HBA on hires vs. separations discussed above.

V. COVID-19 Economic Stimulus Policies and Entrepreneurship

 Given the importance of the Paycheck Protection Program (PPP) for existing small

businesses (75% of existing small businesses in the SBPS report receiving PPP assistance), a

natural question to ask is whether the PPP impacted new business applications. 21 This is a

complex question that requires more research in part because the PPP and other fiscal stimulative

programs may have impacted new business formation indirectly via the impact on the overall

20
 Unreported results available upon request show little evidence of reverse causality for hires, separations, net
employment growth or job openings.
21
 See also Buffington et al. (2021) for a discussion of this issue.

 18
economic outlook. Alternatively, economic theory implies (see, Acemoglu et al. (2018)),

support for incumbent businesses can have a negative impact on business formation.

 The key to thinking about this question is that the PPP program is designed to provide

support to existing businesses. Applicants for PPP must have been in business by February 2020

with the loan application requiring documentation of business activity pre-pandemic. This

implies that employer businesses that received a PPP loan already had an EIN in February 2020

well before the surge in new business applications. Most of the PPP loans went to employer

businesses. 22 Holding the state of aggregate economy fixed, this support for existing small

businesses is if anything likely to have dampened the incentives for starting new employer

businesses. Viewed from this perspective, the surge in applications for likely employer

businesses is arguably not because of, but despite, the PPP program.

 Of course, the state of the economy has been anything but fixed. In considering these

issues, the discussion of the cyclical patterns of new business applications and business

formation in section III.C is relevant. Davis and Haltiwanger (2019) highlight that all economic

downturns since the early 1980s have exhibited a decline in employer business startups relative

to trend. From this perspective, the pandemic would have been expected to lead to a decline in

applications for new employers. However, given that self-employment has a countercyclical

component, the pandemic would have been expected to yield an increase in nonemployer activity

and in turn applications for likely nonemployers. To the extent the CARES act dampened the

adverse effect of the pandemic on the economy, the cyclical impact on new business formation

22
 About 1/7 of the recipients of PPP were nonemployers as of February 2020. Many of these likely also had an
EIN. An EIN is required for nonemployer corporations and partnerships. Also, many sole proprietor nonemployers
have an EIN as this facilitates doing business with other businesses and an EIN is required for having a business
bank account. It is possible that some of the relatively small fraction of nonemployer, sole proprietor PPP loan
recipients were induced to apply for an EIN as part of the PPP program. See appendix B for further discussion.

 19
would have been expected to have been dampened. Moreover, as discussed above, the PPP

component of the CARES act by subsidizing incumbents may have dampened new applications

for likely employers. Other components of the CARES act (e.g., direct payments to households)

may have helped boost the incentives to start new businesses. 23

 This discussion helps highlight why the surge in applications for both likely employers

and nonemployers is at least ex ante surprising. As it has become clear that the pandemic is

leading to both short run and potentially longer run restructuring of the U.S. economy, this surge

is less surprising.

VI. Concluding Remarks

 The surge in applications for new businesses in the pandemic has been large and distinct.

The total number of applications in 2020 is the highest by far compared to all years for which the

data have been available. The increase from 2019 to 2020 in total applications exceeds 20

percent which is double the growth rate in any other year. The increase is in applications for

both likely employers and nonemployers. All of the increase in 2020 is accounted for by a surge

in applications in the second half of 2020. This surge in applications has continued through May

2021. Based on historical patterns, this surge in applications should result in a surge in new

employer and nonemployer businesses. The increase in new employer businesses should be

within four to eight quarters of the date of the applications based upon historical patterns.

 The surge in new business applications has been uneven across sectors. Ten 3-digit

industries out of about 100 3-digit industries account for 75% of the surge. Dominant industries

include Nonstore Retail (alone accounting for 33% of the surge), Personal Services, Professional,

Scientific and Technical Services, Administrative and Support Services, Truck Transportation,

23
 Fazio et al. (2021) offer some evidence in support of this hypothesis.

 20
and Accommodation and Food Services. Given that existing small businesses in Retail Trade

and Accommodation and Food Services have suffered especially large declines in the pandemic,

these patterns are consistent with restructuring induced by the pandemic. As the economy

recovers from the pandemic, an open question is the extent to which the increases in

remote/telework activity observed during the pandemic will persist. The extent to which these

changes “stick” is likely to vary across types of businesses and locations. The shift towards e-

commerce is likely to stick as this reflects a pre-pandemic trend. Viewed from this perspective,

the pandemic may be accelerating ongoing trends and the surge in business applications is part of

this process.

 Does this surge in new business applications imply there will be a surge in job creation,

innovation, and productivity growth over the next few years? Obviously, this is an open

question but in considering these possibilities several factors are important to consider. First,

basic facts about new businesses (see, Haltiwanger, Jarmin and Miranda 2013 and Decker et al.

(2014)) highlight that most new employer businesses fail within the first five years after entry

and conditional on survival, most do not grow. A relatively small fraction of young businesses

grow very rapidly and it is these high growth firms that are especially important for job creation

that persists, innovation and productivity growth. The analysis in this paper shows that the pre-

pandemic a surge in new business applications has yielded substantial and significant increases

in indicators of both business and worker turnover over the subsequent four years. It remains to

be seen whether similar patterns will apply in the next few years.

 The surge in applications for likely nonemployers is also of interest as an indicator of the

changing structure of the economy. The number of nonemployer businesses has been on an

upward trend over the last 15 years or so with rapid acceleration in the post-2010 period. As

 21
discussed in Abraham et al. (2021), this reflects an increase in the gig economy including and

especially the ridesharing industries. The evidence presented in Abraham et al. (2021) (and

references therein) highlight that much of nonemployer activity reflects supplemental and

stopgap activity.

 The surge in applications for likely nonemployers thus may reflect at least in part an

acceleration of pre-pandemic trends. However, several factors suggest the surge is more

complicated. For one, the surge in applications for likely nonemployers are for those applying

for EINs. Most of the nonemployers in the ridesharing industry are sole proprietors that are not

required to have an EIN. In addition, the surge in applications for likely nonemployers are in

sectors that reflect promoting remote activity such as Nonstore retailers. Just as for new

employer startups, an open question is whether new nonemployers also will “stick”. A closely

related question is whether the new nonemployers business activity will mostly be stopgap or

supplemental as in the past. Or alternatively are we seeing an increase in the share of individuals

where nonemployer activity is the primary or only source of work activity?

 Finally, the surge in new business applications raises a variety of important measurement

questions and challenges. For one, the high frequency traditional statistical series such as the

BLS monthly payroll report rely on imputing aggregate growth based upon survey respondents

that provide reports in consecutive months. 24 An adjustment is made for the impact of births and

deaths using a birth-death model. Benchmark revisions are made annually based upon

comprehensive administrative data. An open question is whether this surge in applications will

imply large benchmark adjustments as the birth-death model is based on historical relationships

that do not hold in the pandemic. Second, interpreting the impact of the surge in applications is

24
 This limitation is shared by many high frequency economic indicator surveys.

 22
hampered by limitations in other key related series. To understand the implications of business

entry variation over time, industry and location, evidence on business exit is also needed. As

highlighted by Crane et al. (2020), official statistical agency reports on business closures emerge

only slowly given the relatively slow processing of key administrative data at Census (e.g.,

payroll tax reports) and BLS (e.g., ES-202 employment reports as part of the QCEW program).

Business closure data from these sources for all of 2020 will begin to become available in

published statistics in late 2021. Relatedly reports on the outcomes of existing young and small

businesses by sector and location depend on this same administrative data. This implies that

understanding where the observed fluctuations in the BFS fit into these outcomes will take some

time to sort out. Novel high frequency surveys like the SBPS help fill in the gaps but have some

limitations. As noted by Buffington et al. (2021), the SBPS is more informative about

continuing small businesses than business closures (as survey non-response is inherently higher

for businesses that have ceased operations). More research is needed to help develop these

important measures of business deaths.

 23
References

Abraham, Katharine G., John C. Haltiwanger, Kristin Sandusky, and James R. Spletzer (2021)
 “Measuring the Gig Economy Current Knowledge and Open Issues” in NBER/CRIW
 Conference Volume on Measuring and Accounting for Innovation in the 21st Century,
 (forthcoming).

Acemoglu, Daron, Ufuk Akcigit, Nicholas Bloom, and William. R. Kerr (2018) “Innovation,
 Reallocation and Growth," American Economic Review, 108, 3450-3491.

Alon, Titan, David Berger, R. Dent, and Benjamin. Pugsley (2018) “Older and slower: The
 startup deficit's lasting effects on aggregate productivity growth," Journal of Monetary
 Economics, 93, 68-85.

Asturias, Jose, Emin Dinlersoz, John Haltiwanger and Rebecca Hutchinson. (2021). “Business
 Applications as Economic Indicators,” Center for Economic Studies Working Paper, CES
 WP-21-09.

Bayard, Kimberly, Emin Dinlersoz, Timothy Dunne, John Haltiwanger, Javier Miranda, and
 John Stevens. (2018). “Early-Stage Business Formation: An Analysis of Applications for
 Employer Identification Numbers,” NBER Working Paper, 24364.

Buffington, Catherine, Daniel Chapman, Emin Dinlersoz, Lucia Foster, and John Haltiwanger
 (2021), “High Frequency Business Dynamics in the United States During the COVID-19
 Pandemic,” mimeo.

Crane, Leland D., Ryan A. Decker, Aaron Flaaen, Adrian Hamins-Puertolas, and Christopher
 Kurz (2021). “Finance and Economics Discussion Series 2020-089r1. Washington: Board
 of Governors of the Federal Reserve System, https://doi.org/10.17016/FEDS.2020.089r1.

Davis, Steven, and John Haltiwanger (1999), “Gross Job Flows” Handbook of Labor Economics,
 Volumes 3 and 4, edited by Orley Ashenfelter and David Card, 2711-2805.

Davis, Steven, John Haltiwanger, C.J. Krizan, Ron Jarmin, Javier Miranda, Al Nucci, and Kristin
 Sandusky (2009), “Measuring the Dynamics of Young and Small Businesses: Integrating
 the Employer and Non-Employer Businesses," in Producer Dynamics: New Evidence
 from Micro Data, (Dunne, Jensen and Roberts, eds.) NBER/University of Chicago Press,
 329-366.

Davis, Steven, and John Haltiwanger (2019). “Dynamism Diminished: The Role of Housing
 Markets and Credit Conditions” NBER Working Paper No. 25466, January.

Decker, Ryan A., John Haltiwanger, Ron S. Jarmin, and Javier Miranda (2016) “Where has all
 the skewness gone? The decline in high-growth (young) firms in the US," European
 Economic Review, 86, 4-23.

 24
Decker, Ryan A., John Haltiwanger, Ron S. Jarmin, and Javier Miranda (2020) “Changing
 Business Dynamism and Productivity: Shocks vs. Responsiveness," American Economic
 Review, 110, 3952-3990.

Dinlersoz, Emin, Timothy Dunne, John Haltiwanger, and Veronika Penciakova (2021),
 “Business Formation: A Tale of Two Recessions,” AEA Papers and Proceedings.
 (forthcoming).

Fairlie, Robert (2020), “The impact of COVID-19 on small business owners: Evidence from the
 first 3 months after widespread social-distancing restrictions” Journal of Economics and
 Management Strategy, 1-14.

Fazio, Catherine, Jorge Guzman, Yupeng Liu, and Scott Stern (2021), “How is COVID
 Changing the Geography of Entrepreneurship? Evidence from the Startup Cartography
 Project,” mimeo.

Fort, Teresa, John Haltiwanger, Ron Jarmin and Javier Miranda (2014), “How Firms Respond to
 Business Cycles: The Role of Firm Age and Firm Size,” IMF Economic Review, 520-559.

Foster, Lucia, Cheryl Grim, John Haltiwanger, and Zoltan Wolf. 2021. “Innovation, Productivity
 Dispersion, and Productivity Growth.” In Measuring and Accounting for Innovation in
 the 21st Century, ed. Carol Corrado, Jonathan Haskel, Javier Miranda, and Daniel Sichel.
 Chicago: University of Chicago Press (forthcoming).

Gort, Michael and Steven Klepper. 1982. “Time Paths in the Diffusion of Product Innovations,”
 The Economic Journal, Vol. 92, no. 367 (Sept.), 630–53.

Guzman, Jorge, and Scott Stern. 2020. "The State of American Entrepreneurship: New Estimates
 of the Quantity and Quality of Entrepreneurship for 32 US States, 1988–2014." American
 Economic Journal: Economic Policy, 12 (4): 212-43.

Haltiwanger, John, Ron S. Jarmin, and Javier Miranda (2013) “Who creates jobs? Small versus
 large versus young," Review of Economics and Statistics, 95(2), 347-361.

Haltiwanger, John and Lea Rendell (2021) “Tracking Entrepreneurship in the U.S.: Survey vs.
 Administrative Data” (mimeo), in progress.

Jovanovic, Boyan. 1982. "Selection and the Evolution of Industry." Econometrica 50 (May):
 649–70.

Pugsley, Benjamin. W., Petr Sedlacek, and Vincent Sterk (2018) “The Nature of Firm Growth,"
 Discussion paper, CEPR Discussion Paper No. DP12670.

 25
Figure 1. BFS Monthly Applications
 A. BFS applications 2004:m7-2021:4

 B. BFS applications 2019:m1-2021:m4

Notes: Source: BFS. BA=All business applications. HBA=High Propensity Applications
(likely employers). NHBA=BA-HBA (likely nonemployers)

 26
Figure 2. Monthly Applications for Likely Employers and New Employer Startups

Notes: Source: BFS. HBA=High Propensity Applications. Actual and projected transitions =
SBF8Q. Actual transitions through 2018.

 27
Figure 3. The Relationship between NHBA and Nonemployers

Note: Source: BFS and NES statistics from Census. Predicted nonemployers using NHBA uses
exit rates from nonemployers from Davis et al. (2009) and entry rates based on NHBA.

 28
Figure 4. Comparison in Patterns of Business Applications Between COVID-19 and Great
Recession.
 A. COVID-19

 B. Great Recession

Notes: Source (BFS Weekly through May 15, 2021). Week 0 for COVID-19 Recession in crisis
period is week ending March 7, 2020 (referred to as week 10 in BFS weekly calendar). Week 0
for reference period for COVID-19 Recession analysis is the equivalent week 10 in 2018. Week
0 for Great Recession in crisis period is week ending September 13, 2008 (referred to as week 37
in BFS weekly calendar). Week 0 for reference period for Great Recession analysis is the
equivalent week 37 in 2006.
 29
Figure 5. New Business Applications for Likely Employers (HBA), Selected Sectors
 A. 2004:m7-2021:4

 B. 2019:m1-2021:4

Notes: Source: BFS.

 30
Figure 6. New Business Applications for Likely Nonemployers (NHBA), Selected Sectors
 A. 2004:m7-2021:m4

 B. 2019:m1-2021:m4

Source: BFS
 31
Figure 7. Changing Sectoral Composition of Applications Between 2019 and 2020

 32
Figure 8. Dispersion in Between Sector Net Growth Rates for Likely Employers (HBA) and
Nonemployers (NHBA)
 A. 2005:m7-2021:m4

 B. 2019:m1-2021:m4

Notes: Source: BFS. Standard deviation of Y/Y monthly growth rates across 2-digit NAICS
sectors.

 33
Figure 9. New Business Applications for Likely Employers (HBA), Selected States
 A. 2004:m7-2021:m4

 B. 2019:m1-2021:m4

Source: BFS.

 34
You can also read