#VDILIKEAPRO - End User Computing State of the Union 2020
←
→
Page content transcription
If your browser does not render page correctly, please read the page content below

End User Computing
State of the Union 2020

        #VDILIKEAPRO                                                   Version 1.0 – June 2020

   Authors: Ruben Spruijt, Christiaan Brinkhoff and Mark Plettenberg

                                                                        https://www.vdilikeapro.com
#VDILIKEAPRO - End User Computing – State of the Union – 2020

   IT IS NOT ALLOWED TO – PARTIALLY – PUBLISH OR
DISTRIBUTE CONTENT FROM THIS PAPER WITHOUT PRIOR
APPROVAL. WHEN YOU WANT TO USE CONTENT OF THIS
    WHITEPAPER CONTACT US team@vdilikeapro.com

        THIS DOCUMENT IS PROVIDED "AS IS"
         WITHOUT WARRANTY OF ANY KIND
          FOR REFERENCE PURPOSES ONLY

           COPYRIGHT 2020, #VDILIKEAPRO
                       https://www.vdilikeapro.com

       #VDILIKEAPRO - End User Computing – State of the Union – 2020    1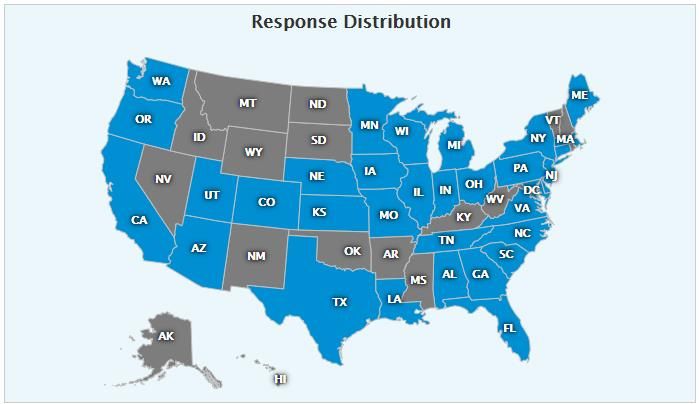
#VDILIKEAPRO - End User Computing – State of the Union – 2020

Table of Contents
Highlights .................................................................................................................. 5
Introduction .............................................................................................................. 7
   About VDI Like a Pro ......................................................................................................... 7
   Made possible by: Login VSI ............................................................................................. 7
Teamwork ................................................................................................................. 8
   Team and contact .............................................................................................................. 8
   Leaderboard ...................................................................................................................... 8
   The State of VDI survey is executed by: ............................................................................ 8
   From VDI and SBC to Virtual applications and desktops ................................................... 9
Participant information ............................................................................................ 9
   Who contributed to the state of the union? ...................................................................... 11
   What is the most important business vertical to use your Virtual applications and desktops
   environment?................................................................................................................... 12
   What is the total amount of users within your organization? ............................................ 13
Operating Systems................................................................................................. 14
   What type of operating systems are you using? .............................................................. 14
   What single-Session operating systems are you using? .................................................. 15
   What multi-session operating systems are you using? .................................................... 16
   What’s your perfect workload size for your single-user operating system (VM)?.............. 17
   What’s your perfect workload size for your multi-user operating system (VM)? ............... 17
Use-cases, products usage, data locality, persistent/none-persistent and more
................................................................................................................................. 18
   What is the primary factor/use case to use Virtual Applications and Desktops?............... 18
   In what phase is your Virtual Applications and Desktops environment? ........................... 19
   What is the maximum capacity of simultaneous / concurrent user sessions for your Virtual
   Applications and Desktops environment? ........................................................................ 20
   Which virtual applications and desktop session broker solution is currently deployed on-
   premises?........................................................................................................................ 21
   What percentage of the single-user virtual machines are shared (pooled/stateless/non-
   persistent/personal?) ....................................................................................................... 23
   Where are your workload machines, hosting your Virtual applications and desktops
   located?........................................................................................................................... 24
   Who is responsible for delivery/management of the EUC infrastructure service? ............ 25
   What are today's biggest challenges with your on-premises virtual applications and
   desktops environment? ................................................................................................... 26
   Are you satisfied overall with the current Virtual applications and desktops solution? ...... 27
Infrastructure: Hypervisor, Servers, Storage, GPUs and more .......................... 28
   What hypervisor is currently deployed for you virtual Applications and Desktops? .......... 28

                       #VDILIKEAPRO - End User Computing – State of the Union – 2020                                                        2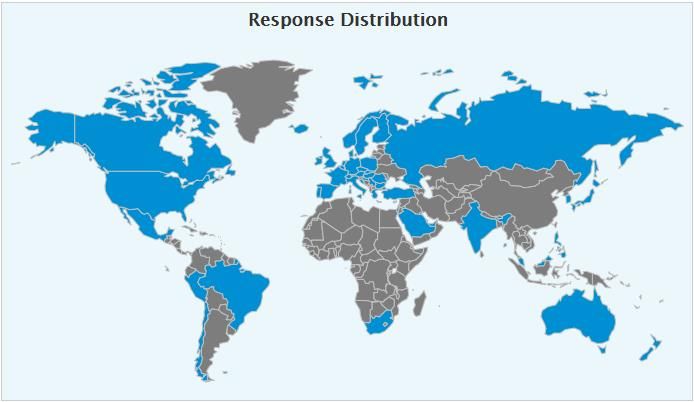
#VDILIKEAPRO - End User Computing – State of the Union – 2020

  Will you introduce or change to a different hypervisor for your Virtual applications and
  Desktops workload? ........................................................................................................ 30
  Which server hardware brand is used to host the Virtual applications and desktops
  environment?................................................................................................................... 31
  Which storage technologies (not products) are used to host these desktops? ................. 33
  Which storage product is used to host the virtual applications and desktops (on
  premises)? ...................................................................................................................... 34
  Which GPUs do you use for your virtual applications and desktops?............................... 36
Applications: Layering, imaging, updates, management, isolation, antivirus,
workspace portal and more ................................................................................... 37
  Do you currently use an application layering solution in virtual applications and desktops?
  ........................................................................................................................................ 37
  How is the user environment managed?.......................................................................... 38
  Which image deployment and/or cloning solution is currently used? ............................... 39
  Which Office version is current standard in the virtual applications and desktops
  environment?................................................................................................................... 40
  Do you currently use unified communication solution? .................................................... 41
  Do the end-users use Desktops or remote/published applications? ................................. 42
  How are Windows OS and applications installed, updated and managed on your main
  platform? ......................................................................................................................... 43
  What % of applications in your environment are native Windows applications? ............... 45
  Which application isolation/virtualization solution is used within your environment? ........ 46
  What percentage of Windows applications are virtualized? ............................................. 48
Various questions: Load testing, patching, devices, display config ................. 49
  Do you perform load tests in your virtual applications and desktops environment? .......... 49
  How often do you patch your systems? ........................................................................... 50
  What products do you use to monitor your environment? ................................................ 51
  What is the ratio of devices being used to access your virtual applications or desktops? 52
  What anti-virus solution are you using? ........................................................................... 53
  What is the most common display configuration in your company? ................................. 55
  Do you use or will you use a unified workspace portal solution? ...................................... 56
Public Cloud: use-cases, challenges, products, strategy, GPUs,...................... 57
  Why are you using or (potentially) interested in Virtual applications or Desktop as a
  Service (DaaS)? .............................................................................................................. 57
  What are the biggest challenges in using or adopting public Cloud? ............................... 59
  In which phase is your Desktop-as-a-Service (DaaS) public cloud deployment currently?60
  Which DaaS solution are you using, or will you introduce? .............................................. 61
  What is your cloud strategy with regards to workload VMs? ............................................ 62
  For what specific use case(s) in your environment did you choose Desktop-as-a-Service
  (DaaS)? ........................................................................................................................... 63
  Where’s your data in a DaaS scenario?........................................................................... 64

                       #VDILIKEAPRO - End User Computing – State of the Union – 2020                                                            3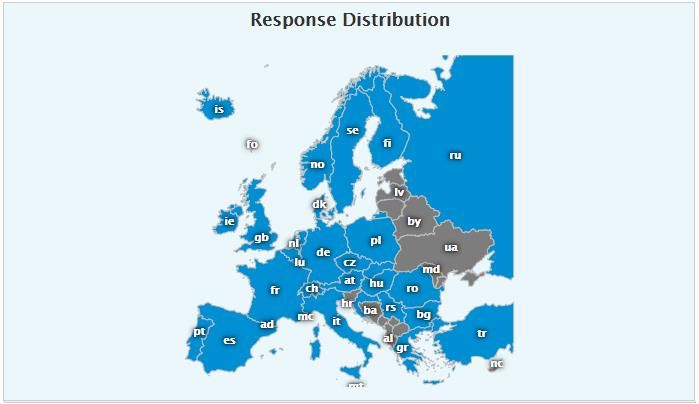
#VDILIKEAPRO - End User Computing – State of the Union – 2020

  Which GPUs do you use for your virtual applications and desktops in the cloud? ............ 65
Workspace initiatives, feedback, comments ....................................................... 66
  Your opinion: Virtual applications and desktops in 3 years from now are: ........................ 66
  What is your most important Workspace/EUC initiatives for 2020/2021+? ....................... 67
  What keeps you awake at night – IT related – ................................................................. 69
  Comments ....................................................................................................................... 74

                      #VDILIKEAPRO - End User Computing – State of the Union – 2020                                                     4
#VDILIKEAPRO - End User Computing – State of the Union – 2020

Highlights
VDI Like a Pro conducted the seventh worldwide ‘End User Computing – State of the Union’ survey in
2020. Over the years, similar surveys were conducted in 2012, 2014, 2015, 2017, 2018 and 2019
The ‘End User Computing – State of the Union’ is truly unique because it’s unbiased, independent,
powered by the community and the results are available for everyone—free of charge.
The document provides valuable insights in trends, real-world deployments, configuration and
usage, both on-premises and public cloud environments, from more than 695 people who supported
the survey.

   •   695 people supported the survey and on average, completed the survey in 10 minutes.
   •   North America has the largest response distribution and is clearly the largest region by far.
       There is a relatively high number of participants from the Netherlands (17.9%), likely
       because VDI Like a Pro and their team members are well-connected with end-users,
       partners, and vendors in this region.
   •   The audience that filled in this survey has been mostly technical (Engineer, Administrator,
       Architect) with 47,48% followed by consultants (25,90%) and IT managers (11,75%).
   •   With 15.35% Finance became the largest business vertical market for virtual desktops and
       application solutions. Healthcare with 13.19% is 2nd and Government with 11.75% is 3rd
       largest vertical.
   •   26.17% is using a multi-user operating system (with multiple users actively sharing the VM)
       while 22.74% is using a single-user operating system.
   •   With 37.25% Windows Server 2016 is used the most followed by Server 2019 with 20.24%
       and Server 2012R2 still used by 18.22% of the respondents. Windows 10 EMS (Enterprise
       multi-session) was introduced in 2019 and is used with 11.13% of the organizations.
   •   The majority of respondents in the 2020 survey are running their workload VMs to virtual
       desktops and applications in a private cloud environment using on-premises or co-located
       datacenters.
   •   The majority of respondents of the 2020 survey, 55.35%, is running and supporting the EUC
       infrastructure ‘broker’ as part of their own IT service while 30.5% is consuming the control
       plane or broker as a service from e.g. Microsoft, Amazon, Citrix, Nutanix, VMware and
       others.
   •   A perfect (according to users and administrators) virtual desktop and application
       environment is more common in 2020 with 10.90% an increase of 6.68% compared to 2019.
   •   VMware remains by far the largest vendor delivering virtual hypervisor infrastructure for
       virtual desktops and applications, although the usage is slowly decreasing from 65.8% in
       2014, 64% in 2015 and 2016, 61.4% in 2018, 56% in 2019 and 55% in 2020. Microsoft Hyper-
       V usage is slowly decreasing from 13.18% in 2019 to 11% in 2020
   •   This year 59.5% of participants stated they didn't have any plans to change their hypervisor
       while 7.53% is still investigating hypervisor options.
   •   The biggest GPU competitors isn’t AMD versus Intel versus NVIDIA—it’s the CPU (again).
       Many organizations think the CPU can handle the graphics-related activities and therefore
       don’t use GPUs. “No GPU” declined from 78% in 2014, 67% in 2016, 56% in 2017, 44.92% in
       2018, 43.06% in 2019 and is at 35.41% in 2020.
   •   This year for the first time we asked if GPUs are using in public cloud. The majority of virtual
       desktop and application deployments aren’t using GPUs, 44.91% while NVIDIA NV instance
       types on Azure are using 21.56%.
   •   AMD is slowly entering the EUC space with promising EPYC CPUs and Radeon GPUs, the
       AMD GPUs have entered the public cloud space with Azure NVv4 machines but on-premises
       AMD GPUs unfortunately aren’t used a lot.

                 #VDILIKEAPRO - End User Computing – State of the Union – 2020                            5
#VDILIKEAPRO - End User Computing – State of the Union – 2020
• FSLogix Profile Container is the most popular user environment management this year, after
the acquisition in 2018 by Microsoft. The decision to make the product available for almost
everyone has been an important for this adoption rate.
• The total usage of Microsoft FSLogix profile containers is 20.49%. Citrix user environment
management solutions is 16,23 % in 2020, VMware solutions is 7.21% and Appsense (Ivanti)
declined from 8.32% in 2019 to 7.54% in 2020 while RES Workspace Manager (Ivanti)
declined from 8.87% in 2019 to 4.59% in 2020.
• The adoption of Office 365 ProPlus increased from 26.95% in 2019 to 53% in 2020.
Microsoft 2016 declined from 44.48% in 2019 to 28% in 2020. Google GSuite is being used in
1.58% of the deployments and slowly increasing but still minor compared to Microsoft.
• The use of unified communications with voice and video support has increased rapidly
from 13.4% in 2014, 30.6% in 2017, 37.90% in 2018, 38.72% in 2019 and 47.92% in 2020.
While Unified Communications in virtual applications and desktops always is ‘attention’ and
often challenging it is great to see usage increasing.
• We are surprised to see that IT Admins are increasingly using manually installation and
update of OS and applications within the master image.
• 46.65% of the respondents do report that their complete application landscape does
contains 80% or more Windows applications.
• Microsoft App-V still is the main application virtualization solution in virtual desktops and
applications with 31.44% in 2019 and 30.41% in 2020.
• ControlUp is the most popular solution to monitor the virtual desktop and application
environment, 13.01% of the respondents are using the solution which is an increase of
5.07% compared to 2019.
• A Unified Workspace portal will bring Windows, Web/SaaS applications and data together. A
workspace portal often is referenced as “Workspace aggregator”. Citrix Workspace is used
the most with 47.20% followed by VMware Workspace ONE with 14.91%. Also 23.60% of
the respondents are investigating different options.
• With the increment working more from home, all dual-display configurations combined
totals of 61.74% in 2020 an increase of 3.17% compared to 2019. Dual display at Full HD is
used the most with 45.97% in 2020.
• Dual display configurations are more popular than a single display configuration at 31.21%.
Dual display configuration surpassed a single display configuration in 2019. Ultrawide screen
entered the survey with 0.67% in 2020.
• Cloud first strategy for virtual desktops and applications is the main reason for DaaS
usage. 17,57% of the respondents in 2020 an increase of 3.94% compared to 2019.
• The four biggest challenges in adopting public cloud for Desktop as a Service (DaaS) are
cost/positive business case (29.89%), Legal and regulation (13.30%), trust (11.21%), and
performance (9.57%).
• 37.34% of the of respondents are designing, running a Proof of Concept, pilot or run their
Desktop as a Service solution in pre-production. 19.33% do use the solution in production
for 1 year or less. 14.66% of the respondents do use DaaS in production for 2+ years.
• The cloud strategy with regards to workload VMs for the majority of respondents is hybrid
with 56.76%. A single public cloud strategy is second with 35.81% and multiple public cloud
providers as strategy is being used by 7.43% of the respondents.
• The most important reason to use for Desktop as a Service is the ability to support
flexible/temporary workers with 16.49%.
• The majority do have a hybrid data storage Desktop as a Service solution. 56.85% of the
respondents do store data local / on-premises and use public cloud resources now or long
term.
• The Top 3 of most important Workspace initiatives for 2020/2021 are; (1) Desktop as a
Service, (2) Application Containers and (3) Microsoft Office 365.
#VDILIKEAPRO - End User Computing – State of the Union – 2020 6#VDILIKEAPRO - End User Computing – State of the Union – 2020
Introduction
Welcome to the “VDI Like a Pro” - End User Computing – State of the Union 2020 edition.
We believe the results presented in this report do provide valuable insights in trends real-world
deployments, configuration, and usage of end-user computing (EUC) solutions such as Virtual
Desktop and Applications – Virtual Desktop Infrastructure (VDI) and Desktop as a Service (DaaS) both
on-premises and public clouds. This document will also provide a great perspective on key end-user
computing trends for the forthcoming years, which will help you with planning and creating your
EUC roadmap.
Topics in the survey will cover Virtual Desktop Infrastructure (VDI), Desktop as a Service (DaaS),
public cloud, security, devices, single session and multi-session Operating Systems, storage,
hypervisors, GPUs, manageability, tools and the key EUC initiatives for 2021 and beyond.
The goal of the survey is to get a clear view on how the industry is changing and to support all
involved with valuable, independent, and unbiased research results based on actual and objective
customer data. 695 people supported the survey and, with support from the EUC community, the
results are freely available to everyone. This is truly a great achievement and community effort.
About VDI Like a Pro
Independent research organization VDI Like a PRO started the State of the Union Survey in 2013,
with the goal to provide an annual insider view of the End User Computing (EUC) market.
VDI Like a Pro (www.vdilikeapro.com) is an initiative by Ruben Spruijt, Sr. Technologist at Nutanix
and former CTO at Frame. Mark Plettenberg, Senior Product manager at Login VSI and Christiaan
Brinkhoff as Global Black Belt at Microsoft
With most of the questions repeated annually, the survey not only gathers data about the current
status of the industry but also discovers changes and trends. This year more than 695 respondents
participated in the survey, making this research initiative one of the largest on the EUC market
currently. The survey closed on 18/05/2020.
The results of the survey are reported in this whitepaper which is available to all at
www.vdilikeapro.com. The content from this survey will also be presented at leading industry and
community events such as Microsoft Ignite, VMWorld, ExpertsLive, Citrix Synergy, NVIDIA GTC,
E2EVC, Nutanix .NEXT and more.
If you want to share information from the survey or participate in the EUC community, feel free to
contact Christiaan, Mark or Ruben.
Made possible by: Login VSI
Login VSI (www.loginvsi.com) is the industry standard in synthetic load testing and active monitoring
for SBC/VDI and DaaS environments (infrastructure and applications). The software of Login VSI is
used by enterprises with centralized desktop environments and/or business-critical applications
running in VDI, and by all major IT vendors that offer infrastructure solutions for VDI. Login VSI has
paid for the use of the survey tool ($1200, per year).
#VDILIKEAPRO - End User Computing – State of the Union – 2020 7#VDILIKEAPRO - End User Computing – State of the Union – 2020
Teamwork
A community project cannot be successful without inspiring individuals and dynamic companies.
Here are some that made this possible:
● Jack Madden, for announcing the survey at BrianMadden.com
● Login Consultants & PQR for running earlier surveys as ProjectVRC
● Login VSI, Atlantis Computing and FRAME for running earlier surveys as TeamVRC
● The Login VSI marketing team for their support
● Login VSI and Nutanix for support of this year’s survey
● Many other community friends on LinkedIn and Twitter
Team and contact
All information about VDI Like a Pro can be found at www.vdilikeapro.com.
We try to provide accurate, concise, and practical information. We appreciate any feedback.
If you have any comments, corrections, or suggestions for improvements of this document, then we
want to hear from you!
Please send an email to Mark Plettenberg (m.plettenberg@loginvsi.com), Christiaan Brinkhoff
(mail@christiaanbrinkhoff.com) or Ruben Spruijt (ruben@rspruijt.com) and include in your message:
the title of the document, the version number, and the page that you refer to.
Leaderboard
The State of VDI survey is executed by:
Mark Plettenberg Ruben Spruijt Christiaan Brinkhoff
Sr. Product Manager Sr. Technologist Global Black Belt
Login VSI Nutanix Microsoft
@MarkPlettenberg @Rspruijt @Brinkhoff_C
#VDILIKEAPRO - End User Computing – State of the Union – 2020 8#VDILIKEAPRO - End User Computing – State of the Union – 2020
The change from VDI and SBC to virtual apps and desktops
In the 2019 state of the End User Computing union we used ‘Virtual Desktop Infrastructure – VDI’
and ‘Server Based Computing – SBC’ terminology. This year and moving forward we will use single
user and multiuser operating system. The main reason for this change is the development of
Desktop as a Service (DaaS) and the usage of different and new operating systems supporting single
user and multiuser sessions.
Also, it helps to create a better flow into the survey to address on-premises, public cloud and hybrid
scenarios of virtual applications and desktops. Important: when we compare 2020 survey results
with 2019 and earlier, we have combined the single user (VDI) and multi-user (SBC) results into a
single category called virtual applications and desktops.
Participant information
695 people supported the survey and on average, completed the survey in 10 minutes.
Participants from almost 50 different countries around the globe took part in the survey, with a
majority in North America. The response is measured based on client IP address.
Country
United States 23.74
Netherlands 17.99
Germany 11.65
United Kingdom 11.37
Switzerland 3.74
India 2.88
Italy 2.59 N=695
France 2.45
0 5 10 15 20 25
#VDILIKEAPRO - End User Computing – State of the Union – 2020 9#VDILIKEAPRO - End User Computing – State of the Union – 2020
North America has the largest response distribution and is the largest region by far. There is a
relatively high number of participants from the Netherlands (17.9%), likely because VDI Like a Pro
and their team members are well-connected with end-users, partners, and vendors in this region.
We could have said that the Dutch are leading the way in the EUC space with their high adoption
rate, awesome customer deployments, and the deeply engaged community consisting of leading
MVPs, CTPs, NTCs, and vExperts -- but that's just bragging about the Dutch and isn't based on survey
results.
#VDILIKEAPRO - End User Computing – State of the Union – 2020 10#VDILIKEAPRO - End User Computing – State of the Union – 2020
N=695
Who contributed to the state of the union?
Who are you? I am ...
Consultant 25.90
Focused on Sales and marketing 3.84
End-User 1.20
Independent 1.44
Manager (Project manager, IT executi ve) 11.75
Technical (Engineer, Administrator, Architect) 47.48
Working for a vendor 7.67
N=695
Other 0.72
0 5 10 15 20 25 30 35 40 45 50
#VDILIKEAPRO - End User Computing – State of the Union – 2020 11#VDILIKEAPRO - End User Computing – State of the Union – 2020
What is the most important business vertical to use your Virtual applications and
desktops environment?
With 15.35% Finance became the largest business vertical market for virtual desktops and
application solutions. Healthcare with 13.19% is 2nd and Government with 11.75% is 3rd largest
vertical. Usage of virtual desktops and applications in Finance, Government is increased in 2020
while Healthcare and education were declining a bit. Curious to see what 2021 will bring with more
organizations supporting work from home due to COVID-19.
What is the most important business vertical to use your End User Computing (Virtual
applications and Desktops) environment?
Automotive 2.16
Architecture, Engineering, Construction (AEC) 6.24
Chemical 0.48
Consultant (Working for various types of customers) 8.15
Defense/Military 2.16
Education 5.76
Energy 1.68
Financial (Finance) 15.35
Food and Beverage 0.96
Government 11.75
Healthcare 13.19
Housing 0.48
Insurance 2.88
Legal 1.68
Manufacturing 5.04
Media 0.72
Oil and Gas 0.48
Online 0.00
Real Estate 0.24
Religion 0.00
Retail 2.88
Technology (incl. IT services) 10.79
Telecommunications 1.44 N=695
Tr ansportation (Travel) 0.96
Not sure 2.16
Other (please specify) 2.40
0 2 4 6 8 10 12 14 16 18
N=695
#VDILIKEAPRO - End User Computing – State of the Union – 2020 12#VDILIKEAPRO - End User Computing – State of the Union – 2020
What is the total amount of users within your organization?
In 2019, the survey respondents working in an organization with 100,000+ users totaled 9.16%.
This year, the percentage totals 7.67%. While the percentage has declined, this does not necessarily
mean that their virtual desktop and application environments are the same size.
More information will be provided later in this document. While in 2019 organizations in size 1.000-
4.999 was the majority in 2020 organizations in size 5.000 to 24.999 became the majority using
virtual desktops and applications.
N=695
What is the total amount of users within your organization?
35.00
30.00
5.000 to 24.999
25.00
20.00
1.000 to 4.999
Title
1 to 249
15.00 250 to 999
10.00 25.000 to 99.000
100.000+
N=695
5.00
Not sure
0.00
2018 2019 2020
#VDILIKEAPRO - End User Computing – State of the Union – 2020 13#VDILIKEAPRO - End User Computing – State of the Union – 2020
Operating Systems
What type of operating systems are you using?
In 2020 51.09% of the respondents are using both a single user and multi-user operating system to
support their users with virtual applications and desktops. 26.17% is using a multi-user operating
system (with multiple users actively sharing the VM) while 22.74% is using a single-user operating
system.
Note from the authors; The Windows Server Operating system and Windows 10 can support both
single-user and multi-user scenarios. This is possible when the ‘Session Host’ role is enabled on
Windows Server or Windows 10 Enterprise Multi-Session as part of Microsoft WVD is being used.
What type of operating systems are you using?
Single-Session Operating
Systems (VM is dedicated
for active user)
Both Single and Multi-
Session Operating systems
Multi-Session Operating
N=695 Systems (VM is shared with
multiple active users)
#VDILIKEAPRO - End User Computing – State of the Union – 2020 14#VDILIKEAPRO - End User Computing – State of the Union – 2020
What single-Session operating systems are you using?
With 56.94% Windows 10 is used the most with versions 1803 and 1809 leading the usage.
Interestingly compared to the 2019 survey results the usage of Windows 10 is roughly the same.
Windows 7 usage continued the decline from past years with 11.83% still using Windows 7 as a
guest operating system in 2020. Interesting to see Windows Server being used much more
compared to 2019 with 25.04%.
We do expect this growth to be attached to the increase of Desktop as a Service where the use of
Windows Server OS is common to due Microsoft (Windows 10) licensing constraints in public clouds.
Usage of Linux as Guest OS for virtual desktops and applications is slowly increasing from 3.95% in
2019 to 5.6% in 2020.
N=695
N=695
#VDILIKEAPRO - End User Computing – State of the Union – 2020 15#VDILIKEAPRO - End User Computing – State of the Union – 2020
What multi-session operating systems are you using?
A multi-session operating system is often referred to as Remote Desktop Session (RDS), RD session
hosting, XenApp, Terminal Services, or even Server Based Computing.
A multi-session operating system continues to be a popular choice for delivering published desktops
or published applications into an organization. Windows 10 Enterprise multi-session as part of
Windows Virtual Desktops (WVD) is another example of an operating system to support virtual
desktops and applications.
N=695
With 37.25% Windows Server 2016 is used the most followed by Server 2019 with 20.24% and
Server 2012R2 still used by 18.22% of the respondents. Windows 10 EMS (Enterprise multi-session)
was introduced in 2019 and is used with 11.13% of the organizations. This number is high, and we
believe this is because many organizations are evaluating Desktop as a Service and the involvement
of the active DaaS/WVD community.
N=695
#VDILIKEAPRO - End User Computing – State of the Union – 2020 16#VDILIKEAPRO - End User Computing – State of the Union – 2020
What’s your perfect workload size for your single-user operating system (VM)?
We’ve done the math and it turns out the average single user operating system machine size for our
respondents is 3,4 CPU’s and 12,2GB of memory. In practice however we notice that especially the
numbers for memory are a lot lower. But there are certainly use cases that can benefit from these
specifications. Due to the large number of respondents on this question taking out the extremes e.g.
256GB of memory does not change the average outcome significantly.
N=695
What’s your perfect workload size for your multi-user operating system (VM)?
Naturally a multi-user operating system desires more resources the average outcome from all
respondents is 8,8 CPU’s and 63,3GB of memory. This is in line with what we see in practice.
N=695
#VDILIKEAPRO - End User Computing – State of the Union – 2020 17#VDILIKEAPRO - End User Computing – State of the Union – 2020
Use-cases, products usage, data locality, persistent/none-persistent
and more
What is the primary factor/use case to use Virtual Applications and Desktops?
Centralized management provide access as a Service (DaaS), and security are the primary reasons for
virtual applications and desktops adoption. Work from home or ‘flex working’ becoming an
increasingly important factor as well.
What is the primary factor/use case to use Virtual Applications and Desktops?
Central ize management 18.92
Cost reduction 8.73
Increase securi ty 13.46
Lower energy consumption 1.71
Provide Desktop as a Service and /or Remote application access 15.09
Security (for exampl e: S ecure browser) 4.89
Support dev elopers / Power users 4.98
Support flex working / Session roaming 12.07
Support Off-shoring / Remote locations / Branch offices 9.71
Support access to specific (legacy) applications 9.05
N=695
Not sure 0.41
Other (please specify) 0.98
0 2 4 6 8 10 12 14 16 18 20
What is the primary factor/use case to use Virtual Applications and Desktops?
40
35
Provide Desktop as a Service
Centralize management
and /or Remote application
30 access
25
Percentage
20
15
Increase security
10
N=695
5
Cost reduction
0
2013 2014 2015 2017 2018 2019 2020
#VDILIKEAPRO - End User Computing – State of the Union – 2020 18#VDILIKEAPRO - End User Computing – State of the Union – 2020
In what phase is your Virtual Applications and Desktops environment?
The following chart shows how rapidly the virtual applications and desktop environments are
changing.
Note: In previous years we differentiated the question between ‘VDI’ and ‘SBC’. Starting 2020 we
merged ‘VDI’ and ‘SBC’ into Virtual Applications and Desktops.
In what phase is your Virtual Applications and Desktops environment?
Production: 5 years and older 54.00
Production: 2-4 years 32.67
Production: Up to 1 year 6.00
Production: Mi grating to VDI on-premises 0.00
Production: Mi grating to (RemoteApp/VDI) public Cloud Serv ice 0.67
Migrati on / Rollout 2.67
Pilot / Pre-Production 1.33
Design / PoC 1.33
N=695
Not sure 1.33
0 10 20 30 40 50 60
#VDILIKEAPRO - End User Computing – State of the Union – 2020 19#VDILIKEAPRO - End User Computing – State of the Union – 2020
What is the maximum capacity of simultaneous / concurrent user sessions for your
Virtual Applications and Desktops environment?
There are more large-scale deployments of 100,000+ virtual desktop and application environments
in 2020 compared to 2019. 2.6% of the respondents in 2019 and 5.0% in 2020 are running such a
larger scale deployment. However, in medium-sized enterprises (5,000-24,999 users) we do see an
incline of usage of 15.7% in 2019 to 17.87% in 2020. Also, the usage within enterprises of 1,000-
4,999 simultaneous sessions there is an increase from 22.6% in 2019 to 26.0% in 2020.
At this moment, what is the maximum capacity of simultaneous / concurrent user
sessions for your Virtual Applications and Desktops environment?
100.000+ 5.02
25.000 to 99.000 7.21
5.000 to 24.999 17.87
1.000 to 4.999 26.02
250 to 999 20.06
1 to 249 19.44
N=695
Not sure 4.39
0 5 10 15 20 25 30
Note: In previous years we differentiated the question between ‘VDI’ and ‘SBC’. Starting 2020 we merged ‘VDI’
and ‘SBC’ into Virtual Applications and Desktops.
#VDILIKEAPRO - End User Computing – State of the Union – 2020 20#VDILIKEAPRO - End User Computing – State of the Union – 2020
Which virtual applications and desktop session broker solution is currently deployed
on-premises?
With virtual desktops and applications running on-premises it’s clear that Citrix is in the lead with
57% usage overall. VMware with 16% and Microsoft with 14% are 2nd and 3rd.
Note: In previous years we differentiated the question between ‘VDI’ and ‘SBC’.
Starting 2020 we merged ‘VDI’ and ‘SBC’ into Virtual Applications and Desktops.
Which virtual applications and desktop session broker solution is currently deployed on-
premises?
Citrix XenApp / XenDesktop 6.x or older 6.15
Citrix XenApp / XenDesktop 7.0 – 7.5 2.91
Citrix XenApp / XenDesktop 7.6 - 7.14 7.12
Citrix XenApp / XenDesktop 7.15, 7.16, 7.17, 7.18 or newer 22.98
Citrix Virtual Apps and Desktops 1808 - 1811 (Formerly XenApp) 5.83
Citrix Virtual Apps and Desktops 1906 - 1909 (Formerly XenApp) 11.65
Custom / Self-made Broker 0.00
Dell vWorkspace (EOL) 0.00
Microsoft RDS Windows 2008R2 1.29
Microsoft RDS Windows 2012R2 3.24
Microsoft RDS Windows 2016 6.47
Microsoft RDS Windows 2019 2.91
No broker: Using di rect connections 1.29
Parall els RAS 0.00
VMware Horizon View 6 0.97
VMware Horizon (View 7) 15.21
Workspot 0.32
N=695
Not sure 3.24
Other (please specify) 8.41
0 5 10 15 20 25
Note: In previous years we differentiated the question between ‘VDI’ and ‘SBC’. Starting 2020 we merged ‘VDI’
and ‘SBC’ into Virtual Applications and Desktops.
#VDILIKEAPRO - End User Computing – State of the Union – 2020 21#VDILIKEAPRO - End User Computing – State of the Union – 2020
Which virtual applications and desktop session broker solution is
currently deployed on-premises?
70.0
60.0
Citrix
50.0
Percentage
40.0 N=695
30.0
VMware
20.0
10.0
Microsoft
0.0
2013 2014 2015 2017 2018 2019 2020
#VDILIKEAPRO - End User Computing – State of the Union – 2020 22#VDILIKEAPRO - End User Computing – State of the Union – 2020
What percentage of the single-user virtual machines are shared
(pooled/stateless/non-persistent/personal?)
48.50% of the respondents are using virtual desktops and applications in a 80-100% stateless or
‘pooled’ fashion. While 12.02% of the respondents are using full personal or private instances of
virtual applications and desktops.
What percentage of the single-user virtual machines are shared (pooled/stateless/non-
persistent/personal?)
100% - All desktops are shared/pooled/stateless 22.32
80 – 99% of the desktops are shared/pooled/stateless 26.18
60 – 79% of the desktops are shared/pooled/stateless 15.45
40 – 59% of the desktops are shared/pooled/stateless 5.58
20 – 39% of the desktops are shared/pooled/stateless 7.30
1 – 19% of the desktops are shared/pooled/stateless 8.15
0% all desktops are personal / pri vate / stateful 12.02 N=695
Not sure 3.00
0 5 10 15 20 25 30
What percentage of the single-user virtual machines are shared (pooled/stateless/non-
persistent/personal?) 40- 99% of the desktops are
shared/pooled/stateless
50
45
40
100% - All desktops are
35 shared/pooled/stateless
30
Percentage
25
1- 39% of the desktops are
20 shared/pooled/stateless
15
10 N=695
5 0% all desktops are personal
/ private / stateful
0
2013 2014 2015 2017 2018 2019 2020
#VDILIKEAPRO - End User Computing – State of the Union – 2020 23#VDILIKEAPRO - End User Computing – State of the Union – 2020
Where are your workload machines, hosting your Virtual applications and desktops
located?
The majority of respondents in the 2020 survey are running their workload VMs to virtual desktops
and applications in a private cloud environment using on-premises or co-located datacenters.
29.25% is using both private and public clouds to while 11.95% is using public cloud to run the
workload Virtual Machines.
N=695
#VDILIKEAPRO - End User Computing – State of the Union – 2020 24#VDILIKEAPRO - End User Computing – State of the Union – 2020
Who is responsible for delivery/management of the EUC infrastructure service?
The ‘broker/control plane’ includes all the EUC infrastructure functionality such as broker, gateway,
orchestration, web interface etc. Most respondents of the 2020 survey, 55.35%, are running and
supporting the EUC infrastructure ‘broker’ as part of their own IT service while 30.5% is consuming
the control plane or broker as a service from e.g. Microsoft, Amazon, Citrix, Nutanix, VMware and
others.
N=695
#VDILIKEAPRO - End User Computing – State of the Union – 2020 25#VDILIKEAPRO - End User Computing – State of the Union – 2020
What are today's biggest challenges with your on-premises virtual applications and
desktops environment?
The biggest challenges with the on-premises virtual desktop and application environment are
migration to the cloud with 11.28%, increase capacity per physical server (Intel security fixes and
Windows 10 performance impact is likely reason here) with 10.68%. Also, user experience with
unified communications with 10.08% and overall cost reduction of the complete technology stack is
a challenge with 9.47% of the respondents.
What are today's biggest challenges with your on-premises virtual applications and
desktops environment? (Multiple choice, Max 3)
Increase desktop session density / capacity per physi cal server 10.68
Migrati on to the cloud 11.28
Technology stack is too compl ex 7.82
Overall cost reduction of the complete technology stack (including
9.47
clients, server and licenses)
Security 7.52
Compl ex licensing 6.17
Streamline management & user experience between hosted desktops
7.07
& regular desktops / laptops
Storage costs 2.56
User experience / performance in a WAN /High latency envi ronment 9.17
User experience / performance ri ch medi a; audio video and 2D/3D
graphics 8.72
User experience / performance with mobile and touch/tablet oriented
1.35
devices
User experience / performance with voice, webcam, VoIP &
10.08
conferencing solutions
(Vendor) support experience 3.16
N=695
Not sure 1.95
Other (please specify) 3.01
0 2 4 6 8 10 12
#VDILIKEAPRO - End User Computing – State of the Union – 2020 26#VDILIKEAPRO - End User Computing – State of the Union – 2020
Are you satisfied overall with the current Virtual applications and desktops solution?
A perfect virtual desktop and application solution is more common in 2020 with 10.90% an increase
of 6.68% compared to 2019. An environment which is performing well and delivering a good
experience is the reality 49.36% of the respondents an increase of 6.89% compared to 2019.
It’s great to see an overview increase in well designed, well performing environments with happy
end-users.
Are you satisfied overall with the current Virtual applications and desktops solution?
It’s really great; users
It’s not good; users and/or and/or IT drink champagne
Not sure
IT complain a lot It’s bad every day (sort of ?)
It’s OK; users and/or IT don’t
complain too much
Its good; users and/or IT are
N=695 happy
Are you satisfied overall with the current Virtual applications and desktops solution?
60
50 Its good; users and/or IT are
happy
40
It’s OK; users and/or IT don’t
Percentage
complain too much
30
20 It’s perfect; users and/or IT
N=695 drink champagne everyday
10
It’s not good; users and/or
IT complain a lot
0
2015 2017 2018 2019 2020
#VDILIKEAPRO - End User Computing – State of the Union – 2020 27#VDILIKEAPRO - End User Computing – State of the Union – 2020
Infrastructure: Hypervisor, Servers, Storage, GPUs and more
What hypervisor is currently deployed for you virtual Applications and Desktops?
VMware remains by far the largest hypervisor vendor delivering virtual infrastructure for virtual
desktops and applications, although the usage is slowly decreasing from 65.8% in 2014, 64% in 2015
and 2016, 61.4% in 2018, 56% in 2019 and 55% in 2020. Microsoft Hyper-V usage is slowly
decreasing from 13.18% in 2019 to 11% in 2020
While VMware and Microsoft hypervisor usage for virtual desktops and applications are decreasing,
Citrix and Nutanix adoption are increasing. Adoption of Nutanix is growing from 6.13% in 2018,
7.15% and 10% in 2020. Citrix Hypervisor usage increase from 17.87% in 2019 to 21% in 2020.
It’s important to mention that multiple hypervisors could be selected. Selecting your hypervisor is a
long-term commitment, organizations are updating their solutions but the migration to another
platform isn’t happening overnight
N=695
Note: In previous years we differentiated the question between ‘VDI’ and ‘SBC’. Starting 2020 we merged ‘VDI’
and ‘SBC’ into Virtual Applications and Desktops.
#VDILIKEAPRO - End User Computing – State of the Union – 2020 28#VDILIKEAPRO - End User Computing – State of the Union – 2020
What hypervisor is currently deployed for you virtual Applications and Desktops
70
60
VMware
50
Percentage
40
30
20 Citrix
N=695 Microsoft
10
Nutanix AHV
0
2 3 4 5 6 7
#VDILIKEAPRO - End User Computing – State of the Union – 2020 29#VDILIKEAPRO - End User Computing – State of the Union – 2020
Will you introduce or change to a different hypervisor for your Virtual applications
and Desktops workload?
This year 59.5% of participants stated they didn't have any plans to change their hypervisor while
7.53% is still investigating hypervisor options. 11.47% of the participants are seriously considering
Nutanix AHV. Nutanix and Public cloud IaaS are both areas of growth for virtual desktop and
application scenarios.
Note: In previous years we differentiated the question between ‘VDI’ and ‘SBC’.
Starting 2020 we merged ‘VDI’ and ‘SBC’ into Virtual Applications and Desktops.
Will you introduce or change to a different hypervisor for your Virtual applications and
Desktops workload?
No, there is no change planned 59.50
Maybe, still investigating Hypervisor options 7.53
Seriously considering Citrix XenServer 2.87
Seriously considering KVM 0.36
Seriously considering Microsoft Hyper-V 0.36
Seriously considering mi grating to a public cloud (IaaS) 7.89
Seriously considering Nutanix AHV 11.47
Seriously considering VMware 1.43
N=695
Not sure 6.09
Yes, to other (please speci fy) 2.51
0 10 20 30 40 50 60 70
#VDILIKEAPRO - End User Computing – State of the Union – 2020 30#VDILIKEAPRO - End User Computing – State of the Union – 2020
Which server hardware brand is used to host the Virtual applications and desktops
environment?
With 27.10%, DELL is the server vendor being used the most with VDI and SBC workloads, closely
followed by HPE with 25.70%. We see a gradual decrease for HPE—from 45% in 2014, 40% in 2015,
35% in 2017, 28.24% in 2018 and 25.70% in 2019.
Dell is slowly increasing its market share—from 23% in 2015, 25% in 2017, 26.11% in 2018, 27.10% in
2019 and 27.94% in 2020.
After a huge jump from 10.9% in 2014 to 15% in 2015, Cisco’s marketing share declined to 12% in
2017, increased to 17.4% in 2018 and declined to 14.49% in 2019 and 13.63% in 2020.
HPE adoption decreased from 40.25% in 2015, 35.8% in 2017, 28.24% in 2018, 25.70% in 2019 and
increase a bit to 27% in 2020.
Finally, Nutanix jumped from just 1.1% in 2014, 1.6% in 2015, 5.42% in 2017, 11.03% in 2018, 10.75%
in 2019 and 14% in 2020 becoming the 3rd largest platform to run virtual desktops and applications.
Which server hardware brand is used to host the Virtual
applications and desktops environment?
Cisco 13.63
Dell 27.94
Fujitsu 2.31
HDS 0.00
HPE 27.02
Huawei 0.92
IBM 3.70
Inspur 0.00
Lenovo 2.54
Nutanix 14.09
Oracle (Sun) 0.46
SuperMicro 3.00
N=695
Not sure 3.70
Other (please specify) 0.69
0 5 10 15 20 25 30
#VDILIKEAPRO - End User Computing – State of the Union – 2020 31#VDILIKEAPRO - End User Computing – State of the Union – 2020
Which server hardware brand is used to host the Virtual applications and desktops
environment?
50
45
40
35
Dell
30
Percentage
25
HPE
20
N=695 Nutanix
15
Cisco
10
5 IBM/Lenovo
0
2013 2014 2015 2017 2018 2019 2020
#VDILIKEAPRO - End User Computing – State of the Union – 2020 32#VDILIKEAPRO - End User Computing – State of the Union – 2020
Which storage technologies (not products) are used to host these desktops?
Central Storage technologies combined are being used in 45.97% of the virtual desktop and
application scenarios with SAN All Flash increasing. Hyper-converged infrastructure (HCI) and
Software-defined storage (SDS) usage is being used in 33.89% of the deployments in 2020 and
increased from 24.27% in 2018 and 31.87% in 2019.
It’s also interesting to see more people use the local HDD and Flash in 2019 compared to 2018 and
2017. We’re not sure why but it may be related to technology leveraging RAM and HDD in such
scenarios or building their own scale-out storage services (HCI/SDS).
Which storage technologies (not products) are used to host these desktops?
Central Storage Hybrid (SAN/NAS) using Flash / SSDs & Hard Disk s 24.41
Central Stor age (SAN/NAS) using Hard Disks only 5.92
Central Storage (SAN/NAS) using all Flash / NVME 15.64
Local Storage using al l Flash 11.14
Local Storage using Hard Disks 3.79
Hyperconverged Infrastructure - Software Defined Storage - All Flash
17.30
(SSD/NVMe)
Hyperconverged Infrastructure - Software Defined Storage - Hybrid
15.17
(SSD/NVMe/Flash/HDD)
Hyperconverged Infrastructure - Software Defined Storage - HDD 1.42
Not sure 4.27 N=695
Other (please specify) 0.95
0 5 10 15 20 25 30
Which storage technologies (not products) are used to host these desktops?
45
40
35
SDS/HCI
30
Percentage
25
SAN Hybrid
20
San Flash
15
Local Flash
10
N=695
San HDD only
5
Local HDD
0 0 0
2013 2014 2015 2017 2018 2019 2020
#VDILIKEAPRO - End User Computing – State of the Union – 2020 33#VDILIKEAPRO - End User Computing – State of the Union – 2020
Which storage product is used to host the virtual applications and desktops (on
premises)?
Traditional 3-tier storage vendors, such as NetApp, EMC, HPE, and IBM are all facing a strong decline
in the usage of their solutions in virtual desktop and application scenarios.
NetApp dropped from 28.5% in 2014, 17% in 2017, 13.71% in 2018, 13.16% in 2019 to 10.69% in
2020. EMC declined from 22.8% in 2014, 13.3% in 2017, 12.58% in 2018, 9.43% in 2019 and 9.27% in
2020. HPE declined from 18% in 2014, 10.6% in 2017, 7.87% in 2018 and 5.89% in 2019 and
increased to 9.27% in 2020
Pure storage adoption is increasing from 2.81% in 2017, 4.72% in 2018, 5.50% in 2019 and 6.85% in
2020. VMware VSAN increased from 6.97% in 2018, 9.82% in 2019 and 10.08% in 2020.
Nutanix usage increased from 10.81% in 2019 to 14.92% in 2020.
HCI solutions from Cisco and HPE/Simplivity combined are used in 5.24% of the deployments.
Market share of software-defined storage (SDS) and hyper-converged infrastructure (HCI) solutions
is growing rapidly, Nutanix and VMware are the leading with close to 25% adoption.
Which storage product is used to host the virtual applications and desktops (on
premises)?
Atlantis / Hive-IO 0.81
Cisco HyperFlex (Springpath) 2.42
Datacore 1.61
Dell 9.27
EMC 9.27
Fujitsu 0.60
Hitachi Data Systems (HDS) 1.61
HP 9.27
Huawei 1.01
IBM 2.02
Local storage 5.04
Microsoft storage spaces direct 1.21
NetApp 10.69
Nimble 3.23
Nutanix 14.92
Pure Storage 6.85
Sandisk (FusionIO) 0.20
HPe - Simplivity 2.82
Tintri 0.81
VMware vSAN 10.08 N=695
Not sure 4.03
Other, Please specify 2.22
0 2 4 6 8 10 12 14 16
#VDILIKEAPRO - End User Computing – State of the Union – 2020 34#VDILIKEAPRO - End User Computing – State of the Union – 2020
Which storage product is used to host the virtual applications and desktops (on
premises)?
30
25
20
Nutanix
Percentage
15
NetApp
VMware vSAN
10
EMC HP
Dell
Pure Storage
5
IBM
0
2014 2015 2017 2018 2019 2020
N=695
#VDILIKEAPRO - End User Computing – State of the Union – 2020 35#VDILIKEAPRO - End User Computing – State of the Union – 2020
Which GPUs do you use for your virtual applications and desktops?
The biggest GPU competitors isn’t AMD versus Intel versus NVIDIA—it’s the CPU (again). Many
organizations think the CPU can handle the graphics-related activities and therefore don’t use GPUs.
“No GPU” declined from 78% in 2014, 67% in 2016, 56% in 2017, 44.92% in 2018, 43.06% in 2019
and is at 35.41% in 2020.
Despite this feedback, we can see usage of GPUs (NVIDIA specifically) grew from 6% in 2014, 10% in
2015, 25% in 2017, 40.60% in 2018, 43.35% in 2019 and 55% in 2020 surpassing ‘No GPU’ this year!
A question we will ask in next year survey is the actual % usage of GPUs in virtual desktops and
application deployments. AMD is slowly entering the EUC space with promising EPYC CPUs and
Radeon GPUs, the AMD GPUs have entered the public cloud space with Azure NVv4 machines, but
on-premises AMD GPUs unfortunately aren’t used a lot.
Which GPUs do you use for your virtual applications and desktops (on premises)?
AMD Firepro 0.54
AMD Radeon/MxGPU 0.54
NVIDIA GRID K1/K2 7.84
NVIDIA TESLA M6/M10/M60 20.81
NVIDIA TESLA P4/P6/P10/P40/P100 9.73
NVIDIA TESLA T4 10.54
NVIDIA TESLA Volta (V100s/V100) 2.70
NVIDIA Quadro 3.78
Teradici PCoIP Server offload card 0.81
None, No GPUs or offl oading technology is being used 35.41
Not sure 6.76
N=695
Other 0.54
0 5 10 15 20 25 30 35 40
Which GPUs do you use for your virtual applications and desktops (on premises)?
100
90
80
70
60
Percentage
NVIDIA
50
40
No
30
20 N=695
10
AMD
0
2013 2014 2015 2017 2018 2019 2020
#VDILIKEAPRO - End User Computing – State of the Union – 2020 36#VDILIKEAPRO - End User Computing – State of the Union – 2020
Applications: Layering, imaging, updates, management, isolation,
antivirus, workspace portal and more
Do you currently use an application layering solution in virtual applications and
desktops?
While most respondents aren’t using layering solutions in virtual desktops and applications, 74.16%
in 2017, 66.59% in 2018, 60.13% in 2019, and 61.45% in 2020. Citrix is leading with 17.82%, followed
by VMware with 8.36. Liquidware FlexApp usage increased from 2.25% in 2019 to 4.72% in 2020.
Do you currently use an application layering solution in virtual applications and
desktops?
Yes, Liquidware Flexapp
Yes, VMware AppVolumes
Yes, Citrix Layering (former
Unidesk)
No
N=695
Do you currently use an application layering solution in virtual applications and
desktops?
80
70
60 No
50
Percentage
40
Yes, Citrix Layering (former
Unidesk)
30
20
N=695 Yes, VMware AppVolumes
10
Yes, Liquidware Flexapp
0
2017 2018 2019 2020
#VDILIKEAPRO - End User Computing – State of the Union – 2020 37#VDILIKEAPRO - End User Computing – State of the Union – 2020
How is the user environment managed?
The most popular choice for organizations is to use the FSLogix Profile Container product from
Microsoft this year, after the acquisition in 2018 – and the decision to make the product available for
almost everyone has been an important decision point.
The total usage of Microsoft FSLogix profile containers is 20.49%. Citrix user environment
management solutions is 16,23 % in 2020, VMware solutions is 7.21% and AppSense (Ivanti) declined
from 8.32% in 2019 to 7.54% in 2020 while RES Workspace Manager (Ivanti) declined from 8.87% in
2019 to 4.59% in 2020. Liquidware Profile Unity increased from 1.48% in 2019 to 2.30% in 2020. The
use of custom scripts declined from 8.23% in 2018, 7.76% in 2019, and 6.07% in 2020.
How is the user environment managed within virtual applications and desktops
environment? e.g. Security, Windows User profiles, Printer/drive mappings etc.
AppSense (Ivanti) 7.54
Citrix User Profile Manager 16.23
Citrix Workspace Environment Management (WEM) - former Norsk ale 14.10
Custom scr ipts 6.07
Microsoft (FSLogix) Profile Containers 20.49
Liquidware Labs ProfileUnity 2.30
Microsoft UE-V 2.46
Microsoft… 8.20
Nutanix (Fr ame) Enterprise Profil es (Profile disk) 2.95
RES Workspace Manager (Ivanti) 4.59
VMware User Environment Manager (UEM) 5.90
VMware View Per sona Management 1.31
Not sure 1.48 N=695
None / Fully persistent / Local profiles 4.92
Other (please specify) 1.48
0 5 10 15 20 25
How is the user environment managed within virtual applications and desktops
environment? e.g. Security, Windows User profiles, Printer/drive mappings etc.
35
30 Citrix
25
Percentage
20
Microsoft
15
AppSense (Ivanti)
10
Vmware
5 RES Workspace Manager
Liquidware Labs ProfileUnity
0
2014 2015 2017 2018 2019 2020
N=695
#VDILIKEAPRO - End User Computing – State of the Union – 2020 38You can also read