Range Resources Corporation Company Presentation - November 10, 2014

Page created by Roy Burton
 
CONTINUE READING
Range Resources Corporation Company Presentation - November 10, 2014
Range Resources Corporation
 Company Presentation
                              November 10, 2014

                                      1
Range Resources Corporation Company Presentation - November 10, 2014
Forward-Looking Statements
Certain statements and information in this presentation may constitute “forward-looking statements” within the meaning of the Private Securities Litigation Reform Act of
1995. The words “anticipate,” “believe,” “estimate,” “expect,” “forecast,” “plan,” “predict,” “target,” “project,” “could,” “should,” “would” or similar words are intended
to identify forward-looking statements, which are generally not historical in nature. Statements concerning well drilling and completion costs assume a development
mode of operation; additionally, estimates of future capital expenditures, production volumes, reserve volumes, reserve values, resource potential, resource potential
including future ethane extraction, number of development and exploration projects, finding costs, operating costs, overhead costs, cash flow, NPV10, EUR and earnings
are forward-looking statements. Our forward looking statements, including those listed in the previous sentence are based on our assumptions concerning a number of
unknown future factors including commodity prices, recompletion and drilling results, lease operating expenses, administrative expenses, interest expense, financing
costs, and other costs and estimates we believe are reasonable based on information currently available to us; however, our assumptions and the Company’s future
performance are both subject to a wide range of risks including, production variance from expectations, the volatility of oil and gas prices, the results of our hedging
transactions, the need to develop and replace reserves, the costs and results of drilling and operations, the substantial capital expenditures required to fund operations,
exploration risks, competition, our ability to implement our business strategy, the timing of production, mechanical and other inherent risks associated with oil and gas
production, weather, the availability of drilling equipment, changes in interest rates, access to capital, litigation, uncertainties about reserve estimates, environmental
risks and regulatory changes, and there is no assurance that our projected results, goals and financial projections can or will be met. This presentation includes certain
non-GAAP financial measures. Reconciliation and calculation schedules for the non-GAAP financial measures can be found on our website at www.rangeresources.com.

The SEC permits oil and gas companies, in filings made with the SEC, to disclose proved reserves, which are estimates that geological and engineering data demonstrate
with reasonable certainty to be recoverable in future years from known reservoirs under existing economic and operating conditions as well as the option to disclose
probable and possible reserves. Range has elected not to disclose the Company’s probable and possible reserves in its filings with the SEC. Range uses certain
broader terms such as "resource potential," or "unproved resource potential,” "upside" and “EURs per well” or other descriptions of volumes of resources potentially
recoverable through additional drilling or recovery techniques that may include probable and possible reserves as defined by the SEC's guidelines. Range has not
attempted to distinguish probable and possible reserves from these broader classifications. The SEC’s rules prohibit us from including in filings with the SEC these
broader classifications of reserves. These estimates are by their nature more speculative than estimates of proved, probable and possible reserves and accordingly are
subject to substantially greater risk of being actually realized. Unproved resource potential refers to Range's internal estimates of hydrocarbon quantities that may be
potentially discovered through exploratory drilling or recovered with additional drilling or recovery techniques and have not been reviewed by independent engineers.
Unproved resource potential does not constitute reserves within the meaning of the Society of Petroleum Engineer's Petroleum Resource Management System and does
not include proved reserves. Area wide unproven, unrisked resource potential has not been fully risked by Range's management. “EUR,” or estimated ultimate recovery,
refers to our management’s estimates of hydrocarbon quantities that may be recovered from a well completed as a producer in the area. These quantities may not
necessarily constitute or represent reserves within the meaning of the Society of Petroleum Engineer’s Petroleum Resource Management System or the SEC’s oil and
natural gas disclosure rules. Actual quantities that may be recovered from Range's interests could differ substantially. Factors affecting recovery include the scope of
Range's drilling program, which will be directly affected by the availability of capital, drilling and production costs, commodity prices, availability of drilling services and
equipment, drilling results, lease expirations, transportation constraints, regulatory approvals, field spacing rules, recoveries of gas in place, length of horizontal laterals,
actual drilling results, including geological and mechanical factors affecting recovery rates and other factors. Estimates of resource potential may change significantly
as development of our resource plays provides additional data. In addition, our production forecasts and expectations for future periods are dependent upon many
assumptions, including estimates of production decline rates from existing wells and the undertaking and outcome of future drilling activity, which may be affected by
significant commodity price declines or drilling cost increases.

Readers are cautioned not to place undue reliance on forward-looking statements, which speak only as of the date hereof. We undertake no obligation to publicly update
or revise any forward-looking statements after the date they are made, whether as a result of new information, future events or otherwise. Investors are urged to consider
closely the disclosure in our most recent Annual Report on Form 10-K, available from our website at www.rangeresources.com or by written request to 100 Throckmorton
Street, Suite 1200, Fort Worth, Texas 76102. You can also obtain the Form 10-K by calling the SEC at 1-800-SEC-0330.

                                                                                                                                                                       2            2
Range Resources Corporation Company Presentation - November 10, 2014
Range is a Simple Story

1. Owns largest acreage position in core of Marcellus with
   additional stacked pay horizons

2. Wells, gathering, processing and markets planned or
   contracted to grow to 3 Bcfe per day and beyond

3. 20% to 25% planned production growth for many years,
   resulting in cash flow positive by 2016 under current
   strip prices

4. Balance sheet and liquidity support the planned growth

5. Team in place to execute this plan with our proven track
   record

                                                         3    3
Range Resources Corporation Company Presentation - November 10, 2014
Near-term Catalysts

1. Unit costs expected to continue to decline
2. Utica well test to potentially add another growth
   opportunity
3. Continuing significant reserve growth
4. Uplift in cash flow in 2015 with Mariner East NGL exports
     • Propane – year end 2014
     • Ethane – mid-2015
5. Improved capital efficiencies with drilling longer laterals
   and more wells on existing pads
6. Land expenditures as percent of budget reduced in 2017,
   increasing the drilling budget

                                                           4     4
Range Resources Corporation Company Presentation - November 10, 2014
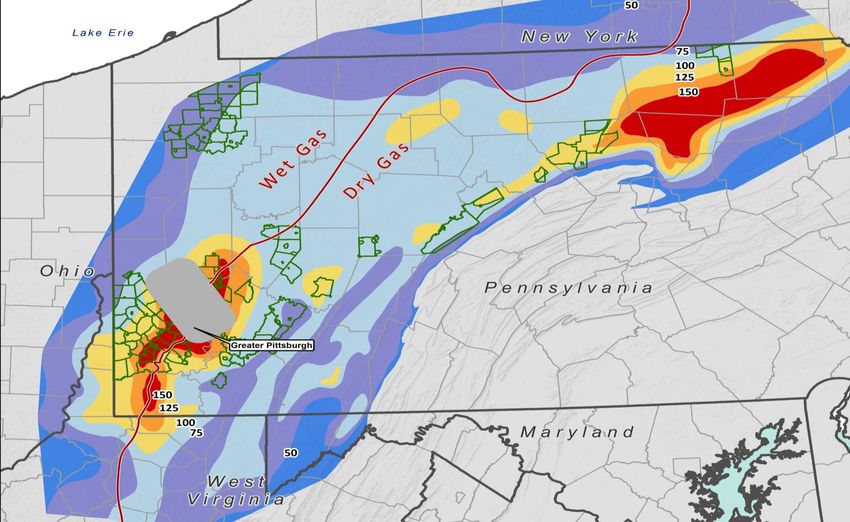
Range Resources Strategy
                                                                                                 Marcellus Shale
                                                                                               ~1 million net acres
                                                                                         41 to 51 Tcfe resource potential
   Proven track record of performance                                                         Upper Devonian Shale
                                                                                         12 to 18 Tcfe resource potential

 Focus on PER SHARE                                                               Utica/Point Pleasant Shale
                                                                                            pending
  GROWTH of production
  and reserves at top-quartile
  or better cost structure
  while high grading                                  Midcontinent
                                                  ~360,000 net acres
  the inventory            Mississippian, St. Louis, Granite Wash, Cleveland and Woodford
                                                       7 to 11 Tcfe resource potential

 Maintain simple, strong
  financial position

 Operate safely and be                                                                                   Southern Appalachia
                                                                                                            ~475,000 net acres
  a good steward of the                                                                            Huron Shale, Berea, Big Lime, CBM
                                                                                                      5 to 6 Tcfe resource potential
  environment

                                                           Total Resource Potential
                                               65 to 86 Tcfe without Utica/Point Pleasant Shale

                                                                                                                            5     5
Range Resources Corporation Company Presentation - November 10, 2014
Range’s Planned Growth to 3 Bcfe Per Day

 20%-25% growth for many years

 Wells identified, infrastructure planned with the contracted
  takeaway capacity to profitably grow production to 3 Bcfe/d

 Assuming current strip pricing, Range is projected to be cash
  flow positive in 2016

 Significant growth planned in 2016 and beyond, when gas
  demand is projected to grow from LNG exports, petrochemical,
  power generation, manufacturing and transportation

 Unit costs are projected to continue decreasing as production
  grows

 Range’s well results are projected to improve as longer laterals
  improved completion technology and more frac stages are
  incorporated

                                                                 6   6
Range Resources Corporation Company Presentation - November 10, 2014
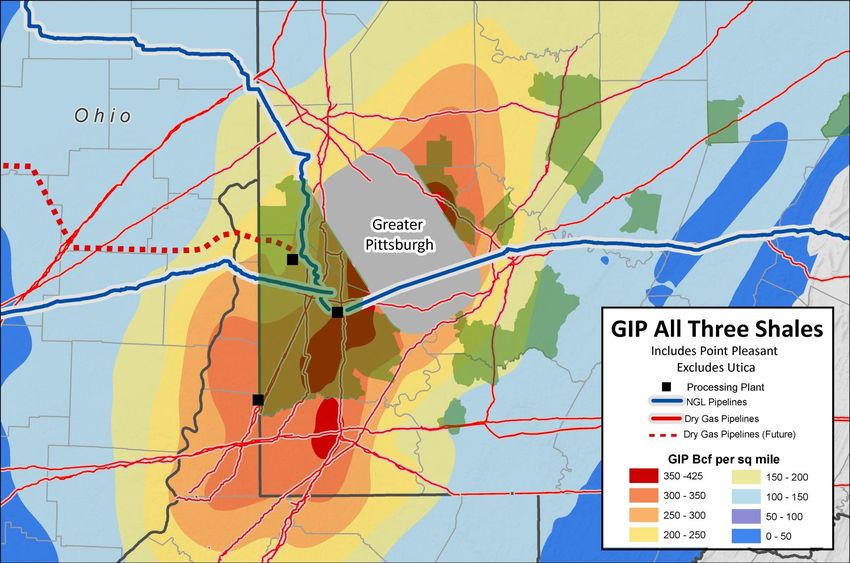
20% - 25% Growth Trajectory
              3,000
                      Growth trajectory to 3 Bcfe net per day:                           Corporate
                                                                                     production at 25%
                                                                                        growth rate
              2,500     • Wells identified
                        • Compression and processing plants
                          scheduled
              2,000     • Required takeaway capacity contracted
Mmcfe/d Net

                                                                                                     Corporate
                                                                                                 production at 20%
                                                                                                    growth rate
              1,500

              1,000

               500

                  -

                                                     Note: Includes impact of historical acquisitions and asset sales

                                                                                                              7         7
Range Resources Corporation Company Presentation - November 10, 2014
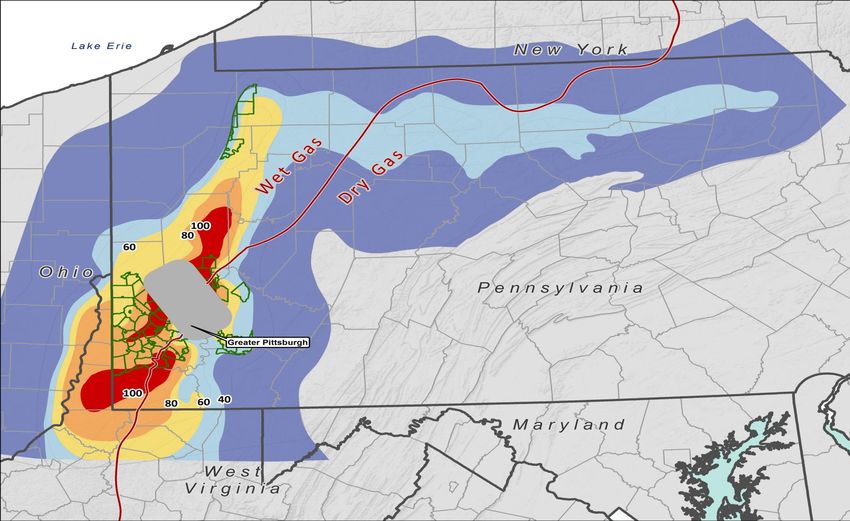
Range is Focused on Per Share Growth, on a Debt-Adjusted Basis

             Production/share – debt adjusted                                    Reserves/share – debt adjusted

             2.0                                                            50

                                                                            45
             1.8
Mcfe/share

                                                                            40

                                                               Mcfe/share
             1.6
                                                                            35
             1.4
                                                                            30
             1.2
                                                                            25
             1.0
                                                                            20
             0.8
                                                                            15

             0.6
                                                                            10

             0.4                                                             5
                   2008     2009   2010   2011   2012   2013                      2008     2009   2010   2011   2012   2013

                          2013 Increase of 26%                                           2013 Increase of 25%

              Production/share = annual production divided by debt-adjusted year-end diluted shares
               outstanding

              Reserves/share = year-end proven reserves divided by debt-adjusted year-end diluted shares
               outstanding

                                                                                                                        8     8
Range Resources Corporation Company Presentation - November 10, 2014
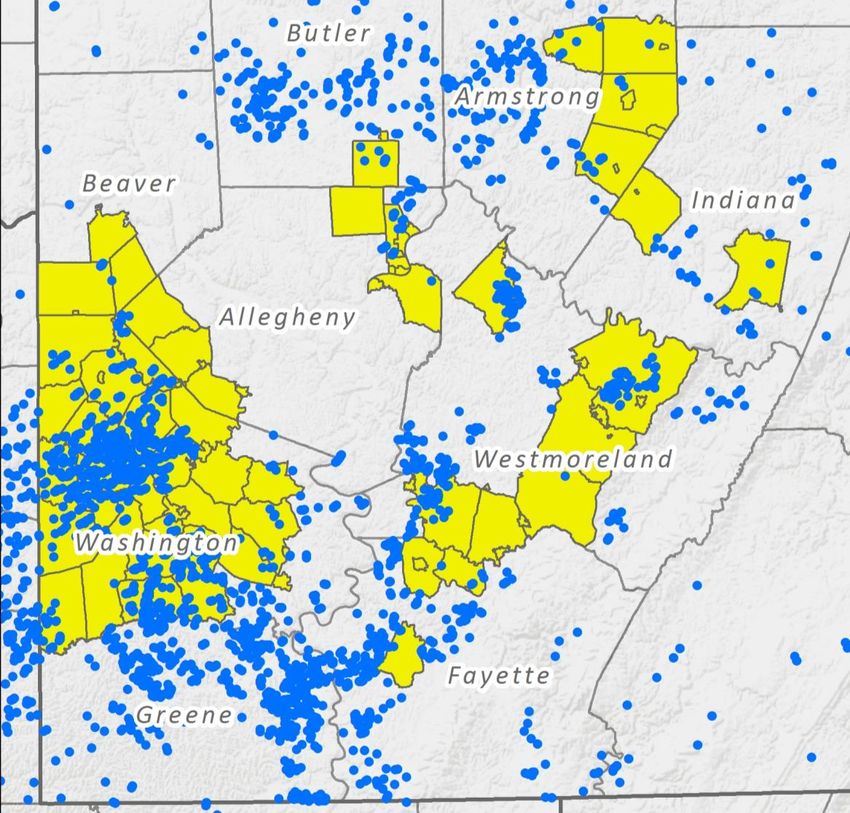
Unit Costs Are a Key Focus
             $4.50

             $4.00

             $3.50
    $/mcfe

             $3.00

             $2.50

             $2.00

             $1.50

             $1.00

             $0.50

               $-$0.00
                         2008                 2009                  2010                 2011                 2012                 2013                2014E
 Reserve
                         $1.64                $1.25                 $0.83                $0.68                $0.68               $0.66                $0.63
 Replacement(1)
 LOE (2)                 $0.99                $0.82                 $0.72                 $0.60               $0.41               $0.37                $0.34
 Prod. taxes             $0.39                $0.20                 $0.19                 $0.14               $0.15(3)            $0.13                $0.12
 G&A (2)                 $0.49                $0.51                 $0.55                 $0.56               $0.46               $0.42                $0.37
 Interest                $0.71                $0.74                 $0.73                 $0.69               $0.61               $0.51                $0.41
 Trans. &
                         $0.08                $0.32                 $0.40                 $0.62               $0.70                $0.75               $0.77
 Gathering
        Total            $4.30                $3.84                 $3.42                 $3.29               $3.01                $2.84               $2.64

(1) Three-year average of drill bit F&D costs, excluding acreage (2) Excludes non-cash stock compensation (3) Excludes retroactive payments for PA impact fee in 2012.

                                                                                                                                                          9         9
Range Resources Corporation Company Presentation - November 10, 2014
Financial Position
 Strong, Simple Balance Sheet
  – Bank debt, subordinated notes and common stock
  – No debt maturity until 2019 (bank) and 2020 (notes)
  – Available liquidity of $1.2 billion under commitment amount
 Well Structured Bank Credit Facility
  – 29 banks with no bank holding more than 6% of total
  – Current borrowing base of $3.0 billion; commitment amount of $2.0 billion
 Improving Debt Metrics
  – Debt to Cap ratio reduced from 57% at YE 2013 to 49% at September 30
  – Debt to EBITDAX reduced from 2.8x at March 31 to 2.5x at September 30
  – Recent upgrades from Moody’s (Ba1 – Positive Outlook) and S&P (BB+)
 Solid Hedge Position
  – Range typically hedges a significant portion of projected upcoming 12 months of
    production
  – For 2014, over 80% of projected production is hedged
  – For 2015, over 40% of projected production is hedged
  – Hedging for 2016 has started

                                                                                10   10
Moved 6.4 Tcfe of Resource Potential into Proved
 Reserves in the Last Four Years

              Tcfe                    YE 2009                 YE 2010                YE 2011                YE 2012                YE 2013

      Proved                             3.1                   4.4(1)                    5.1                   6.5                     8.2
      Reserves

      Resource                        24 - 32                 35 - 52                44 - 60             48 – 68(3) 65 – 86(4)
      Potential (2)

                   Proved reserves have increased by 28% per year on a
                               compounded basis since 2009
(1)   Proforma 3.5 Tcfe after Barnett sale
(2)   Net unproved resource potential
(3)   Added 12 – 15 Tcfe resource potential for tighter spaced drilling in the wet and super-rich Marcellus to YE 2012 resource potential at mid-year 2013
(4)   Includes the effect of the property exchange with EQT, effective June 16, 2014

                                                                                                                                                 11          11
~1 Million Net Acres Prospective for Shales in PA

                                                       Northwest
                                                   305,000 net acres(1)
                                                   (Legacy acreage is largely
                                                  held by shallow production)

                                                                                                                        Northeast
                                                                                                                    120,000 net acres
                                                                                                                   (One rig is projected to
                                                                                                                     hold all blocked up
                                                                                                                  acreage being targeted for
                                                                                                                        development)

                                                                   Southwest
                                                               530,000 net acres(2)
                                                      (95% of acreage is HBP or projected to
                                                       be drilled under existing lease terms)

Note: Townships where Range holds ~3,000+ acres are shown in yellow (As of 12/31/2013)
(1) Approximately 140,000 acres prospective for Marcellus; ~175,000 acres prospective for wet Utica/Point Pleasant. (2) Extends partially into WV.

                                                                                                                                            12
Pennsylvania Stacked Pays – Net Acreage

                                            Wet              Dry          Total
                                          Acreage          Acreage       Acreage

                      Upper Devonian       330,000         230,000         560,000

                       Marcellus           470,000         320,000         790,000

                      Utica/Point
                         Pleasant          175,000         400,000         575,000

                                           975,000         950,000       1,925,000

 Stacked pays allow for multiple development opportunities at 1,000 foot spacing
   between wells and later with 500 foot spacing prospective on most acreage

                                                                             13      13
Gas In Place (GIP) – Marcellus Shale

                                                                         • GIP is a function of pressure,
                                                                           temperature, thermal maturity,
                                                                           porosity, hydrocarbon
                                                                           saturation and net thickness

                                                                         • Two core areas have been
                                                                           developed in the Marcellus

                                                                         • Condensate and NGLs are in
                                                                           gaseous form in the reservoir

Note: Townships where Range holds ~3,000 or more acres (as of 12/31/2013), and estimated as prospective, are outlined green. GIP – Range estimates.

                                                                                                                                          14
Gas In Place (GIP) – Upper Devonian Shale

                                                                     • The greatest GIP in the Upper
                                                                       Devonian is found in SW PA

                                                                     • A significant portion of the GIP
                                                                       in the Upper Devonian is located
                                                                       in the wet gas window

Note: Townships where Range holds ~3,000 or more acres (as of 12/31/2013), and estimated as prospective, are outlined green. GIP – Range estimates.

                                                                                                                                          15
Gas In Place (GIP) – Point Pleasant

                                                                     Outlined portion
                                                                  represents the area of
                                                                   the highest pressure
                                                                  gradients in the Point
                                                                         Pleasant

Note: Townships where Range holds ~3,000 or more acres (as of 12/31/2013), and estimated as prospective, are outlined green. GIP – Range estimates.

                                                                                                                                          16
Gas In Place (GIP) Analysis Shows Greatest Potential in SW PA

                                                                      When GIP analysis from the Marcellus,
                                                                      Upper Devonian and Point Pleasant are
                                                                        combined, the largest stacked pay
                                                                    resource is located in SW PA where Range
                                                                       has concentrated its acreage position

Note: Townships where Range holds ~3,000 or more acres (as of 12/31/2013), and estimated as prospective, are outlined green. GIP – Range estimates.

                                                                                                                                          17
Range Acreage Strategically Located Near Highest GIP & Infrastructure

                   Note: Townships where Range holds ~3,000 or more acres (as of 12/31/2013), and estimated
                   as prospective, are shown green. GIP – Range estimates.
                                                                                                              18
Southwest PA – Range’s 530,000 Net Acres
                                                                                                 Approximately 2,900
                                                                                                  industry wells (2,300
                                                                                                  horizontal & 600 vertical)
                                                                                                  have defined the
                                                                                                  productive boundaries
                                                                                                  of the Marcellus

                                                                                                 Range’s acreage is
                                                                                                  highly prospective for
                                                                                                  Marcellus, with low
                                                                                                  reinvestment risk and
                                                                                                  high rates of return

                                                                                                 Up to nine years of
                                                                                                  production history from
                                                                                                  this area

Note: Townships where Range holds ~3,000 or more acres are shown in yellow (As of 12/31/2013)

                                                                                                                     19    19
Southwest PA – Large Upside Potential

                Small Percentage of Acreage Drilled

     ▪ Prospective acreage                            530,000

     ▪ Assumed spacing                                ~80 acres

     ▪ Potential Marcellus Shale locations              6,625

     ▪ Producing horizontal wells                       ~605

     ▪ Drilled wells divided by potential locations     ~9%

            ~778 Mmcfe/d net being produced from ~9%
                   of Range’s acreage in SW PA

                                                                  20   20
Southwest PA – Development Mode Economic Summary

   Targeting Average Lateral Length in 2015 to be over 6,200 feet

                            Super-Rich                  Wet               Dry

                        2.05 Mmboe (12.3 Bcfe)        12.3 Bcfe
 EUR                     1,172 Mbbls & 5.3 Bcf    978 Mbbls & 6.4 Bcf
                                                                        13.4 Bcf

                             0.40 Mmboe
 EUR/1,000 ft lateral     (2.4 Bcfe equivalent)
                                                      2.93 Bcfe         2.58 Bcf

                              78.8 Mboe
 EUR/stage              (473 Mmcfe equivalent)
                                                     586 Mmcfe          515 Mmcf

 Well Cost                     $6.8 MM                 $6.1 MM          $6.6 MM

 Stages                            26                     21               26

 Lateral Length                 5,300 ft               4,200 ft         5,200 ft

 IRR – Strip                     118%                   121%             104%

 IRR – $4.00                     104%                   106%              85%

                                                                                   21   21
Appalachia Gas Transportation Arrangements
                                                Projected 2014                        Projected 2016                         Projected 2018
                                        Mmbtu/day Transport Cost Mmbtu/day Transport Cost Mmbtu/day Transport Cost
      Regional Direction
                                         (Gross)    per Mmbtu     (Gross)    per Mmbtu     (Gross)    per Mmbtu
Firm Transportation
   Appalachia/Local                        325,000             $ 0.21            330,000             $ 0.22            430,000         $ 0.30
   Gulf Coast                              260,000             $ 0.31            485,000             $ 0.43            935,000         $ 0.51
   Midwest/Canada                           70,000             $ 0.20            270,000             $ 0.26            470,000         $ 0.41
   Northeast                               185,000             $ 0.60            185,000             $ 0.60            185,000         $ 0.60
   Southeast                               100,000             $ 0.39            100,000             $ 0.39            100,000         $ 0.39

Firm Sales/Released Capacity               175,000                --             380,000                --             270,000              --

Total Take-Away Capacity                  1,115,000            $ 0.28           1,750,000            $ 0.28           2,390,000        $ 0.39

             Capacity listed above reflects actual amounts of production that can flow
              under these arrangements. We believe these firm arrangements provide
                  adequate capacity to meet our growth projections through 2018

   Range net production would be approximately 83% of the gross amounts shown. Does not include current intermediary pipeline
   capacity of >800,000 Mmbtu/day, and assumes full utilization. Cost associated with Firm Sales/Released Capacity is assumed as
   a deduction to price. Based on anticipated project start dates.

                                                                                                                                       22        22
Natural Gas Transportation Arrangements
                  2,500,000               Range’s Firm Transportation Strategy:
                                                                                                                Firm Sales/Released
                                     • Add firm transport to good markets at a reasonable cost                  Capacity
                                     • Time transportation commitments with expected production
                                     • Utilize firm sales and released capacity from industry
                                                                                                                Southeast
                  2,000,000            participants

                                                                                                                Northeast
Mmbtu/d (Gross)

                  1,500,000
                                                                                                                Anticipated Canada

                                                                                                                Midwest/Canada
                  1,000,000

                                                                                                                Gulf Coast

                   500,000
                                                                                                                Appalachia/Local

                         -
                              2014                    2015                   2016                 2017   2018
                                                                Year End
                  Does not include current intermediary pipeline capacity of >800,000 Mmbtu/day

                                                                                                                       23
Appalachia Supply & Demand

         • LNG exports starting in late 2015
         • Appears to have sufficient takeaway
           capacity by 2016

           Appalachia Consumption   Regional Storage Injections       Announced Takeaway Additions          Appalachia Production

                                                                     2013        2014          2015        2016         2017        2018
     Appalachia Production                                            11.2        15.5          17.8       19.9          23.4       24.7
     Appalachia Consumption + Injections                             13.4         14.6          14.2       14.6          15.0       15.2
 A   Appalachia Gas Surplus for Export                               (2.2)           0.9             3.6     5.3            8.4      9.5
 B   Cumulative Takeaway Additions at year end                                       3.4             8.6   14.8          25.7       33.7
     Excess Takeaway (B – A)                                                         2.5             5.0     9.5         17.3       24.2

                                                        Source: Analyst estimates
                                                                                                                                      24
2014 Diversified Portfolio by Major Indices
                                                                                   3Q 2014 Corporate Differential
  Estimated Appalachia Gas Sales Portfolio By                                            to NYMEX: ($0.49)
             Major Indices - 2014
                                                                                  Calculated 4Q 2014 and 1Q 2015
                           Southeast
                                                                                       Corporate Differential to
                                                                                     NYMEX: ($0.58)* and ($0.31)*
                                                                                    respectively, based on current
Northeast                Transco Z5 Non-WGL                                               future indications
                                 8%
           Transco NNY
               10%                            CGT
                                              9%
    TETCO M3                                              TGP 500L                      Gulf Coast
       8%                                                   14%

                                                                             TGP 200L
                                                                     Nymex     3%
TETCO M2        TCO                                                   11%
2018 Diversified Portfolio by Major Indices

       Estimated Appalachia Gas Sales Portfolio By
                  Major Indices - 2018
                                                                                          ~70% of Range’s gas
                              Southeast                                                   volumes are expected
                                                                                            to be priced off of
        Northeast                                                                           indices outside of
                                      Transco Z5 Non-
                            FGT Zone 2     WGL                                             Appalachia by 2018
                 Transco NNY   1%           4%      CGT - Mainline
                     4%
                                                         6%      CGT - Onshore
              TETCO M3
         Nymex   5%                                                   9%
          2%
                                                                            TETCO ELA
      TETCO M2                                                                   7%
Innovative Gas and NGL Marketing

          2016 Firm transportation volumes shown above exclude 380,000 Mmbtu/d of firm sales/released capacity

                                                                                                         27
                                                                                                                 27
Range NGL’s- Now a Global Market
                              As the largest producer of NGL’s in
                               Appalachia, Range will continue to
                               see high interest from international
                               customers

                              Shipments of ethane from Marcus
                               Hook to Norway begin in second half
                               of 2015. Range’s portfolio of ethane
                               solutions result in >25% increase in
                               ethane revenue, versus leaving
                               ethane in the gas, net of all costs

                              Shipments of propane to South
                               America have been ongoing for the
                               past 3 summers. With high demand
                               in winter months, most propane is
                               expected to be sold locally

                              Propane netbacks will increase by
                               $0.20 per gallon when Mariner East
                               pipeline from SW PA to Marcus Hook
                               is completed in early 2015

                              Other NGL’s are expected to be
                               shipped from Marcus Hook

                                                           28         28
Additional Upside – Point Pleasant
                                                                                    Nearby industry activity is
                                                                                   approaching our SW PA Point
                                                                                        Pleasant acreage

                                                                                    400,000 net acres in SW PA
                                                                RRC Claysville
                                                                Sportsman’s Club
                                                                                    Range 2014 Point Pleasant
                                                                                     test positioned in area of
                                                                                     highest projected IP’s per
                                                                                     stage

                                                                                    Recently set pipe on the
                                                                                     Point Pleasant test in
                                                                                     Washington County,
                                                                                     Sportsman’s Club #1,
                                                                                     anticipating results by late
Note: Townships where Range holds ~3,000 or more acres are shown outlined
above (As of 12/31/2013)
                                                                                     December 2014
            Marcellus Drilling Holds All Depths

                                                                                                             29     29
Additional Upside – Upper Devonian
                            560,000 Net Acres Prospective for Upper Devonian

                                                                                                Hydrocarbon in place and
      Super-Rich                                        Wet Gas
                                                                                                 thermal maturity of SW PA
     110,000 acres                                    220,000 acres                              Upper Devonian similar to
                                                                                                 Marcellus

                                                                                                Able to utilize existing
                                                                                                 Marcellus infrastructure
                                                                                                 thereby improving economics

                                                                                                Completion method and
                                                                                                 landing significantly
                                                                                                 improved results from the
                                                                                                 first test

                                                                                                Latest well – 24 hour test rate
                                                                                                  10.0 Mmcfe/d with ethane
                                                                                                  recovery composed of:
                                                                Dry Gas                             4.0 Mmcf/d gas
                                                              200,000 acres                         172 bbls condensate
                                                                                                    826 bbls NGLs
• Previously drilled well     Note: Townships where Range holds ~3,000+ acres are shown in
                              yellow (As of 12/31/2013)

                                                                                                                         30   30
Nora Area – Strategic Marketing Advantages
                                      Nora is strategically
                                       positioned to provide
 Nora
                                       gas to southeast
                                       markets

                                      3.0 Bcf/d of new demand
                                       in VA, NC, SC, TN, GA,
                                       AL with 1 Bcf/d of new
                                       demand in Virginia
                                       alone

                                      Contracts in place for
                                       110 Mmcf/d at
                                       $0.20/mbtu above
                                       NYMEX for the next 18
                                       months

                                      ~50 Mmcf/d of existing
                                       unused transport
                                       capacity to allow for
                                       planned production
                                       growth

                                                      31
Midcontinent Division Highlights

   360,000 net acres

   Currently drilling Mississippian Chat and St. Louis

   Results are encouraging, as the last two quarters had the two
    highest average 24-hour IP rates achieved to date.

   3rd Quarter Mississippian wells averaged 24 hour IP’s of 661 boe
    per day, with 72% liquids

   Mississippian wells have an expected rate of return of 71% and
    St. Louis wells have an expected rate of return of 90%, based on
    6/30/14 strip pricing

   Horizontal Granite Wash, Cleveland and Woodford potential on
    existing HBP acreage

                                                                32     32
Horizontal Mississippi Chat wells concentrated along Nemaha Ridge

                                                                                      Range has ~160,000 net
                                                                                       acres largely blocked up
                                                                                       for economy of scale

                                                                                      Development
                                                                                       concentrated in Kay and
                                                                                       Noble counties

                                                                                      Expected rate of return
                                                                                       is 71% with cost of $3.4
                                                                                       million and EUR of 485
                                                                                       Mboe (6/30/14 strip pricing)

                                                                                      Firm transport provided
                                                                                       in connection with
                                                                                       processing agreements

  Producing Horizontal Mississippian wells   Wells to be drilled, second half 2014

                                                                                                            33        33
New Markets Increasing Demand for Natural Gas
             Demand for natural gas could increase up to 20 Bcf per day by 2018(2)
       Power Generation Sector
         Utilities using more gas versus coal, by 2035 natural gas will surpass coal as leading electricity source (1)
         Estimates say that natural gas fired power plants will supply 46% of all new power plant additions through
          2035- compared to 37% for renewables, 12% for coal and 3% for nuclear (1)

       Manufacturing/Petrochemical
           Due to the large price difference in naptha (oil-based) versus ethane (gas-based), U.S. international
            petrochemical companies are converting their feedstocks from naptha to ethane
           IHS chemical estimates $125 billion in announced U.S. petrochemical investments. (3)
           Large number of proposed projects in gas-to-liquids, methanol, ethylene crackers and fertilizers

       Natural Gas Exports
         The outlook has changed from the U.S. being a net importer of natural gas to becoming a net exporter
         To date, six LNG export facilities have been approved(4), representing 10 Bcf/day of additional demand
         Natural gas exports would be beneficial for the U.S. under any pricing scenario. “Across all these
          scenarios, the U.S. was projected to gain net economic benefits from allowing LNG exports” (4)
         Current proposed and announced export projects total ~40 Bcf/day (5)

       Transportation Sector
         With natural gas vehicles (NGV’s) being 25% cleaner, fuel costs 50% less and new refueling stations being
          added across the U.S., the number of U.S. NGV’s is expected to increase significantly
         Fleet managers at AT&T, UPS, and Waste Management are converting all or parts of their fleets to natural
          gas as are transit agencies, municipalities and state governments
         The three largest U.S. truck manufacturers are now producing dual-fuel CNG trucks
         Range now has 184 CNG vehicles in its own corporate fleet
                                                                                           1.   EIA
                                                                                           2.   Goldman Sachs
                                                                                           3.   Wall St. Journal, 3/24/14
                                                                                           4.   Department of Energy
                                                                                           5.   DOE/FE LNG Applications

                                                                                                                 34         34
Environment, Health and Safety - A Core Value at Range
 Environmental, Health and Safety issues can affect many aspects of our business. Range
  feels a deep responsibility to protect our employees, contractors, the public and the
  environment. It is held as a core value.

 Examples where Range has been a leader
  − In 2008, Range recommended improved standards for well cementing and casing to the
     DEP that are now being widely used.
  − In 2009, Range pioneered water recycling for shale gas development and we were the
     first company to achieve 100 percent reuse levels.
  − In 2010, Range was the first company to voluntarily disclose fluids used in hydraulic
     fracturing on a per well basis and provide that information to the public online.
  − In 2012, Range initiated a Zero Vapor Protocol for wet gas and super rich areas in
     Marcellus shale gas development.
 Range provides training to its employees to create a culture of safe performance and
  regulatory compliance. Our Contractor Management protocol requires that work be
  performed at its highest standard.

 Range remains active in incident management and response planning by working with local
  community government and first responders to identify roles and responsibilities for a
  robust unified management approach to unique situations.

 Range’s goal is to maintain a safe and secure working environment for our employees and
  the communities in which we work.

                                                                                       35   35
Range – Significant Growth Potential for Many Years

   Projected 20%-25% growth for many years

   Wells identified, infrastructure planned with the
    contracted takeaway capacity to profitability grow
    production to 3 Bcfe/d

   Assuming current strip pricing, Range is projected to
    be cash flow positive in 2016

   Significant growth planned in 2016 and beyond,
    when gas demand is projected to grow from LNG
    exports, petrochemical, power generation,
    manufacturing and transportation

                                                     36     36
Appendix

Marcellus and
 Utica Detail

                37   37
Shale Wells Drilled and Permitted

                                         LegendLegend
                                             RANGE
                                             ANADARKO
Super-Rich Area                              CHEVRON/CHIEF SW
                                             CABOT
                                             CHESAPEAKE
                                             CHIEF
                                             CONSOL
                                             ECA
                                             EOG
Wet Area                                     EQT
                                             EXCO
                                             REX
                                             SHELL
                                             TALISMAN
                                             ULTRA
                                             XTO/EXXON/PHILLIPS
                                             OTHERS

                                          LARGER DOTS – DRILLED
                                         SMALLER DOTS – PERMITS

                                                             38
Southwest PA – Super-Rich Marcellus
                                                                                            Acreage provides the
                                                                                             opportunity for condensate
                                                                                             growth
    Super-Rich
   110,000 acres                                                                            In Q1 2014, Range drilled our
                                                                                             highest rate Marcellus well to
                                                                                             date - 24 hr IP of 6,357 boe/d
                                                                                             (38.1 Mmcfe/d) with 65% liquids

                                                                                            Planned 2014 activity in the
                                                                                             super-rich is expected to use
                                                                                             5,300 foot laterals and RCS
                                                                                             completions with expected
                                                                                             recoveries of 2.05 Mmboe (12.3
                                                                                             Bcfe)

                                                                                            Expect to drill on average 6,200
                                                                                             foot laterals in SW PA during
                                                                                             2015

                                                                                            During 2014, Range plans to turn
                                                                                             to sales 57 super-rich wells
                            Note: Townships where Range holds ~3,000+ acres are shown in
• Previously drilled well
                            yellow (As of 12/31/2013)

                                                                                                                     39   39
SW PA Super-Rich Area Marcellus
Projected Development Mode Economics
         Southwestern PA – (high Btu case)                                          Reserves and economics based on
         EUR / 1,000 ft. – 0.4 Mmboe (2.3 Mmcfe)                                     planned 2014 activity of 5,300 foot
                                                                                       lateral length with 26 frac stages,
         EUR – 2.05 Mmboe (12.3 Bcfe)                     (129 Mbbls                             500 klbs/stage
          condensate, 1,043 Mbbls NGLs, and 5.3 Bcf gas)
                                                                              140%
         Drill and Complete Capital $6.8 MM
         F&D – $4.00/boe                                                     120%

               NYMEX                 2.05

                                                                        IRR
                                                                              100%
              Gas Price*            Mmboe
                 Strip -              117%                                    80%

                $4.00 -               104%                                    60%
                $5.00 -               133%
                                                                              40%
        Price includes current and expected differentials less gathering,                $4.00                 $5.00
        transportation and processing costs
       Oil price assumed to be $90.00/bbl with no escalation                            Gas Price, $/Mmbtu NYMEX
       NGL price (except for ethane) assumed to be 40% of WTI with
        escalation
       Ethane price tied to ethane contracts plus same comparable                   Strip pricing NPV10 = $17.6 MM
        escalation
       Strip dated 06/30/14 with 10 year average $91/bbl and $4.75/mcf

                                                                                                                    40       40
Southwest PA – Super-Rich Marcellus

Currently estimating average lateral length across SW PA to be over 6,200 feet in 2015

                                                                            Average Number of Stages
                         6,000                                             35
                         5,500                                             30
                         5,000
                                                                           25
  Feet

                         4,500

                                                               Stages
                         4,000                                             20
                         3,500
                                                                           15
                         3,000
                                                                                                                    *
                         2,500                                             10
                         2,000                                              5
                                  2013     2014      2015                       2013           2014          2015

                                 EUR per 1,000 ft.                                 EUR by Year
                         0.5                                              2.7
 EUR (Mmboe)/1,000 ft.

                                                                          2.4
                                                                          2.1
                         0.4
                                                            EUR (Mmboe)
                                                                          1.8
                                                                          1.5
                                                                          1.2
                         0.3
                                                                          0.9
                                                                          0.6
                         0.2                                              0.3
                                                                          0.0                                       *
                                                                                2013           2014          2015
                         0.1
                                                                                  Gas   NGLs    Condensate
                                 2013     2014       2015

                                                                                                                    41   41
Southwest PA – Super-Rich Marcellus Well Projection

         10,000
                                                                                             • EUR – 1,172 Mbbls & 5.3 BCF
                                                                                               (2.05 Mmboe)
                                                                                             •   5,300 foot lateral length
                                                                                             •   26 frac stages
          1,000
Mcf/d

           100

                             Estimated Cumulative Recoveries
                               Condensate Residue NGL w/ Ethane
                                 (Mbbls)   (Mmcf)      (Mbbls)
            10         1 Year       42       774          153
Bbls/d

                      2 Years       62      1,260         248
                      3 Years       74      1,637         322
                      5 Years       90      2,213         436
                      10 Years     107      3,140         619
                      20 Years     119      4,235         834
                        EUR        129      5,300       1,043
             1
                  1                 6              11             16                 21             26              31            36
                                                                         Months

                                                   Residue Gas     OIL            NGL (INCLUDES ETHANE)

                                                                                                                             42        42
Southwest PA – Wet Marcellus
                                                                                            Over 200 Range wells placed
     Super-Rich                                                                              on production in wet gas area
    110,000 acres                                        Wet Gas                             over the last four years with
                                                       220,000 acres                         varying lateral lengths and
                                                                                             frac stages

                                                                                            Planned 2014 activity in the
                                                                                             wet area is expected to use
                                                                                             4,200 foot laterals with RCS
                                                                                             completions resulting in
                                                                                             anticipated recoveries of 12.3
                                                                                             Bcfe

                                                                                            Expect to drill on average
                                                                                             6,200 foot laterals in SW PA
                                                                                             during 2015

                                                                                            During 2014, Range plans to
                                                                                             turn to sales 45 wet wells
                                                            Dry Gas
                                                          200,000 acres

• Previously drilled well   Note: Townships where Range holds ~3,000+ acres are shown in
                            yellow (As of 12/31/2013)

                                                                                                                     43     43
SW PA Wet Marcellus
Projected Development Mode Economics
   Southwestern PA – (wet gas case)                                          Reserves and economics based on
                                                                               planned 2014 activity of 4,200 foot
   EUR / 1,000 ft. – 2.9 Bcfe                                                  lateral length with 21 frac stages,
   EUR –12.3 Bcfe           (27 Mbbls condensate, 951 Mbbls                               400 klbs/stage
    NGLs, and 6.4 Bcf gas)                                             160%
   Drill and Complete Capital $6.1 MM
                                                                       140%
   F&D – $0.60/mcfe
                                                                       120%

         NYMEX                  12.3

                                                                 IRR
                                                                       100%
        Gas Price*              Bcfe
            Strip -            121%                                    80%

          $4.00 -              106%                                    60%

          $5.00 -              154%
                                                                       40%
                                                                                    $4.00               $5.00
 Price includes current and expected differentials less gathering,               Gas Price, $/Mmbtu NYMEX
  transportation and processing costs
 Oil price assumed to be $90.00/bbl with no escalation
 NGL price (except for ethane) assumed to be 40% of WTI with                 Strip pricing NPV10 = $15.2 MM
  escalation
 Ethane price tied to ethane contracts plus gas price escalation
 Strip dated 06/30/14 with 10 year average $91/bbl and $4.75/mcf

                                                                                                                44
Southwest PA – Wet Marcellus

Currently estimating average lateral length across SW PA to be over 6,200 feet in 2015

                                  Horizontal Length                          Average Number of Stages
                          5,000                                             30
                          4,500
                                                                            25
                          4,000
 Feet

                                                                            20

                                                                Stages
                          3,500
                                                                            15
                          3,000
                                                                            10                                            *
                          2,500

                          2,000                                              5
                                  2013     2014       2015                       2013           2014           2015

                                  EUR per 1,000 ft.                                 EUR by Year
                            3.5                                           20.0
   EUR (Bcfe)/1,000 ft.

                            3.0                                           15.0

                            2.5                              EUR (Bcfe)   10.0

                            2.0                                            5.0

                            1.5                                                                                       *
                                                                           0.0
                                                                                 2013           2014           2015
                            1.0
                                                                                   Gas   NGLs     Condensate
                                  2013     2014       2015

                                                                                                                          45   45
Southwest PA – Wet Marcellus Well Projection
         10,000
                                                                      •   EUR – 978 Mbbls & 6.4 BCF (12.3 Bcfe)
                                                                      •   4,200 foot lateral length
                                                                      •   21 frac stages
Mcf/d

          1,000

           100

                                                                          Estimated Cumulative Recoveries
Bbls/d

                                                                              Condensate Residue NGL w/ Ethane
                                                                                (Mbbls) (Mmcf)     (Mbbls)
                                                                    1 Year        11      1,082       161
            10                                                     2 Years        14      1,674       249
                                                                   3 Years        17      2,117       315
                                                                   5 Years        19      2,775       412
                                                                   10 Years       23      3,841       571
                                                                   20 Years       25      5,095       757
                                                                     EUR          27      6,400       951
             1
                  1   6   11                 16                  21                  26               31              36
                                                   Months
                               Residue Gas        OIL       NGL (INCLUDES ETHANE)

                                                                                                                 46   46
Southwest PA – Industry Activity in Dry Gas Acreage

                                                                                                 56% of horizontal dry gas
                                                                                                  Marcellus wells drilled by
                                                                                                  industry in SW PA have
                                                                                                  projected recoveries from 5 to
                                                                                                  over 20 Bcf per well

                                                                                                 Range’s SW Pennsylvania dry
                                                                                                  gas acreage is predominantly
                                                                                                  held by production

                                                                                                 Range’s 2014 wells are
                                                                                                  expected to be 5,200 foot
                                                                                                  laterals, using RCS
                                                                                                  completions, with future wells
                                                                                                  longer
                                                                  200,000 net                    Expect to drill on average
                                                                     acres                        6,200 foot laterals in SW PA
                                                                                                  during 2015

      Represent a 10+ Bcf well                     Represent a 5-10 Bcf well
Note: Townships where Range holds ~3,000 or more acres are shown in yellow (As of 12/31/2013)

                                                                                                                         47      47
SW PA Dry Marcellus
Projected Development Mode Economics
    Southwestern PA – (dry gas)                                             Reserves and economics based on
    EUR / 1,000 ft. – 2.6 Bcf                                                planned 2014 activity of 5,200 foot
                                                                               lateral length with 26 frac stages,
    EUR – 13.4 Bcf                                                                       300 klbs/stage
    Drill and Complete Capital $6.6 MM
                                                                      180%
    F&D – $0.59/mcf
                                                                      160%

                                                                      140%

         NYMEX                  13.4                                  120%

                                                                IRR
        Gas Price*              Bcf                                   100%
            Strip -            104%                                   80%

           $4.00 -              85%                                   60%

           $5.00 -             172%                                   40%

                                                                      20%
                                                                                  $4.00                $5.00
                                                                                   Gas Price, $/Mmbtu NYMEX

 Price includes current and expected differentials less gathering
  and transportation costs                                                   Strip pricing NPV10 = $13.3 MM
 Strip dated 06/30/14 with 10 year average $4.75/mcf

                                                                                                               48    48
Southwest PA – Dry Marcellus

Currently estimating average lateral length across SW PA to be over 6,200 feet in 2015

                               Horizontal Length                             Average Number of Stages
                    6,000                                                   35
                    5,500
                                                                            30
                    5,000
                                                                            25
                    4,500

                                                              Stages
Feet

                    4,000                                                   20
                    3,500
                                                                            15
                    3,000                                 *                                               *
                                                                            10
                    2,500
                    2,000                                                    5
                               2013     2014       2015                           2013      2014   2015

                               EUR per 1,000 ft.                                     EUR by Year
                         3.0
                                                                           20.0
   EUR (Bcf)/1,000 ft.

                         2.5                                               15.0

                         2.0                                   EUR (Bcf)   10.0

                                                                            5.0
                         1.5                                                0.0                           *
                                                                                  2013      2014   2015
                         1.0                              *
                                                                                          Gas
                                2013     2014      2015

                                                                                                          49   49
Southwest PA – Dry Marcellus Well Projection

         100,000
                                                                                •    EUR – 13.4 BCF
                                                                                •    5,200 foot lateral length
                                                                                •    26 frac stages
          10,000

           1,000
 Mcf/d

                       Estimated Cumulative
                            Recoveries
            100
                                      Residue
                                      (Mmcf)
                        1 Year            2,951
                        2 Years           4,218
                        3 Years           5,115
             10         5 Years           6,406
                       10 Years           8,434
                       20 Years         10,772
                          EUR            13,400

              1
                   1              6               11   16                  21       26             31             36
                                                            Months
                                                             Residue Gas

                                                                                                          50     50
Marcellus Wet Gas Provides Significant Price Uplift
$/Wellhead Mcf
       $8.00                                                                                                       $7.70- $7.80
                                                                              $7.40
       $7.00

                                                                             $1.95                                      $2.97 -
                                                                                            NGLs (C3+)                   $3.07 NGLs (C2+)
       $6.00

       $5.00
                                                                             $1.53          Condensate
                                 $4.16
       $4.00                                                                                                             $1.53
                                                                                                                                       Condensate

       $3.00

                                                                                               Gas                                       Gas
       $2.00                      $4.16                                      $3.92
                                                      Gas                                   (1140 Btu)                                (1055 Btu)
                                                                                             14% shrink                  $3.20          24% shrink
                                                   (1040 Btu)
       $1.00

       $0.00
                                 Dry Gas                        Wet Gas - Ethane Rejection                 Wet Gas - Ethane Extraction

                                                                                                                 Projected - 2015
Assumptions: $4.00 NG, $90.00 WTI, 40% WTI (C3+), 2.27 GPM (ethane rejection), 5.60 GPM (ethane extraction), all processing, shrink, fuel & ethane transport
             included. Based on SWPA wet gas quality (1,275 processing plant inlet btu). Wet Gas (Ethane Extraction) based on full utilization of current
             ethane/propane agreements. NOTE: Wet Gas (Ethane Rejection) equals 1.3 mcfe post-processing and Wet Gas (Ethane Extraction) equals 1.68 mcfe.

                                                                                                                                              51
Extracting Ethane Improves Range’s Cash Flow
                                           Range Resources SW Marcellus – Third Quarter 2014
                                                                      3Q Pro-forma                     3Q Actual                    3Q Pro-forma
                                                                                                     Transportation and       3Q 2014 assuming full ethane
                                                                                                 processing costs shown as     recovery and utilization of all
                                                                  3Q 2014 assuming no ethane       separate expense rather      three ethane and propane
                                                                           recovery               than deduct to NGL price               projects
 Gross Revenue, pre-hedge
  Natural gas (per mcf)                                                    $3.64                          $3.49                           $3.47
  Natural gas liquids (per bbl)                                            44.25                          29.71                           30.73
  Condensate (per bbl)                                                     78.04                          78.04                           78.04
      Total Revenue (per mcfe)                                              5.23                          4.67                            4.76

 Operating Expenses (per mcfe)
  Direct operating                                                          0.25                          0.21                            0.21
  Transport, gathering & processing *                                       1.71                          1.47                            1.46
  Production tax (impact fee)                                               0.09                          0.08                            0.08
      Cash Production Cost                                                  2.05                          1.76                            1.75

 Cash Production Margin (per mcfe)                                         $3.18                          $2.91                           $3.01

 Cash Flow (millions)                                                       $196                          $208                            $223

     * Includes all transportation and gathering expense for natural gas and NGLs, including fees associated with ethane and propane transportation
   agreements, such as ATEX or Mariner East. For this illustration, NGL processing fees, and truck and rail expenses are also included as an expense
                                            rather than a reduction to price, as would be presented under GAAP.

Ethane and Propane agreements will increase annualized
    Cash Flow ~$100 Million per year starting in 2015
                                                                                                                                                                 52   52
Marcellus NGL Pricing

  Weighted Avg.
Composite Barrel (1)                                               Realized Marcellus NGL Prices
                                                                                 2013                       2014

                                                                        3Q               4Q        1Q       2Q        3Q

          8%                                NYMEX – WTI (per          $105.87           $97.48    $98.61   $102.97   $96.99
                                            bbl)
     8%                                     Mont Belvieu                $52.63          $47.78    $37.22    $33.43   $31.81
4%                                          Weighted Priced
                                            Equivalent (2)
                       51%
                                            Plant Fees plus            (18.63)          (11.91)   (8.02)    (9.79)   (10.19)
                                            Diff.
   29%                                      Average price               $34.00          $35.87    $29.20    $23.64   $21.62
                                            before NGL
                                            hedges
                                            % of WTI (NGL                 32%             37%       30%       23%      22%
                                            Pre-hedge / Oil
                                            NYMEX)
Ethane C2
Propane C3                                  % of Mont Belvieu             65%             75%       78%       71%      68%
Iso Butane iC4                              Weighted
Normal Butane NC4                           Equivalent
Natural Gasoline C5+

(1) Based on estimated NGL volumes in 2Q 2014
(2) Based on Mont Belvieu NGL prices and weighted average barrel composition for Marcellus

                                                                                                                       53      53
Processing Capacity Development

                                                        54

Source: MarkWest Energy Partners, September 2014

                                                   54
Current Capability of Range’s Marcellus Area

                                Processing Plant

                                                                1.4 Bcf/d gas
  1.8 Bcf/d of
  wet inlet gas                                                 55,000 bbls/d ethane
 Inlet gas needed to produce                                    140,000 bbls/d
  55,000 bbls ethane per day,
assuming minimum extraction
                                                                condensate and C3+

                                                                 2.6 Bcfe/d
                                            Additional dry gas: > 1.0 Bcf/d

                                                               > 3.6 Bcfe/d from the
         Ethane contracts have cleared                           Marcellus
            a path, allowing Range to
           produce over 3 Bcfe per day                         (> 3.0 Bcfe/d net)
           net from the Marcellus alone

                                                                                    55   55
Northeast PA

                                                                                            A 1-2 rig program is
                                                                                             designed to hold all
                                                                                             blocked up acreage
                                                                                             being targeted for
    Northeast
                                                                                             development
120,000 net acres
                                                                                            Planned 2014 activity in
                                                                                             area is expected to use
                                                                                             4,800 foot laterals and 24
                                                                                             frac stages

                                                                                            Expect to drill ~6,000
                                                                                             foot laterals in 2015

                                                                                            In 2014, Range plans to
                                                                                             turn 20 wells to sales in
                                                                                             the northeast

Note: Townships where Range holds ~3,000+ acres are shown in yellow (As of 12/31/2013)

                                                                                                                 56      56
NE PA Dry Marcellus
Projected Development Mode Economics
    Northeastern PA – (dry gas)                                             Reserves and economics based on
    EUR / 1,000 ft. – 2.7 Bcf                                                planned 2014 activity of 4,800 foot
                                                                               lateral length with 24 frac stages,
    EUR – 13.1 Bcf                                                                       200 klbs/stage
    Drill and Complete Capital $4.7 MM
                                                                      240%
    F&D – $0.42/mcf                                                  220%
                                                                      200%
                                                                      180%

                                                                IRR
                                                                      160%
         NYMEX                  13.1
                                                                      140%
        Gas Price*              Bcf                                   120%
            Strip -             110%                                  100%
                                                                      80%
           $4.00 -              82%
                                                                      60%
           $5.00 -             221%                                   40%
                                                                      20%
                                                                                 $4.00                $5.00
                                                                                   Gas Price, $/Mmbtu NYMEX

 Price includes current and expected differentials less gathering
  and tranportation costs                                                    Strip pricing NPV10 = $11.8 MM
 Strip dated 06/30/14 with 10 year average $4.75/mcf

                                                                                                              57     57
Northeast PA

Currently estimating average lateral length across NE PA to be ~6,000 feet in 2015

                                   Horizontal Length                           Average Number of Stages
         6,000                                                            30
         5,500                                                            25
         5,000
                                                                          20
         4,500

                                                                Stages
Feet

         4,000                                                            15
         3,500                                                            10
         3,000
                                                                           5
         2,500
         2,000                                                             0
                                    2013     2014      2015                       2013         2014    2015

                                   EUR per 1,000 ft.                                     EUR by Year
                              3
                                                                          16.0
                             2.5
       EUR (Bcf)/1,000 ft.

                                                                          14.0
                                                                          12.0
                                                              EUR (Bcf)
                              2
                                                                          10.0
                             1.5                                           8.0
                              1                                            6.0
                                                                           4.0
                             0.5
                                                                           2.0
                              0                                            0.0
                                    2013     2014      2015                        2013        2014    2015

                                                                                                              58
                                                                                                                   58
Northeast PA – Well Projection
        100,000

                                                                        • EUR – 2.7 Bcf / 1,000 ft.
                                                                        •    4,800 foot lateral length
                                                                        •    24 frac stages
         10,000

          1,000
Mcf/d

                      Estimated Cumulative
                           Recoveries
           100
                                     Residue
                                     (Mmcf)
                       1 Year         3,152
                       2 Years        4,440
                       3 Years        5,302
            10         5 Years        6,502
                      10 Years        8,336
                      20 Years       10,413
                         EUR         13,065

             1
                  1              6             11   16             21   26               31               36
                                                         Months

                                                     Residue Gas

                                                                                                 59      59
Announced Appalachian Basin Takeaway Projects – 1 of 2
         NORTH EAST PA                Operator        Main Line              Market           Start-up Capacity - Bcf/d
  2014 Northeast Connector             Williams        Transco                  NE             Q4'14         0.1
       Iroquois Access                Dominion         Iroquois                 NE             Q4'14         0.3
       Rose Lake Expansion          Kinder Morgan        TGP                    NE             Q4'14         0.2
  2015 Niagara Expansion            Kinder Morgan        TGP                  Canada           Q4'15         0.2
       Northern Access 2015              NFG         National Fuel            Canada           Q4'15         0.1
       Leidy Southeast                 Williams        Transco            Mid-Atlantic/SE      Q4'15         0.5
       East Side Expansion             Nisource       Columbia            Mid-Atlantic/SE      Q4'15         0.3
  2016 Northern Access 2016              NFG         National Fuel            Canada            2016         0.4
       SoNo Iroquois Access           Dominion         Iroquois               Canada           Q2'16         0.3
       Constitution                    Williams      Constitution               NE             H1'16         0.7
       Algonquin AIM                   Spectra        Algonquin                 NE             Q4'16         0.4
  2017 Atlantic Sunrise                Williams        Transco            Mid-Atlantic/SE      H2'17         1.7
       PennEast                          AGT                                    NE             H2'17         1.0
       Atlantic Bridge                 Spectra         Algonquin                NE             H2'17         0.7
  2018 Access Northeast                Spectra         Algonquin                NE             H2'18         1.0
       Diamond East                    Williams         Transco                 NE             H2'18         1.0
       TGP Northeast Expansion      Kinder Morgan         TGP                   NE             H2'18         1.0

        SOUTH WEST                    Operator         Main Line              Market          Start-up Capacity - Bcf/d
  2014 Lebanon Lateral Reversal      Transcanada         ANR                  Midwest          Q1'14         0.4
       Utica Backhaul               Kinder Morgan        TGP                 Gulf Coast        Q2'14         0.5
       REX Seneca Lateral             Tall Grass         REX                  Midwest          H1'14         0.6
       TEAM 2014                       Spectra          TETCO                Gulf Coast        Q4'14         0.6
       TEAM South                      Spectra          TETCO                Gulf Coast        Q4'14         0.3
       West Side Expansion             Nisource        Columbia              Gulf Coast        Q4'14         0.4
  2015 REX Zone 3 Full Reversal       Tall Grass         REX                  Midwest          Q2'15         1.2
       TGP Backhaul / Broad Run     Kinder Morgan        TGP                 Gulf Coast        Q4'15         0.6
       TETCO OPEN                      Spectra          TETCO                Gulf Coast        Q4'15         0.6
       Uniontown to Gas City           Spectra          TETCO                 Midwest          Q4'15         0.4
       Glen Karn 2015                Transcanada         ANR                  Midwest          Q4'15         0.8
       QuickLink                       Nisource        Columbia               Midwest          Q4'15         0.5

                                  Note: Data subject to change as projects are approved and built.
                                       Highlighted projects where Range is participating.                                 60
Announced Appalachian Basin Takeaway Projects – 2 of 2
        SOUTH WEST                            Operator       Main Line             Market            Start-up Capacity - Bcf/d
  2016 Gulf Expansion Ph1                      Spectra       TETCO              Gulf Coast            Q4'16         0.3
       Clarington West Expansion              Tall Grass      REX                Midwest              Q4'16         2.4
       Rover Ph1                                 ETP                     Midwest/Canada/Gulf Coast    Q4'16         1.9
  2017 Rayne/Leach Xpress                      Nisource     Columbia            Gulf Coast            Q3'17         1.5
       SW Louisiana                         Kinder Morgan     TGP               Gulf Coast            Q3'17         0.9
       Rover Ph2                                 ETP                     Midwest/Canada/Gulf Coast    Q3'17         1.3
       TGP Backhaul / Broad Run
       Expansion                            Kinder Morgan     TGP                Gulf Coast           Q4'17         0.2
       Adair SW                                Spectra       TETCO               Gulf Coast           Q4'17         0.2
       Access South                            Spectra       TETCO               Gulf Coast           Q4'17         0.3
       Gulf Expansion Ph2                      Spectra       TETCO               Gulf Coast           Q4'17         0.4
       NEXUS                                   Spectra                        Midwest/Canada          Q4'17         1.5
       ANR Utica                             Transcanada      ANR             Midwest/Canada          Q4'17         0.6
       Cove Point LNG                         Dominion                              NE                Q4'17         0.7
  2018 Mountain Valley Pipeline              NextEra/EQT                      Mid-Atlantic/SE         Q4'18         2.0
       Western Marcellus                       Williams      Transco          Mid-Atlantic/SE         Q4'18         1.5
       Atlantic Coast Pipeline              Duke/Dominion                     Mid-Atlantic/SE         Q4'18         1.5

        Total NE to Canada                                                                                          1.0
        Total NE to NE                                                                                              6.2
        Total NE to Mid-Atlantic/SE                                                                                 2.5
                       Total NE Additions                                                                           9.7

        Total SW to Mid-Atlantic/SE                                                                                5.0
        Total SW to Midwest/Canada                                                                                 9.9
        Total SW to Gulf Coast                                                                                     8.4
        Total SW to NE                                                                                             0.7
                      Total SW Additions                                                                           24.0

        Overall Total Additions for Appalachian Basin                                                              33.7

                                        Note: Data subject to change as projects are approved and built.
                                             Highlighted projects where Range is participating.                                  61
Planned and proposed pipeline projects through 2018
   Moving gas out of the basin should balance supply & demand

                                                                      North & Northeast
                                                                Williams Constitution Pipeline
          Estimated incremental capacity: +25.2 Bcfd            Spectra Algonquin Expansion
                                                                  TGP Northeast Expansion
                                                                          +2.7 Bcfd

        Midwest & Canada
      Energy Transfer Rover
   REX Rockies Express Reversal                                     Metropolitan NY Area
         Spectra NEXUS                                            Williams Rockaway Lateral
            +7.1 Bcfd                                              NJR PennEast Pipeline
                                                                   Williams Diamond East
                                                                          +2.6 Bcfd

                                                          Mid-Atlantic & Southeast
         South & Southwest                                Williams Atlantic Sunrise
NiSource (TCO) Leach/Rayne Express                      EQT/Nextera Mountain Valley
           TGP Broadrun                                Dominion Atlantic Coast Pipeline
         TGP SW Louisiana                                        +5.2 Bcfd
      TETCO Reversal Projects
  +7.6 Bcfd (includes all reversals)
                                                                  *Data as of September 2014
                                                                  *Capacities and timing may vary
                                                                  *May not include all current projects

                                                                               Source – Internal

                                                                                                   62     62
Peer Group Transport Capacity Comparison

                 Average Capacity (1)                  Gross Production (2)                 Calculated Utilization
              2015       2016        2017           2015       2016       2017          2015        2016        2017            Calculated Utilization Labels

RRC (3)         1,200       1,520       1,820         1,145      1,386        1,651     95%         91%          91%
AR              2,250       3,375       3,700         1,458      2,024        2,166     65%         60%          59%                  < 20% over/under capacity
ECR               127         143         413           253        596          675     199%       417%         163%                  > 20% over/under capacity
EQT             1,712       1,793       1,831         1,783      2,205        2,386     104%       123%         130%
GPOR (3)          638         750         825           386        614          807     61%         82%          98%
REXX              213         235         343           163        228          229     76%         97%          67%
RICE              811         918         958           660        825          976     81%         90%         102%

           (1) - Annual estimate based on company presentations
           (2) - Bloomberg/CapIQ consensus net production grossed up using 83% working interest assumption
           (3) - Assuming 95% of GPOR and RRC gas production is related to Appalachian capacity
           Note: Capacity may not be expressed in actual volumes that can be moved, but rather totaling all segments under contract

   Data from Marcellus SW PA and Utica Peer Group shows that some
   producers have right-sized transportation capacity, like Range, for the
   next three years. Others have either more capacity than needed for
   projected growth, less capacity than projected growth or appear to grow
   into their capacity from 2015 to 2017.

                                                                                                                                                             63   63
Effective Cost of Transport – Assuming No Released Capacity

                                                                                                                     Calculated Trans. Cost w/
              Average Capacity (1)                Calculated Utilization               Transport Cost (2)                 Utilization % (3)
            2015      2016       2017           2015       2016        2017          2015      2016     2017        2015      2016           2017

   RRC        1,200     1,520      1,820        95%        91%        91%           $0.28      $0.28    $0.37       $0.29     $0.31          $0.41
   AR         2,250     3,375      3,700        65%        60%        59%           $0.35      $0.50    $0.52       $0.54     $0.83          $0.89
   ECR          127       143        413       199%        417%       163%          $0.26      $0.47    $0.55       $0.26     $0.47          $0.55
   EQT        1,712     1,793      1,831       104%        123%       130%          $0.30      $0.29    $0.27       $0.30     $0.29          $0.27
   GPOR         638       750        825        61%        82%        98%           $0.58      $0.63    $0.65       $0.96     $0.77          $0.66
   REXX         213       235        343        76%        97%        67%           $0.21      $0.32    $0.39       $0.28     $0.33          $0.58
   RICE         811       918        958        81%        90%        102%          $0.60      $0.60    $0.62       $0.74     $0.67          $0.62
                                                                                                         Wt. Avg.   $0.49     $0.59          $0.62
          (1) - Estimate based on company presentations
          (2) - Estimate based on company presentations, SEC filings and accounting method                                  Under Wt. Avg.
          (3) - When utilization >100%, cost remains flat and there is no further assumption on gas sales ability           Over Wt. Avg.

For producers with excess capacity (Utilization < 100%) and no sold
capacity in the “released transport” market, effective cost increases as the
full capacity cost is carried by current production.

For producers with insufficient takeaway capacity (Utilization > 100%),
capacity costs would stay the same (or decrease on a weighted average) but
would effectively be more exposed to the local markets with less attractive
sales prices.

                                                                                                                                                     64   64
LNG Exports – Developing Projects To-Date

                                                 Based on operator
                                                 announced dates

Our analysis suggests at least 8 of the 38 proposed export
facilities are likely to proceed by 2022, representing ~12 Bcf/d
of capacity out of the proposed ~40 Bcf/d. These 8 have DOE
Non-FTA approval &/or FERC EIS approval (or in advanced
stages), have offtake deals signed for the majority of capacity,
&/or experienced LNG operator backing.                                           EXPORTS
                                                                     1.0 Bcf/d for the Mid-Atlantic
                                                                     5.0 Bcf/d for Texas
                                                                     6.0 Bcf/d for Louisiana

                                                                     Additional 3-5 Bcf/d in Canada
                                                                     probable in 2020-25 timeframe.

                                                                                            65
Point Pleasant Porosity Cross Section

                                        RRC Well

                                                   66
Southern Appalachian Division

475,000 net acres- Range owns minerals on most of the acreage

    Recent completion technology advances result in
     substantially higher returns for CBM and tight gas wells

    Recent CBM results are 100% better than the historical field
     average, with moderate cost increases of $15,000 per well.
     Projected returns of up to 100%

    Recent tight gas well results are 70% better than the field
     average, with a modest cost increase of approximately
     $12,000 per well. Projected returns of up to 100%

    Deeper exploration potential upside

                                                                   67   67
Appendix

Financial and
Reserve Detail

                 68   68
Resource Potential is 8 to 10 Times Proved Reserves

                                                                                        Net Unproven
                                         Gas                     Liquids
     Resource Area                                                                        Resource
                                         (Tcf)                  (Mmbbls)
                                                                                        Potential (Tcfe)

Marcellus Shale                        27 – 35               2,250 – 2,740                    41 – 51

Upper Devonian Shale                    8 – 12                  600 – 940                     12 – 18

Midcontinent                             3–4                  665 – 1,032                      7 – 11

Nora                                     5–6                         -0-                        5–6

TOTAL                                 43 – 57              3,515 – 4,712                     65 – 86

As of 6/30/2014 – Includes the effect of the property exchange with EQT, effective June 16, 2014. Does not include
Utica/PP or tighter spacing in dry Marcellus areas; Liquids include Ethane.

                                                                                                           69        69
Strong, Simple Balance Sheet
                                                                          1st          2nd         3rd
                             YE         YE         YE          YE
                                                                        Quarter      Quarter     Quarter
                            2010       2011       2012        2013
                                                                         2014         2014        2014
     ($ in millions)

     Bank borrowings          $274       $187       $739        $500        $594        $480         $649

     Sr. Sub. Notes          1,686      1,788      2,139       2,641       2,641        2,350       2,350

        Less: Cash              (3)        (0)        (0)         (0)         (0)          (0)         (0)

        Net debt             1,957      1,975      2,878       3,141       3,235        2,830       2,999

     Common equity           2,224      2,392      2,357       2,414       2,450        3,020       3,169
       Total
     capitalization         $4,181     $4,367     $5,235      $5,555      $5,685      $5,850       $6,168

     Debt-to-
                              47%        45%         55%        57%          57%         48%         49%
     capitalization(1)

     Debt/EBITDAX(1)          2.8x       2.3x        3.2x       2.8x         2.8x        2.4x        2.5x

     Liquidity(2)             $971     $1,284       $927      $1,166      $1,029      $1,139         $997

     (1) Ratios are net of cash balances.
     (2) Liquidity equals cash available borrowings under the revolving credit facility, as requested. Based
         on previous bank agreement. Current liquidity is $1.2B.

                                                                                                               70   70
Debt Maturities

                                      Range maintains an orderly debt maturity ladder

                   800
                                                                                                                                     $750

                   700
                                                                                       $649
                                                                                                                          $600
                   600
                                                                                                  $500        $500
                   500
                                                                   Credit Facility
  ( $ Millions )

                                                                       3Q14
                   400

                   300

                   200

                   100

                       0

                   Senior Secured Revolving Credit Facility (as of October 28, 2014) Maximum facility size of $4 billion, with borrowing
                     base increased to $3 billion from $2 billion and bank commitment raised to $2 billion.
                   Senior Subordinated Notes

                                                                                                                                            71   71
Range’s Outstanding Bonds
                   Corporate Rating: Ba1 (Positive) / BB+ (Stable)
                                        Senior Subordinated Notes             Amount              Current YTW

                                               6.75% due 2020                $ 500                 4.51%
                                               5.75% due 2021                $ 500                 4.42%
                                               5.00% due 2022                $ 600                 4.63%
                                               5.00% due 2023                $ 750                 4.55%
                                                      Total                  $2,350

                                       8.00%
                                       7.00%
                                       6.00%                                                         6.84%
                      Yield-to-Worst

                                                                                      5.99%
                                       5.00%
                                                                    4.93%
                                       4.00%         4.53%
                                       3.00%
                                       2.00%
                                       1.00%
                                       0.00%
                                                 Range Weighted   BB Index        7 to 10 Year     E&P Index
                                                    Average                      Maturity Index

        Range bonds have consistently traded in-line or better than BB rated index

Source: Bank of America as of 10/10/14
Note: Range’s weighted average maturity is 8 years

                                                                                                                72   72
Resilient Credit Metrics Driven by Low Cost Growth
Debt / EBITDAX                                                                   Debt / Total Proved                                       ($/mcfe)
4.5x                                                                               $1.00
                                                    Covenant
4.0x
                                                                                   $0.80
3.5x                                                                                                              BB / Ba Peer Average for 2013

3.0x                                                                               $0.60

2.5x
                                                                                   $0.40
2.0x
                                                                                   $0.20
1.5x

1.0x                                                                                 $-
        2008      2009      2010        2011      2012     2013                              2008      2009      2010      2011     2012      2013
Debt / Production                                   ($/boepd)                    Debt / Proved Developed                                   ($/mcfe)
  $35,000                                                                         $1.75

                                                                                  $1.50                           BB / Ba Peer Average for 2013
  $30,000

  $25,000                                                                         $1.25
                                      BB / Ba Peer Average for 2013

  $20,000                                                                         $1.00

  $15,000                                                                         $0.75

  $10,000                                                                         $0.50
               2008      2009    2010      2011     2012     2013                            2008      2009      2010     2011      2012      2013
The peer group is comprised of companies in the GICS Oil & Gas Exploration & Production sub-industry with a corporate family rating between Ba3 and
Ba1 from Moody’s and between BB- and BB+ from S&P.

                                                                                                                                                      73
Gas Hedging Status

                                      Volumes       Average        Average
                                       Hedged      Floor Price     Cap Price

                                     (Mmbtu/day)   ( $ / Mmbtu)   ( $ / Mmbtu)

                   4Q 2014 Swaps       260,000        $4.18

                   4Q 2014 Collars     447,500        $3.84          $4.48

                    2015 Swaps         307,432        $4.21

                    2015 Collars       145,000        $4.07          $4.56

                    2016 Swaps         90,000         $4.21

As of 10/28/2014

                                                                                 74   74
Oil Hedging Status

                                     Volumes       Average      Average
                                     Hedged       Floor Price   Cap Price

                                     (bbls/day)     ($/bbl)      ($/bbl)

                   4Q 2014 Swaps       9,500        $94.35

                   4Q 2014 Collars     2,000        $85.55      $100.00

                    2015 Swaps         9,626        $90.57

                    2016 Swaps         1,000        $91.43

As of 10/28/2014

                                                                            75   75
Natural Gas Liquids Hedging Status

                                     Volumes      Hedged (1)                                      Volumes      Hedged (1)
                                     Hedged         Price                                         Hedged         Price
                                     (bbls/day)     ($/gal)                                       (bbls/day)     ($/gal)
Natural
Gasoline (C5)                                                      Propane (C3)
                   4Q 2014 Swaps       3,500        $2.168                        4Q 2014 Swaps    12,000        $1.018

                    2015 Swaps          123         $2.140                         2015 Swaps       1,745        $1.042
Normal
Butane (NC4)                                                        Ethane (C2)
                   4Q 2014 Swaps       4,000        $1.344                        4Q 2014 Swaps       -             -

                                                                                                   Conversion Factor:
As of 10/28/2014    (1) NGL hedges have Mont Belvieu as the underlying index.                      One barrel = 42 gallons

                                                                                                                     76      76
2014 Capital Budget

      Budget = $1.52 Billion                              Budget by Area
  Drilling              Pipelines, Facilities & Other   Marcellus         Midcontinent
  Acreage & Seismic                                     Permian           S. Appalachia / Nora

                  78%                                               87%

             6%   16%                                               8%

                                                                                     77          77
Growth at Low Cost

                                Top quartile growth at top quartile cost

                                                                                                        3 Year    5 Year
                                                  2009          2010        2011       2012    2013    Average   Average

      Reserve growth                                18%          42%         14%       29%     26%     23%(3)    25%(3)

      Drill bit replacement (1)                    540%         840%        850%       773%    612%     725%      718%

      All sources replacement (2)                  486%         931%        849%       680%    636%     703%      709%

      Drill bit only - without acreage (1)        $0.69        $0.59        $0.76      $0.67   $0.57    $0.66     $0.65

      Drill bit only - with acreage (1)           $0.90        $0.70        $0.89      $0.76   $0.63    $0.75     $0.76

      All sources -
       Excluding price revisions                  $0.90        $0.73        $0.89      $0.76   $0.63    $0.75     $0.76

       Including price revisions                  $1.00        $0.71        $0.89      $0.86   $0.61    $0.77     $0.78

(1)     Includes performance revisions only.
(2)     From all sources, including price and performance revisions, excludes sales.
(3)     Percentages shown are compounded annual growth rates

                                                                                                                           78   78
Contact Information

             Range Resources Corporation
             100 Throckmorton, Suite 1200
               Fort Worth, Texas 76102
                  Main: 817.870.2601
                  Fax: 817.870.2316

              Rodney Waller, Senior Vice President
                  rwaller@rangeresources.com

            David Amend, Investor Relations Manager
                  damend@rangeresources.com

                 Laith Sando, Research Manager
                   lsando@rangeresources.com

            Michael Freeman, Senior Financial Analyst
                 mfreeman@rangeresources.com

                www.rangeresources.com

                                                        79   79
You can also read