The impact of commuters' psychological feelings due to delay on perceived quality of a rail transport - Nature
←
→
Page content transcription
If your browser does not render page correctly, please read the page content below

ARTICLE
                  https://doi.org/10.1057/s41599-021-00865-z               OPEN

                  The impact of commuters’ psychological feelings
                  due to delay on perceived quality of a rail transport
                  Mahdi Rezapour1 ✉ & F. Richard Ferraro2

                  Public transport’s delay has become an integral part of the daily routine for many commuters,
                  and become more intense as people are under more time pressure and deadline. This study
1234567890():,;

                  was set forward to study a relationship between various psychological feelings that the
                  commuters might experience due to delay and the level of transport satisfaction. One of the
                  most notorious rail transport in Malaysia was employed as the case study. The passengers of
                  that rail transport often experience more than an hour of delay due to malfunctions or other
                  mechanical problems of that transport. Our instruments include 396 fully completed com-
                  muters’ responses at the locations of the waiting time. The instruments include three sub-
                  sections: demographic, physical, and psychological behaviors that commuters might
                  experience. An indicator was also used to obtain the passengers’ opinions about the impacts
                  of delay on the level of the perceived quality of the transport. The ordered mixed logit model
                  was employed for the analysis. The mixed model was considered to provide more flexibility
                  and to prevent biased point estimates. That is especially important as it is expected that the
                  point estimates of some commuters’ feelings might vary across population based on factors
                  such as the commuters’ objectives of travel, or level of urgency to reach the destination. The
                  results highlighted, for instance, the feelings of being tired or nervous to be random in
                  predicting the perceived quality of the transport. The results also indicated that the inter-
                  actions between age, gender, and level of education, and also neck pain, and an increased
                  heartbeat should be considered, instead of their sole main effects. Also, evaluating the
                  heterogeneity in taste revealed that the change in a random parameter of feeling nervous is
                  dependent on the parameter of commuters’ gender. Overall, the results provide important
                  insights regarding various feelings that the commuters experienced, which impact their
                  perceived quality of rail transportation. Extensive discussion regarding the link between the
                  study’s findings and mindsponse theory was given in the “Discussion” and “Conclusion”
                  sections of this study.

                  1 Optim,   Mashhad, Iran. 2 Department of Psychology, University of North Dakota, Grand Forks, ND, USA. ✉email: Rezapour2088@yahoo.com

                  HUMANITIES AND SOCIAL SCIENCES COMMUNICATIONS | (2021)8:190 | https://doi.org/10.1057/s41599-021-00865-z                                 1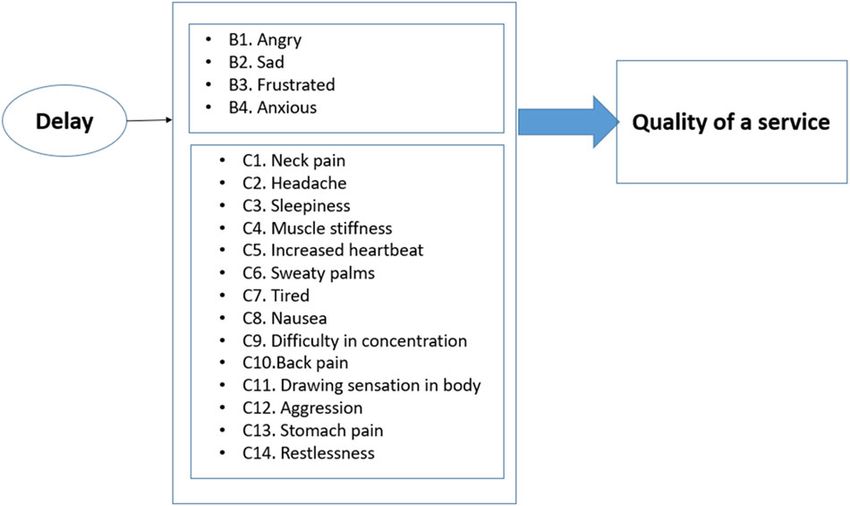
ARTICLE                                  HUMANITIES AND SOCIAL SCIENCES COMMUNICATIONS | https://doi.org/10.1057/s41599-021-00865-z

P
Introduction
       ublic transportation systems play a vital role in reducing           commuters’ feelings. All these sections would highlight the
       traffic congestion, gasoline consumption, carbon emission,            plausible relationship between various links in our study being
       and consequently creating cleaner air (Mees, 2000). Thus,            investigated in the literature review.
extensive efforts have been made by public transport planners to
enhance the satisfaction of public transport. The higher satis-             Commuters’ negative feelings due to transports shortcomings.
faction could be achieved, for instance, by an improvement in the           An instruments survey was conducted to evaluate the passengers’
quality of a certain service, which could lead to greater use of            waiting behavior in terms of irritation levels due to waiting time
public transport. One of the aspects of public transport, which             at bus stops (Ohmori et al., 2004). The results highlighted that
received much attention, is the delay. Delay is part of waiting time        there is a higher irritation level associated with a longer waiting
and can be defined as the difference between the actual arrival of           time. In another study, crowding, delay, and accessibility to a
public transportation and the expectation of a commuter. The                railway station were some of the sources of the commuters’
expectation of commuters, on the other hand, might be gained by             anxiety (Cheng, 2010). In that study, it was found that various
time schedule presented by policymakers or real-time informa-               feelings of anxiety or stress might be due to reaching late to the
tion display. However, if none of them exist, or no precise                 destination.
information is provided, it could be gained from the experience of             So, it is expected for commuters to experience negative feelings
a commuter about the average arrival or departure of the public             due to the shortcomings of public transport.
transportation. In addition, delay by some studies has been
defined as the proportion of time that a transport does not arrive
                                                                            Importance of the transport’s reliability on commuters’
or depart from a station more than a certain time in minutes; for
                                                                            satisfaction. Factors impacting public transport commuting
instance, the arrival of the train more than 5 min in most Eur-
                                                                            satisfaction were evaluated (Cantwell et al., 2009). The results
opean countries would be considered late, while in the Nether-
                                                                            highlighted that the level of satisfaction for public transport users
lands this time is reduced to 3 min, and in Japan this time even
                                                                            would decrease for those who travel on crowded and unreliable
defined as 10–15 s (Yuan, 2006).
                                                                            services and those having long waiting times. So, it is expected to
   Delays are a major reason why commuters would be dissuaded
                                                                            have a link between the level of satisfaction and the shortcomings
from using public transportation. Even it has been shown that
                                                                            of delay.
transport stressors such as traffic congestion would result in
serious implications such as motivational deficiency (Evans et al.,
2007). Also, the commuting unreliability and delays have been               Relationship between commuters’ feelings and commuters’
shown to result in low efficiency in tired workers and cost in               behaviors. On the other hand, it has been highlighted that the
London at least 230 million pounds per annum (Cox et al., 2006).            commuter’s choice would be varied based on various environ-
As the result, railway companies and policymakers exert their               mental and conditions of commuters. The relationship between
efforts to avoid delays and improve punctuality. The less amount            psychological and situational factors on the commuter mode
of delay commuters face, the more tendency is expected for                  choice was evaluated (Collins and Chambers, 2005). The results
commuters to choose that service instead of other modes of                  highlighted that individual’s value on commuting behaviors
transport (Jansson, 1993). However, sometimes delay is inevitable           would be impacted by the environmental threat of cars and also
so it is important to know how the delay is translated to the               commuting behaviors would be influenced by commuters’ con-
commuters in terms of various psychological behaviors: It is                sideration of future consequences, and finally time and costs
expected that the impact of delay on the commuters’ perceived               contribute to the commuters’ choices. It has been also discussed
quality of service to be translated from emotional or physical              that understanding the psychological and situational factors
behaviors that the commuter might experience. Understanding                 would impact the commuter–transport choice and thus under-
those feelings would not only inspire the companies to prevent              standing those factors is important for shifting the commuters
those feeling but also could help them to find a solution to                 from cars to public transport (Collins and Chambers, 2005).
improve their services, even if they cannot reduce the amount                  Based on the above discussion it is reasonable to believe that
of delay.                                                                   there are various psychological impacts due to delay, and those
   In this research, delay acts as a stressor that results in stress and    feelings are expected to impact the perceived quality of the
other psychological impacts on commuters, so it is necessary here           transport for commuters, and their future behaviors. Also, it is
to clarify exactly what is meant by stress and stressor. According          expected for commuters to be varied based on various
to a definition provided by Lazarus (1998), stress could be defined           demographic or environmental characters, so it is important to
as a set of psychological and physiological reactions to noxious            account for that heterogeneity by considering random
agents, where the stressor is denoted as the agent, and stress is           parameters model.
denoted by the reaction. The underlying reason for stress or other             Despite the public transport importance, very limited studies
related psychological impacts could occur when the environment              have tried to link the psychological feelings that the commuters
requests an individual more than the capacity and resource                  might experience and satisfaction with rail transport. Also,
(Lazarus and Folkman, 1984); which also could be linked to the              regarding potential policy and practical implications, it is
underlying reasons behind the negative impacts of delay on                  important to have a clear vision regarding the impacts of the
commuters.                                                                  public transport shortcoming on the feelings of the commuters.
                                                                            Malfunctioned and bad experiences of transport are very
                                                                            common in transition economies, especially in developing
Literature review                                                           countries so a better understanding regarding the psychological
The main frameworks of this study could be divided into three               impact of the public transport shortcoming would expand our
topics. The first part of this study could be looked at from, I) the         understanding to resolve the issue.
relationship between the feelings that commuters would experi-
ence due to shortcomings of the transport; II) the relationship             Research questions
between commuters’ satisfactions and the transport reliability,             Based on the above discussion, it is expected that delay has a
and III) commuters’ behaviors and its relationships with                    negative impact on the perceived quality of public transport.

2                           HUMANITIES AND SOCIAL SCIENCES COMMUNICATIONS | (2021)8:190 | https://doi.org/10.1057/s41599-021-00865-z
HUMANITIES AND SOCIAL SCIENCES COMMUNICATIONS | https://doi.org/10.1057/s41599-021-00865-z ARTICLE
However, it is not clear what characteristics of delay might impact The ordinal logit model could be defined as latent regression
the perceived quality of service! The impact of delay could be seen approach as follows (Bhat and Pulugurta, 1998):
from various emotional or physical feelings that the commuters
Ci ¼ k only if ψ k1 Ψj−1, also to have the support to be entirely real
there would be a difference whether commuters with number Ψ1 = −∞, and Ψj = ∞. In addition, we set the variance as
flextime or those without (Lucas and Heady, 2002) var[εi|xi] = π3/3. From the above equation, for instance, based on
● Is the means of the random parameters’ distributions are the cumulative density function (CMF) for y = 1 we would have:
consistent across all individuals or varies based on some Prob[yi = 1|xi] = F(0−β′xi)−F(−∞−β′xi) = F(−β′xi). Now, the
specific observed characteristics? maximum likelihood could be used for maximization Eq. (4),
or log-likelihood (LL), as follows (Greene, 2003):
h i
Data and method LL ¼ ∑ni¼1 ∑Jj¼0 mij log F ψ j β0 xi F ψ j1 β0 xi
This section would be presented in two subsections. The first h i
subsection would present the method used in this study and the ¼ ∑ni¼1 ∑Jj¼0 mij log Fi;j Fi;j1
algorithm for model' parameters estimations, while the second ð5Þ
section would talk about the instruments.
where mij = 1 for yi = j, and 0 otherwise.
It should be noted that the threshold parameters Ψk in the
Method. In this study, the mixed ordinal logit model was used
above equations have been treated as nuisance parameters, which
due to the ordered nature of the response. Also, it was noted that
would be used for computation purposes. However, it has been
the standard regression models are problematic when the
argued in the literature review that in the psychology application
response is in an ordinal scale as the usual assumption for
if people are in strong agreement or disagreement, the cut point is
regression are not generally met (McKelvey and Zavoina, 1975).
expected to be tightly bunched in the middle of the distribution,
The following paragraphs would outline the formulation of the
while when the people are not willing to express their strong
mixed model, and then it would discuss the implementation of
feelings, the point is expected to be more widely dispersed
the mixed ordinal logit model in the next subsection. All the
(Daykin and Moffatt, 2002).
processes were implemented in R, and the process is straight-
Without considering the threshold the model could become
forward following the equations and matrices' preparations.
inconsistent, and the estimations would be impossible. As we are
In a random parameter or mixed model, random regression
dealing with simulated random draws, the maximum likelihood
parameters would vary across individual observations n based on
often is called simulated likelihood estimation. The “Model
some distribution. For a random parameter, the probability of
parameters estimation” section discusses the implemented
individual n choosing y with a density of g(β|θ), with parameter θ,
method of the ordered mixed logit model with correlated random
could be written as follows:
parameters. We considered both correlated and non-correlated
Z
random parameters due to similarity in the goodness of fit.
Pn yn jθ ¼ Pn yn β g βjθ dβ ð1Þ However, with a small modifications, the correlation across
β
random parameters would be ignored to come up with the
where the density of β is g(β|θ). As the integral does not have a standard ordered mixed model.
close form, we could assume, for instance, the normal distribution
for random parameters with mean and variance of μ and Σ, Model parameters estimation. It is worthy to discuss how the
respectively. βi ~ N(μ,Σ), where βi = μ + Σ−0.5vi, for vi~N(0,I), so parameters are estimated. Again, as the difference between the
we have syntaxes of accounting and not accounting for correlation across
Z 1 random parameters a were similar in most parts, this section
1 would discuss considered correlation across random parameters.
Pn yn jθ ¼ Pn yn jθ pffiffiffiffiffi exp 0:5ϑ2 dϑ ð2Þ
1 2π 1. Get the random and fixed parameters.
As the above integral also does not have a closed-form solution 2. Identify the categories of the response by considering the
with a method such as maximum-likelihood (ML) estimation, by unique categories. As, in this study, no respondent chose
using a good approximation for g(β|θ) the integral could be the last category of the considered dependent variable,
solved. That is through random draws from distribution. we have only four categories.
For the analysis, both thresholds and some coefficients might 3. A matrix would be created by J−2 columns, and rows to the
vary across the observations. The model contains J−n threshold number of observations.
parameters, where n is the number of response categories, with 4. Initial values would be given to the threshold parameters:
marginal utility coefficients of β. threshold 1 and 2. As we have four categories for our
HUMANITIES AND SOCIAL SCIENCES COMMUNICATIONS | (2021)8:190 | https://doi.org/10.1057/s41599-021-00865-z 3ARTICLE HUMANITIES AND SOCIAL SCIENCES COMMUNICATIONS | https://doi.org/10.1057/s41599-021-00865-z
response, we would have J−2 or 2 values for thresholds Table 1 Descriptive summary of important factors and
being saved as alpha. response.
5. There would be few more thresholds, which should be
aggregated by the above threshold. Those thresholds would
Variables Average Variance Min Max
not be updated and varied but would be considered in the
model. Those are –inf and +inf. Response
6. Fixed parameters would be saved as gamma. D5, the delay has a negative 1.490 0.504 1 4
impact on the quality of KTM
7. As here we would consider correlated random parameters,
Predictors
the process of creating random parameters would be Individual attributes
presented as βir = β + Lωir, where L is the lower triangular Education, higher than Diploma as 0.530 0.250 0 1
producing the covariate matrix of random parameters, and 0, others as 1
ωir would be r draws for i observation. For instance, by Age, 18 ≤ 25 as 0, others as 1 0.162 0.136 0 1
having two random parameters, there would be three values: A1, Gender, male as 1, female as 2 1.758 0.184 1 2
SDs of the parameters and their correlations. That result Physical feelings
would be a lower triangular matrix of 2 by 2 with initial C1, Neck pain 2.306 1.292 1 5
values of 0.1. Now based on the above equation the cross C4, muscle stiffness 2.230 1.220 1 5
product of the random numbers for the first observation C5, increased heartbeat 2.910 1.293 1 5
and lower triangular would be computed and would be C11, drawing sensation in body 1.977 1.060 1 5
added to the initial value of β. As we also have heterogeneity C14, feel nervous 3.126 5.91 1 5
C7, feel tired 1.871 0.892 1 5
in taste for some of the random parameters, for that
Psychological feelings
predictor there would be heterogeneity based on βir = β + B3, Disgust 1.873 0.971 1 5
πsi + Lωir. In other words, the resultant value of above as βir, B4, feel anxious 1.992 1.040 1 5
one more time would be added by πsi. Where the fixed effect
of the parameters is π, and the initial values of the
heterogeneity is si.
8. The cross-product of initial values of fixed parameters and It was hypothesized in this study that the direct questions of
their vectors would be saved as ZB. the impact of various feelings on the quality of the rail transport
9. Now, the two items, (βir. Xb) and fixed effects (ZB), would would result in possible arbitrary responses of the commuters,
be summed up, integral, and the maximum likelihood and even leaving those options blank. One of the reasons could be
would be conducted on the sum values of the two: index = due to the hardship of questioning the impacts of various feelings
xb + ZZ. on the quality of rail transport. Although indirect questionings of
10. Now moving to Eq. (5). First T = threshold[y + 1]−index instruments have been extensively used in other social studies,
and TT = threshold[y]−index would be created. this study used indirect questioning due to preventing imposition
11. Using the cumulative density function (CMF) for the above of hardship in answering questions on the respondents. Indirect
equation, F(T)−F(TT), and dividing by R would be saved as questioning has been used extensively in the literature. For
log-likelihood Pi ¼ R1 ∑Rr¼1 Pir . instance, an indirect question was used to detect intimate partner
12. Maximum-likelihood function based on Gradient and violence in an instrument’s application (Fulfer et al., 2007).
Hessian would be employed to find the optimum values In this study, the instruments were distributed at the station of
of the parameters maximizing the log-likelihood. Serdandg, which is one of the main stations of Keretapi Tanah
Melayu (KTM). The surveys were distributed during off-peak
hours from 4 to 7 p.m. to be consistent in our evaluation.
The instruments. A total of 396 fully answered responses were Instruments were translated into the local language, Malay, by a
collected and considered for the analysis. Most of the respon- Malaysian Ph.D. student in the field of education. The
dents were female, college students, having a higher education of instruments had an introduction explaining the objective of the
at least a diploma, means of 0.530 and 1.7 for education and study, and various sections of the instruments. The respondents
gender, respectively (see Table 1). Also, most of the respondents were requested to leave the instruments blank if they are not
belong to the age group of 15–25, mean of 0.162. In sections interested. It should be noted that no random sampling was
B–D the respondents were asked on 5-scale Likert question, implemented in this study.
where the scale had the following alternatives: strongly agree (as The instruments had 4 parts: background (9 questions),
1), agree (2), undecided (3), disagree (4), strongly disagree (5). psychological effects (4 questions), physical effects (14 questions),
For instance, based on Table 1, feeling tired and disgust were and general questions (5 questions). All the questions except for
some of the feelings that respondents agree the most to the first part were based on a 5-scale question type. It was noted
experience while experiencing delay for that type of rail trans- that due to the satisfying behavior of respondents, some of the
port. The initial examination of the data reveals that as the responses would result in incomplete or biased information
expected overwhelming majority of the respondent rated the retrieval (e.g. choosing the first response alternative) or no
impact of delay very negatively and in favor of various emotional information retrieval (Krosnick, 1991). A solution has been
or physical feelings. proposed by giving an alternative of “I do not know” or
In the instruments, the travelers were asked to indicate to what “Undecided” instead of reporting an opinion. As a result, we
extent they agree they experience various emotional or physical incorporated in our instruments an alternative of “undecided”.
feelings while facing the delay of the train. On the same scale, they An undecided answers could be considered as a middle response
were asked how much they agree that delay would impact the (Groothuis and Whitehead, 2002). To evaluate the feelings that
quality of the rail transport. So various feelings were used as a the commuters might feel due to delay, the questions were
proxy for the delay, and then those feelings were used as presented to the respondent like “I feel angry when I face a delay
predictors for the degree of belief about the impacts of delay on of KTM” and the respondent would answer on a scale of 1–5,
the quality of the rail transport. from 1—strongly agree to 5—strongly disagree.
4 HUMANITIES AND SOCIAL SCIENCES COMMUNICATIONS | (2021)8:190 | https://doi.org/10.1057/s41599-021-00865-zHUMANITIES AND SOCIAL SCIENCES COMMUNICATIONS | https://doi.org/10.1057/s41599-021-00865-z ARTICLE
and our explanatory variables are various psychological feelings
and demographic characteristics that the commuters experience
while experiencing a delay.
Out of the incorporated variables (see Fig. 1), six physical (neck
pain, muscle stiffness, increased heartbeat, drawing sensation in
the body, feeling nervous and feeling tired), and two psycholo-
gical factors (feeling disgusted and anxiety) were found to be
important in the prediction of the perceived quality of KTM due
to delay (see Table 2). In addition, all interaction terms, and
initially the possibility of all variables to be random were con-
sidered in this study. Accounting for interaction is important as
in case of the presence of correlation terms, not considering those
terms, and interpreting just the main effects, would result in
erroneous interpretation of the main effects. In other words, the
Fig. 1 List of all questions included in parts B and C of the instruments. individual main effects cannot and should not be considered
A: psychological feelings that commuters might experience due to delay, without considering their interaction terms.
B: physical feelings that commuters might experience, quality of a service: As discussed in a previous section, due to almost similar pro-
would be the response. cess for estimating the standard mixed ordinal logit model, and
the model considered correlation across random parameters, the
The physical section of the instruments was based on the results of both models are presented in Table 2. In other words,
Cohen–Hoberman inventory of physical symptoms (CHIPS) and based on the previous subsection description while for cor-
(Cohen and Hoberman, 1983). That is a list of 39 common related random parameters we have βir = β + Lωir, the value
physical symptoms highlighting the relationship between negative would be changed for the standard model to βir = β + σωir, where
life stress, and various physical symptomatology. Those include σ accommodate standard deviation of a random parameter. Also,
factors such as back pain, diarrhea, and headache. The factors the goodness of fit based on Akaike information criterion (AIC) is
were filtered to only 14 due to the expected impacts of delay based almost identical for both models so due to simplicity of the
on those feelings, see C part of Fig. 1. standard random model and a slight improvement in model fit,
On the other hand, various sources were used for the design of the discussion would be based on model A, non-correlated ran-
psychological aspects of instruments. For instance, a self-report dom parameter.
measure of stress was developed and tested (Greller and Parsons,
1988). The scale includes various physiological and psychological
descriptors. Psychological factors such as being angry, nervous, Interaction terms. The subsection would answer the questions of
and stress. Also, some of the physical factors included a stiff neck “Are various commuters with different demographic character-
and feeling tired. A study was conducted to illustrate the istics perform similarly in response to delay and sense of satis-
capability of a cognitive-motivational-relational theory for faction?” or “Are their significant interaction terms between
predicting emotions (Lazarus, 1991). In that study, 15 different commuters with different characteristics?”
emotions were identified including negative emotions such as Various personal characteristics such as age, and personality
anger, anxiety, sadness, and disgust. We implemented a similar type play a major role in explaining the source of stress level
feeling for section, B part of Fig. 1. (Barling et al., 2004). So, we considered various demographic
Again, one of the reasons behind the indirect connection was characteristics in our instruments. As can be seen from Table 2,
an associated difficulty of directly connecting various feelings to there is a significant three-term interaction term between age,
the quality of the transport. For instance, it might be awkward or gender, and education. For interpretation of the model, all main
challenging to ask the respondents, for instance, “feeling of a effects, two-term interaction terms, and three-term interaction
headache due to delay negatively impact the quality of rail terms should be considered. The interaction is expected, some-
transport”. So, first, we translated the impact of delay into how, due to the nature of the study: female commuters in
various emotional and physical feelings, and then their Malaysia are expected to be more educated. The second
transformed effects were linked to the quality of the transport. interaction, which was considered and found to be important is
All included feelings of the instrument in sections C and B are the interaction between C1 (neck pain) and C5 (increased
included in Fig. 1. heartbeat). The results indicate that these two items work
Finally, it should be noted that another study in the literature together in impacting the perceived quality of rail transport due
review used a similar case study, which we used in the current to delay.
manuscript. Rail passenger crowding was evaluated with the help
of factor analysis and structural equation modeling (SEM) (Mohd Random parameters. This section is set forward to see if there is
Mahudin et al., 2012). The study came up with an instrument to a significant heterogeneity across the commuters in response to
capture crowding and links it with an experience of feeling stress delay and consequently their perceived satisfaction about the rail
and exhaustion. Feeling irritable, stressed, frustrated, tense, and transport.
unpleasant were some of the factors that were considered in It should be noted that although a slight uncertainty is
that study. associated with random parameter of C14 (p-value = 0.1), the
results of goodness of fit, AIC, highlighted that inclusion of C14
Results as random would result in a slight improvement in the model fit
All the psychological aspects being considered in this study are (638 for model A, versus 639 for not considering C14 as random).
based on the recommended feelings, which could be due to stress, It should also be mentioned that normal distribution considered
in the literature. After identifying the feelings based on delay, a for both random parameters. The randomness of variables C7
question in the last section of the questionnaire also asked to see and C14 could be related to the fact that there are differences in
how that delay impacts the quality of the KTM. Our dependent reacting to delay across individuals (Cleary, 1987). In other
variable is the perceived impact of delay on the quality of KTM, words, delay does not always have the same impact on the
HUMANITIES AND SOCIAL SCIENCES COMMUNICATIONS | (2021)8:190 | https://doi.org/10.1057/s41599-021-00865-z 5ARTICLE HUMANITIES AND SOCIAL SCIENCES COMMUNICATIONS | https://doi.org/10.1057/s41599-021-00865-z
Table 2 Models parameters estimations for perceived quality of the rail transport.
A: Non-correlated random parameter model B: Correlated random parameters model
Estimate Estimates Error terms p-value Estimates Error terms p-value
Threshold.1 2.9521 0.558HUMANITIES AND SOCIAL SCIENCES COMMUNICATIONS | https://doi.org/10.1057/s41599-021-00865-z ARTICLE
On the other hand, that difference in commuters’ perception makers cannot reduce the amount of delay that a service would
and view about the circumstances would result in evaluation of provide, for instance, by knowing anger, or interaction of neck
delay differently, so there would be varied degree of feelings due pain and increased heartbeat are the translated impact of delay on
to variations in mind interpretations regarding the circumstances: the perceived quality of their services, they could provide an
while some commuters having a higher degree of being ner- environment for commuters to relieve the impact of that psy-
vousness or tiredness others have a lower degree of those factors. chological feeling. That might be achieved, for instance, by pro-
So, that is why our results highlighted commuters’ feeling viding a better environment. Example, in terms of shelter or
regrading being nervous and being tired are random in shaping bench type at the station, for the service so passengers would wait
the perceptions regarding the quality of the transport. for a rail transport comfortably and with minimal negative psy-
On the other hand, as noted by Levy et al. (2007), mindset or chological feelings.
believes are expected to be changed based on individuals’ char- Based on the identified results, it is found that commuters’
acteristics. So, our result about the impact of feeling of tiredness reaction to delay is dependent on the specific environmental and
on the perceived quality of delay could be linked to that theory, demographic characteristics. So, while some commuters react to
which showed the impact of feeling of tiredness would be varied the shortcoming of transport delay mildly, others react more
based on commuters’ gender. In other words, the heterogeneity severely. As discussed, for instance, the three terms interaction
across commuters’ characteristics of tiredness could be modeled terms highlight the relationship between commuters in terms of
based on commuters’ characteristics of gender. age, gender, and education. The interaction terms have important
Additionally, while there are heterogeneities across commu- implications for policy makers and especially for the future stu-
ters’ feelings of being nervous or tired, there are more con- dies to take into account those terms. For instance, the three
sistency across commuters’ feelings of being anxious, disgust, terms interaction terms highlighted that especially the negative
drawing sensation in body, and having muscle stiffness. That feeling of delay is aggregated for higher-age commuters. Thus
highlight regardless of the perceived judgment of the mind more efforts are needed to reach out to the group at higher risk to
about delay, in a similar manner, commuters believe that they provide incentive and more information regarding the condition
have increased feelings of the above while judging the quality of of the rail transport. Especially discount might be provided for
the rail transport. that special group.
Finally, it was found that the reaction of the mindset of the It should be noted that based on the mindsponge theory, the
commuters in response to the delay could be defined as an minds’ multi-filtering processes would help individuals overcome
interaction term between neck pain and increased heartbeat, the challenge of the information flood by considering only
instead of their sole main effects. In other words, the commuters’ appropriate values and worthy opportunities (Vuong et al., 2014;
reactions to the delay based on the judgment regarding the cir- Vuong and Napier, 2015). So, due to lack of trust between
cumstances would impact commuters in terms of the neck pain commuters and policy makers, it is likely even by providing the
and heartbeat simultaneously. Moving to the three term inter- real-time information regarding the arrival of the train, the
action terms of age, gender, and education. These factors could be commuters would filter out the provided information due to
considered as types of commuters’ characteristics shaping their mistrust. So, the policy makers should take a realistic and trust-
perception regarding the circumstances and their threshold. The worthy step by giving the commuters the trust they need so they
reason behind interaction terms could be due to the fact that, for can digest and trust the information to adjust their expectation
instance, female commuters are expected to be more educated for sustaining less stress, and consequently having a higher
and younger. satisfaction with the transport.
Finally, the mindset expectation itself would be derived from
the individuals’ expectations about themselves and others
Limitations. The limitations of this study could be summarized
(Goldstein and Brooks, 2007). So, recommendation could also be
as follows. First, this study did not control for equal population
given to the commuters who frequently experience delay so their
subgroups of respondent. For instance, the majority of the
expectations could be adjusted. It could be recommended that
respondent are weighted toward female and younger commuters.
the commuters should be reminded that mostly they are not in
So, the result should be interpreted by caution. Second due to
control of certain factors and environment. Accepting that fact
extreme negative impacts of the transport, some respondents’
would relieve the tremendous psychological and physical
feelings might persuade them to respond to the questions in a
impacts of the delay that the commuters would experience.
more extreme way. Although that factor could not be directly
Although that might not seem an optimal scenario, but if there
identified, that could be taken into consideration while inter-
would be no immediate solution to the problem that seems one
preting the results. The extreme responses could be observed
of the viable solutions.
from the descriptive statistics of the responses being skewed to
the strongly agree.
However, given the unique and extreme conditions of the case Data availability
study and the fact that we had enough observations for the The data may be provided based upon an appropriate request.
minority groups, the limitations could be considered as
acceptable, but more studies are needed to reinvestigate the Received: 1 April 2021; Accepted: 14 July 2021;
findings of this study.
Conclusion
The findings of this study would provide an opportunity for the References
policy makers to understand the feelings that the commuters Barling J, Kelloway EK, Frone MR (2004) Handbook of work stress. Sage
might experience during waiting, and how those feelings would publications.
Bhat CR, Pulugurta V (1998) A comparison of two alternative behavioral choice
impact their services. It is known that feelings are likely to be mechanisms for household auto ownership decisions. Transp Res Part B 32
induced due to lack of control over the circumstances (Friendly, (1):61–75
2013). Also, the mindset could be changed or adopted to the Cantwell M, Caulfield B, O’Mahony M (2009) Examining the factors that impact
changing environment (Levy et al., 2007). So even if the policy public transport commuting satisfaction. J Public Transp 12(2):1
HUMANITIES AND SOCIAL SCIENCES COMMUNICATIONS | (2021)8:190 | https://doi.org/10.1057/s41599-021-00865-z 7ARTICLE HUMANITIES AND SOCIAL SCIENCES COMMUNICATIONS | https://doi.org/10.1057/s41599-021-00865-z
Cheng Y (2010) Exploring passenger anxiety associated with train travel. Trans- Ohmori N, Hirano T, Harata N, Ohta K (2004) Passengers’ waiting behavior at bus
portation 37(6):875–896 stop. In: Wang KCP, Xiao, G (eds) Proceedings of the second International
Cleary PD (1987) Gender differences in stress-related disorders. Gender Stress 39–72. Conference on Transportation and Traffic Studies, ICTTS 2000, Beijing,
Cohen S, Hoberman HM (1983) Positive events and social supports as buffers of China, July 31–August 2, 2000.
life change stress 1. J Appl Soc Psychol 13(2):99–125 Sainsbury P, Gibson JG (1954) Symptoms of anxiety and tension and the
Collins CM, Chambers SM (2005) Psychological and situational influences on accompanying physiological changes in the muscular system. J Neurol
commuter-transport-mode choice. Environ Behav 37(5):640–661 Neurosurg Psychiatry 17(3):216
Cox T, Houdmont J, Griffiths A (2006) Rail passenger crowding, stress, health and Schultz PW, Zelezny L (1999) Values as predictors of environmental attitudes: evi-
safety in Britain. Transp Res Part A 40(3):244–258 dence for consistency across 14 countries. J Environ Psychol 19(3):255–265
Daykin AR, Moffatt PG (2002) Analyzing ordered responses: a review of the Vuong QH (2016) Global mindset as the integration of emerging socio-cultural
ordered probit model. Underst Stat 1(3):157–166 values through mindsponge processes. In: Global mindsets: exploration and
Evans GW, Brauchle G, Haq A, Stecker R, Wong K, Shapiro E (2007) Young chil- perspectives. pp. 109–126.
dren’s environmental attitudes and behaviors. Environ Behav 39(5):635–658 Vuong QH, Napier NK (2015) Acculturation and global mindsponge: an emerging
Friendly FW (2013) Due to circumstances beyond our control… Random House. market perspective. Int J Intercult Relat 49:354–367
Fulfer JL, Tyler JJ, Choi NJ, Young JA, Verhulst SJ, Kovach R, Dorsey JK (2007) Vuong QH, Napier NK, Vu H, Nguyen MC, Tran TD (2014) Measuring corporate
Using indirect questions to detect intimate partner violence: the SAFE-T innovation capacity: experience and implications from i2Metrix imple-
questionnaire. J Interpers Violence 22(2):238–249 mentation in Vietnam. ASEAN J Manag Inf 1(1):1–17
Goldstein SE, Brooks RB (2007) Understanding and managing children’s classroom Yuan J (2006) Stochastic modelling of train delays and delay propagation in sta-
behavior: creating sustainable, resilient classrooms. John Wiley & Sons, Inc. tions. Eburon Uitgeverij BV.
Greene WH (2003) Econometric analysis. Pearson Education.
Greene WH, Hensher DA (2010) Modeling ordered choices: a primer. Cambridge
University Press. Competing interests
Greller M, Parsons CK (1988) Psychosomatic complaints scale of stress: measure The authors declare no competing interests.
development and psychometric properties. Educ Psychol Meas 48(4):1051–1065
Groothuis PA, Whitehead JC (2002) Does don’t know mean no? Analysis of’don’t
know’responses in dichotomous choice contingent valuation questions. Appl Declaration of helsinki
Econ 34(15):1935–1940 The survey strictly conforms to the World Medical Association (WMA) Declaration of
Jansson K (1993) Optimal public transport price and service frequency. J Transp Helsinki.
Econ Policy 33–50.
Krosnick JA (1991) Response strategies for coping with the cognitive demands of
attitude measures in surveys. Appl Cogn Psychol 5(3):213–236
Additional information
Correspondence and requests for materials should be addressed to M.R.
Lambert E, Straznicky N, Eikelis N, Esler M, Dawood T, Masuo K, Schlaich M,
Lambert G (2007) Gender differences in sympathetic nervous activity:
Reprints and permission information is available at http://www.nature.com/reprints
influence of body mass and blood pressure. J Hypertens 25(7):1411–1419
Lazarus RS (1998) The stress and coping paradigm. Fifty years of the research and
Publisher’s note Springer Nature remains neutral with regard to jurisdictional claims in
theory of RS Lazarus: an analysis of historical and perennial Issues. pp.
published maps and institutional affiliations.
182–220.
Lazarus RS (1991) Progress on a cognitive-motivational-relational theory of
emotion. Am Psychol 46(8):819
Lazarus RS, Folkman S (1984) Stress, appraisal, and coping. Springer publishing
company. Open Access This article is licensed under a Creative Commons
Levy O, Beechler S, Taylor S, Boyacigiller NA (2007) What we talk about when we Attribution 4.0 International License, which permits use, sharing,
talk about ‘global mindset’: managerial cognition in multinational corpora- adaptation, distribution and reproduction in any medium or format, as long as you give
tions. J Int Bus Stud 38(2):231–258 appropriate credit to the original author(s) and the source, provide a link to the Creative
Lucas JL, Heady RB (2002) Flextime commuters and their driver stress, feelings of Commons license, and indicate if changes were made. The images or other third party
time urgency, and commute satisfaction. J Bus Psychol 16(4):565–571 material in this article are included in the article’s Creative Commons license, unless
McKelvey RD, Zavoina W (1975) A statistical model for the analysis of ordinal indicated otherwise in a credit line to the material. If material is not included in the
level dependent variables. J Math Sociol 4(1):103–120 article’s Creative Commons license and your intended use is not permitted by statutory
Mees P (2000) A very public solution: transport in the dispersed city. regulation or exceeds the permitted use, you will need to obtain permission directly from
Mohd Mahudin ND, Cox T, Griffiths A (2012) Measuring rail passenger crowding: the copyright holder. To view a copy of this license, visit http://creativecommons.org/
scale development and psychometric properties. Transp Res Part F 15 licenses/by/4.0/.
(1):38–51
Nguyen M (2021) Suicidal ideation and behavior rethinking: the mindsponge
approach. OSF Preprints, p. 13. © The Author(s) 2021
8 HUMANITIES AND SOCIAL SCIENCES COMMUNICATIONS | (2021)8:190 | https://doi.org/10.1057/s41599-021-00865-zYou can also read