THE IMPACT OF THE SARS-COV-19 PANDEMIC ON THE GLOBAL GROSS DOMESTIC PRODUCT
←
→
Page content transcription
If your browser does not render page correctly, please read the page content below

International Journal of
               Environmental Research
               and Public Health

Article
The Impact of the SARS-CoV-19 Pandemic on the Global Gross
Domestic Product
Piotr Korneta * and Katarzyna Rostek

                                          Faculty of Management, Warsaw University of Technology, 02-524 Warszawa, Poland;
                                          katarzyna.rostek@pw.edu.pl
                                          * Correspondence: piotr.korneta@pw.edu.pl

                                          Abstract: The rapid, unexpected, and large-scale expansion of the SARS-CoV-19 pandemic has led to
                                          a global health and economy crisis. However, although the crisis itself is a worldwide phenomenon,
                                          there have been considerable differences between respective countries in terms of SARS-CoV-19
                                          morbidities and fatalities as well as the GDP impact. The object of this paper was to study the
                                          influence of the SARS-CoV-19 pandemic on global gross domestic product. We analyzed data relating
                                          to 176 countries in the 11-month period from February 2020 to December 2020. We employed SARS-
                                          CoV-19 morbidity and fatality rates reported by different countries as proxies for the development
                                          of the pandemic. The analysis employed in our study was based on moving median and quartiles,
                                          Kendall tau-b coefficients, and multi-segment piecewise-linear approximation with Theil–Sen trend
                                          lines. In the study, we empirically confirmed and measured the negative impact of the SARS-CoV-19
                                          pandemic on the respective national economies. The relationship between the pandemic and the
                                          economy is not uniform and depends on the extent of the pandemic’s development. The more intense
                                the pandemic, the more adaptive the economies of specific countries become.


Citation: Korneta, P.; Rostek, K. The     Keywords: SARS-CoV-19; pandemic; crisis management; GDP; gross domestic product; multi-
Impact of the SARS-CoV-19 Pandemic        segment Theil–Sen
on the Global Gross Domestic
Product. Int. J. Environ. Res. Public
Health 2021, 18, 5246. https://
doi.org/10.3390/ijerph18105246            1. Introduction
                                                The SARS-CoV-19 pandemic has rapidly spread around the world and has posed
Academic Editors: Dimitris Zavras
                                          significant threats to public health, as well as social and economic standing of many coun-
and Paul B. Tchounwou
                                          tries. The unexpected onset of the global health crisis caused many scholars to change
                                          their research domains towards pandemic-related areas. A significant number of studies
Received: 29 March 2021
Accepted: 8 May 2021
                                          have already been conducted in terms of the medical aspects of the coronavirus-2019,
Published: 14 May 2021
                                          including the understanding of coronavirus-2019 pathogenic mechanism [1], its transmis-
                                          sion routes [2], and different patterns of symptom development [3–6]. Several researchers
Publisher’s Note: MDPI stays neutral
                                          have already identified obesity; ageing; and comorbidities such as cardiovascular diseases,
with regard to jurisdictional claims in
                                          cancers, and diabetes as risk factors in SARS-CoV-19 patients [7–10]. The SARS-CoV-19
published maps and institutional affil-   fatality rate is estimated at around 4% of infected patients but varies between respective
iations.                                  countries from 0 to 20% [11,12]. Such a large range of fatality discrepancies might result
                                          from different demographic, economic, and political variables specific to different coun-
                                          tries [12]. Finally, it is noteworthy that thanks to the extensive work performed by scientists
                                          and pharmaceutical companies, the vaccination process is already underway around the
Copyright: © 2021 by the authors.
                                          world [13].
Licensee MDPI, Basel, Switzerland.
                                                As research in the healthcare perspective is starting to yield significant effects, it is
This article is an open access article
                                          now time to focus our attention on the economy and the significant consequences the
distributed under the terms and           pandemic has had in this context. A number of scholars have already studied the impact of
conditions of the Creative Commons        the global health crisis on financial markets whose sharp fluctuations during the pandemic
Attribution (CC BY) license (https://     have led to confusion and uncertainty among investors [14–16]. Results reported by other
creativecommons.org/licenses/by/          researchers indicate that the SARS-CoV-19 pandemic has changed consumer behaviors [17].
4.0/).                                    The first papers on the impact of the SARS-CoV-19 pandemic on the condition of the

Int. J. Environ. Res. Public Health 2021, 18, 5246. https://doi.org/10.3390/ijerph18105246                 https://www.mdpi.com/journal/ijerph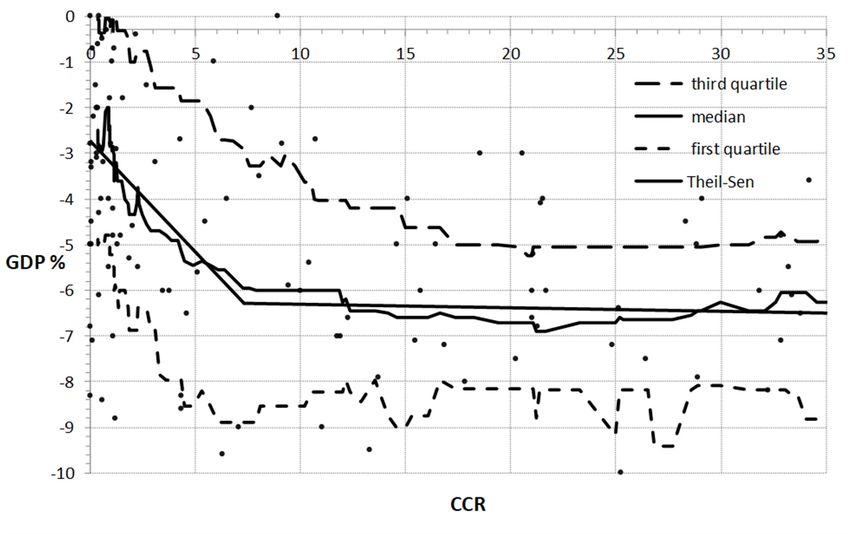
Int. J. Environ. Res. Public Health 2021, 18, 5246                                                                                2 of 12

                                        healthcare industry have also already appeared. It has been claimed that the pandemic has
                                        had both positive and negative effects on respective branches of the healthcare industry,
                                        but the latter are nonetheless predominant [18]. The negative impact of the pandemic on
                                        the economies of various countries has already been acknowledged in both local [19–21]
                                        and global terms [22–24]. The first gross domestic product (GDP) forecasts have also been
                                        already provided [25]. It is believed that the decline of global economy stems from two
                                        primary factors [23]. The first relates to the various forms of isolation imposed by the
                                        governments, such as social distancing, shutdowns of events and corporate offices, and
                                        lockdowns. The second is the uncertainty about how bad the situation can get. According to
                                        information provided by the International Monetary Fund (IMF), the global gross domestic
                                        product is estimated to have declined by around −3.5%. We should note, however, that
                                        the data provided by IMF indicate significant discrepancies between economic effects
                                        observed in respective countries [26]. Such differences may result from two major factors.
                                        Firstly, the degree to which the economies of specific countries have been affected by the
                                        pandemic. This can be measured relative to SARS-CoV-19 morbidity and fatality rates. The
                                        second factor relates to the various restrictions introduced in particular countries [27,28],
                                        availability of public aid [29,30], and interconnections developed between the economies
                                        of various countries during the pandemic [31,32].
                                             Since 2020 is already over and real data reflecting changes in the global GDP are now
                                        available, scientists can commence studies in this area. The objective of our paper was to
                                        consider the impact of the SARS-CoV-19 pandemic on national economies. We selected
                                        SARS-CoV-19 morbidity and fatality rates as viable proxies of pandemic development in
                                        specific countries, while GDP fluctuations served as a measure of the economy’s condition.
                                        In order to achieve the objective of the paper, we formulated the following two hypotheses:

                                        H1: There is a negative correlation between the SARS-CoV-19 pandemic development and GDP growth.
                                        H2: The relationship between the pandemic and GDP fluctuations is not a linear one.

                                             The first of the formulated hypotheses is based on the postulates of other schol-
                                        ars [22–24] who reported on the negative effects of the pandemic on the global economy.
                                        The second results from the assumption that the actions taken by governments might
                                        affect the severity of the impact that the pandemic has had on the economies of respective
                                        countries [27–32]. To our best knowledge, this study is the first to explore correlations
                                        between SARS-CoV-19 morbidity and fatality rates on the one hand, and the economies
                                        of specific countries on the other. Notably, the objective of this paper was not to analyze
                                        the sources of morbidity and fatality rates discrepancies between respective countries, but
                                        rather to study how such differences affect their economies.
                                             The paper analyzed data relating to 176 countries from six different continents in
                                        a 11-month period from February 2020 to December 2020. Because of significant data
                                        dispersion, we had to use robust statistical methods in our analysis. We employed moving
                                        medians and quartiles to determine the form of the relationship between the degree of
                                        pandemic development and the change of gross domestic product in specific countries, in
                                        their respective ranges. We employed the Kendall tau-b to determine the significance of
                                        correlations. Next, we calculated multi-segment Theil–Sen linear approximations to fit the
                                        obtained relations.
                                             The rest of the paper is structured in the following way: In Section 2, research methods
                                        and their different components such as the database and sample of observations, variables,
                                        and design of the study are provided. Section 3 presents results derived from empirical
                                        data. Section 4 provides the discussion and indicates limitations of our study. Finally, we
                                        provide conclusions and implications.
Int. J. Environ. Res. Public Health 2021, 18, 5246 3 of 12
2. Materials and Methods
2.1. Database and Sample of Observations
The data used in this study were obtained from two well recognized sources: the open
access database “Our World in Data” [33] and the “International Monetary Fund” [26].
From the latter, information on the change of gross domestic product in 2020 as of 7 March
2021 as compared to 2019 by different countries was obtained. The “Our World in Data”
database compiles official information relating to the SARS-CoV-19 pandemic, including
the number of reported new SARS-CoV-19 cases and deaths and PCR testing around
the world [33]. From this database, accessed on March 7, 2021, we obtained 59,787 daily
observations relating to 176 countries in a 11-month period from February 2020 to December
2020. Since this database provided no information regarding other countries, we were
not in a position to analyze all the countries worldwide. We aggregated the obtained
daily observations into 176 yearly observations. As a result, the studied figures comprised
82.5 million and 1.8 million diagnosed SARS-CoV-19 cases and reported deaths, respectively,
and related the same to the world population of 7.6 billion. Table 1 presents the breakdown
of observation samples used in the study, divided by continent, with the numbers of SARS-
COV-19 new cases and deaths reported and the respective number of countries considered.
Table 1. Description of the study sample by continent.
Continent New Cases Deaths Population Number of Countries
Africa 2,753,352 65,360 1,333,308,499 53
Asia 19,659,852 334,364 4,518,306,798 41
Europe 23,796,060 545,361 748,015,042 42
North America 23,013,002 512,367 575,845,728 20
Australia and Oceania 31,440 945 41,417,217 8
South America 13,194,159 362,651 430,457,607 12
Total 82,447,865 1,821,048 7,647,350,891 176
2.2. Variables
The variables used in this study, their acronyms, number of observations, and descrip-
tions of calculations are presented in Table 2. The first two of the studied variables are
SARS-CoV-19 case rate (CCR) and SARS-CoV-19 fatality rate (CFR). We calculated these
variables for each country. Since the populations of respective countries differ, we divided
newly diagnosed SARS-CoV-19 cases and deaths per 1000 residents. A similar approach
has already been used by other scholars [34]. We employed CCR and CFR variables to
measure the pandemic. The last of the variables selected for the study was the change in
gross domestic product relative increase (GDP). This ratio indicates the market value of
all goods and services produced in a specific period. Hence, the change in GDP relative
increase is a good proxy of the change in the world’s economy.
Table 2. Variables used in the study.
Acronym Variable Description
New SARS-CoV-19 cases reported in a country
CCR SARS-CoV-19 cases rate
per 1000 of the population of the country
New SARS-CoV-19 deaths reported in a country
CFR SARS-CoV-19 fatality rate
per 1000 of the population of the country
The difference of gross domestic product in 2020
GDP Gross domestic product and 2019, divided by gross domestic product in
2019, calculated for each country
2.3. Design and Data Analysis
Once the variables had been selected, we analyzed descriptive statistics. In the next
step of the study, we plotted the relationships between respective variables on graphs.Int. J. Environ. Res. Public Health 2021, 18, 5246 4 of 12
Visualization of the contemplated relationships was achieved by employing the moving
median and first and third quartiles in order to determine different correlations between
the considered variables in different ranges [35]. We calculated the median values for both
variables in a moving window containing data from 50 observations. The division of our
relations into segments helped us to identify ranges of pandemic intensity with different
effects on the GDP. In practice, it is important to identify what pandemic intensity has a
dominant effect on the change of global gross domestic product. The approach of dividing
infected individuals according to the 80/20 rule has been suggested to explain transmission
events during the SARS epidemic [36]. After identifying the relation between variables in
different ranges, we calculated the Kendall tau-b [37–39] coefficients. Kendall tau-b rank
correlation coefficient is widely used as a distribution-free measure of the strength and
direction of association that exists between two variables. In order to analyze data using
Kendall tau-b, one should measure two variables on an ordinal or continuous scale (interval
or ratio variables), and data should follow a monotonic relationship. We calculated Kendall
tau-b rank correlation coefficient in intervals where monotonic relationship was indicated
by the moving median and quartiles. Our variables thus satisfy the requirements of Kendall
tau-b, which can be used to determine the strength and direction of the association [40–43].
The values of Kendall’s rank correlation coefficient around 0.1 are typically obtained in the
analysis of meteorological data, where they vary between 0.012 and 0.159 [44]. Decision
about the statistical significance was made using empirical significance level (p-value)
compared to α = 5%. We used one-tailed Mann–Kendall test [41,42].
Next, we applied the multi-segment linear regression with the Theil–Sen robust lines
to characterize different relations between our independent and dependent variables in
different ranges [45]. This regression model was selected because it is resistant to the
effects of outliers and non-normality in residuals. The multi-segment model is the most
suitable choice if more than one regression relation is necessary to characterize different
relations that may occur in different regimes of explanatory variables. The nonparametric
estimate of the slope of the line, identified as the Theil–Sen (or Kendall–Theil or Sen)
slope in the literature, is calculated as the median of all possible pairwise slopes between
points [45–49]. The line intercept was calculated by using the median slope and the
median of the independent and dependent variables [47,49]. The multi-segment Theil–
Sen regression technique was comprehensively described by Granato [50] and has been
used by other researchers [50,51]. Furthermore, the Theil–Sen estimator is considerably
more accurate than non-robust simple linear regression, especially for heteroskedastic and
skewed data. It should also be noted that the Theil–Sen estimator provides better results
than the non-robust least squares method, even for normally distributed data [47]. Finally,
we obtained multi-segment piecewise-linear approximation to the studied relationships
between considered variables. The Theil–Sen procedure has already been used in other
studies in the fields of economy [51] and health [52,53].
3. Results
Presented in Table 3 are the descriptive statistics of the variables used in this study, cal-
culated for each country in the relevant period. On average, 15.749 (CCR) per 1000 persons
were infected with SARS-CoV-19 in 2020, and 76.819 was the maximum. Great differences
in mortality between respective countries are revealed in the min, median, and max values
of the SARS-CoV-19 fatality rate (CFR). The highest mortality of 1.739 deaths per 1000 peo-
ple was reported in San Marino, closely followed by Belgium, where the fatality rate in the
studied period reached 1.685 per 1000. The (arithmetic) mean of the GDP fluctuation was
−5.694 (%) and was negative in 153 countries, with only 23 states reporting positive values.Int. J. Environ. Res. Public Health 2021, 18, 5246 5 of 12
Table 3. Descriptive statistics.
Variable Mean SD Median Min Max Skewness Kurtosis
CCR 15.749 18.874 7.263 0.003 76.819 1.239 0.659
CFR 0.295 0.392 0.083 0 1.739 1.42 1.181
GDP −5.694 7.181 −5.1 −66.7 26.2 −3.271 30.415
Table 4 presents the results of statistical tests for the relationships between CCR, CFR,
and GDP in two identified ranges for each variable. We showed the Kendall tau-b values
with their p-values (one side). In the selected ranges, we performed linear approximation of
the studied relationships using the Theil–Sen procedure. The obtained values of Theil–Sen
slopes (m) and intercepts (b) are given in Table 4. This two-segment piecewise-linear
approximation well describes the considered relationships in the two identified ranges.
Table 4. Results of statistical tests using the Kendall tau-b of relations between CCR, CFR, and the
change in GDP relative increase (GDP) with Theil–Sen slopes (m) and intercepts (b) of trend lines
approximating these relations.
Kendall Theil–Sen
Variable Range Tau-B p m Slope b Intercept
Gross Domestic Product (GDP)
CCR 7 −0.0339 0.3231 −0.008 −6.2276
Gross Domestic Product (GDP)
CFR 0.2 −0.1421 0.0456 −1.3475 −5.8339
The scatterplot in Figure 1 was fitted with the multi-segment Theil–Sen regression
model. The number of segments, coefficient of regression lines, and the convergence points
were calculated and adjusted according to the procedure described by Granato [50]. The
two-line model, without discontinuity plotted on the scatterplot, was a good fit. One can
notice that this relationship differs considerably for the CCR variable up to 7 and above.
It can thus be well represented by two straight lines, i.e., by two-segment approximation.
The Kendall tau-b for the first of approximated lines (CCR < 7) amounts to −0.1274, which
confirms the negative trend. The low p-value, below 0.05, confirms that these results are
statistically significant. The slope of the approximated line is −0.4851. Such a high value of
the approximated slope indicates that the GDP is very sensitive to any changes of the CCR
variable in the studied range. The relationship between GDP and CCR in the second of
the identified ranges (CCR > 7) was statistically insignificant as the p-value was above 0.3.
These results are endorsed by the Theil–Sen trend line, which was flat (the slope was 0.008),
indicating that there was no relationships between CCR and GDP in the second range, i.e.,
for CCR above 7.
Figure 2 shows the relation between SARS-CoV-19 fatality rate (CFR) and GDP. As
can be seen, the contemplated relationship can be divided into two different ranges and
approximated with two straight trend lines. The first range comprised CFR observations
below 0.2. Here, the Theil–Sen trend line (m = −12.9928) was sharp and fast declining.
The relationship between CFR and GDP was negative. The Kendall tau-b coefficient was
−0.1401. This confirmed that this relationship was negative and statistically significant
(p-values below 0.05). The relation between CFR and GDP for GDP> 0.2 was well fitted by
the Theil–Sen straight line with the slope of m = - 1.3475 and the intercept b = −5.8339. This
result was endorsed by the Kendall tau-b, which was −0.1421. The results are statistically
significant with p = 0.0456.Public Health
Int. J.2021, 18,Res.
Environ. 5246Public Health 2021, 18, 5246 6 of 12
6 of 12
Figure 1. The relation between CCR and GDP with the moving median, first and third quartiles,
and two‐segment linear Theil–Sen approximation.
Figure 2 shows the relation between SARS‐CoV‐19 fatality rate (CFR) and GDP. As
can be seen, the contemplated relationship can be divided into two different ranges and
approximated with two straight trend lines. The first range comprised CFR observations
below 0.2. Here, the Theil–Sen trend line (m = −12.9928) was sharp and fast declining. The
relationship between CFR and GDP was negative. The Kendall tau‐b coefficient was
−0.1401. This confirmed that this relationship was negative and statistically significant (p‐
values below 0.05). The relation between CFR and GDP for GDP> 0.2 was well fitted by
the Theil–Sen straight line with the slope of m = ‐ 1.3475 and the intercept b = −5.8339. This
Figure result was endorsed
1. The relation byand
between CCR the Kendall
GDP with the tau‐b,
moving which wasand
median, first −0.1421. The results
third quartiles, are statistically
and two-segment linear
Figure
Theil–Sen 1. The relation between CCR and GDP with the moving median, first and third quartiles,
approximation.
significant with p = 0.0456.
and two‐segment linear Theil–Sen approximation.
Figure 2 shows the relation between SARS‐CoV‐19 fatality rate (CFR) and GDP. As
can be seen, the contemplated relationship can be divided into two different ranges and
approximated with two straight trend lines. The first range comprised CFR observations
below 0.2. Here, the Theil–Sen trend line (m = −12.9928) was sharp and fast declining. The
relationship between CFR and GDP was negative. The Kendall tau‐b coefficient was
−0.1401. This confirmed that this relationship was negative and statistically significant (p‐
values below 0.05). The relation between CFR and GDP for GDP> 0.2 was well fitted by
the Theil–Sen straight line with the slope of m = ‐ 1.3475 and the intercept b = −5.8339. This
result was endorsed by the Kendall tau‐b, which was −0.1421. The results are statistically
significant with p = 0.0456.
Figure 2. The relation between CCR and GDP with the moving median, first and third quartiles, and two-segment linear
Theil–Sen approximation.
Figure 2. The relation between CCR and GDP with the moving median, first and third quartiles,
and two‐segment4.linear Theil–Sen approximation.
Discussion
As already discussed and confirmed in the literature, the global health crisis caused
by coronavirus-2019 has negatively affected the world economy. This negative impact has
already been discussed at the levels of both local economies [19–21] and globally [22–24].
Several researchers have provided the very first approximations of the global economicInt. J. Environ. Res. Public Health 2021, 18, 5246 7 of 12
costs of the SARS-CoV-19 pandemic, which might total at around USD 2.7 trillion [54].
Other scholars note that the negative impact of SARS-CoV-19 on the economies has not
only caused GDPs to decline but has also increased the importing and exporting costs.
At the same time, it must be added that this negative impact varies greatly between
respective economy sectors, with tourism and domestic services losing the most, and
natural resources and agriculture being only negligibly affected. Reports also confirm
considerable differences between individual countries [55]. König and Winkler provided
the initial empirical evidence on the relationship between the SARS-CoV-19 pandemic
and the economic crisis. Their research was based on data from the first three quarters of
2020 relating to 42 countries, using simple ordinary least squares and panel fixed effects
regressions. They explained the link between the pandemic and the GDP by highlighting
two major factors. The first results from restrictive measures imposed by the governments
of different countries. Their results indicate that governmental restrictions lowered the
GDP growth in the same quarter, with noticeable improvement in GDP dynamics in the
following one. The second link between the pandemic and GDP is the health risk that leads
to voluntary social distancing, which, again, lowers the GDP. They measured the health risk
on the basis of fatality rates and provided initial empirical evidence suggesting that high
fatality rates contribute significantly to the negative growth rates [56]. In comparison with
the study by König and Winkler, our research was based on a considerably larger sample
(176 versus 42 countries), related to a longer period (full year instead of three quarters),
and employed a different econometric approach and databases. Our results are aligned
to postulates of other scholars and empirically confirm the negative impact of the SARS-
CoV-19 pandemic on the global economy. In our calculations, Kendall tau-B coefficients
confirmed the negative correlation between SARS-CoV-19 fatality rates and changes in the
GDP relative increase. The very low p-value (below 0.05) indicates that the obtained results
are robust. We also identified a negative relationship between SARS-CoV-19 infections rate
(CCR variable) and the decrease of gross domestic product. This relationship, however,
was only significant for CCR values below 7, i.e., up to 7 infections per 1000 people in 2020.
Therefore, the first of the formulated hypotheses, stating that there is a negative correlation
between the SARS-CoV-19 pandemic and GDP growth, has been corroborated.
The onset of the SARS-CoV-19 pandemic and efforts aimed at limiting its further
development were approached differently by decision makers in various countries. The
tools most frequently employed against the pandemic included isolation, quarantine, and
lockdown. In general, the more rapidly the pandemic developed in a country, the more
severe restrictions were introduced by the policymakers [27,28]. SARS-CoV-19 tests have
also been widely used in an effort to halt the pandemic development. Several researchers
have claimed that the expansion of the pandemic can be limited by increasing the testing
rate [57]. However, high costs and financial restraints caused the countries employ different
testing strategies [34,58,59]. The third tool employed to reduce the negative impact of the
SARS-CoV-19 pandemic on the economy entailed government programs supporting the
companies and citizens during periods of isolation and lockdowns [29,30]. Finally, sev-
eral scholars have also noted the development of interactions between different countries
during the pandemic [31,32]. Assuming that all the aforementioned actions might affect
the expansion of the pandemic, we formulated the second hypothesis, namely, that the
correlation between the pandemic and GDP fluctuations is not a linear one. We estimated that the
relationship between SARS-CoV-19 fatality rates and changes in the gross domestic product
relative increase can be well fitted with two straight lines, with slopes of −12.9928 and
−1.3475 and in the ranges below 0.2 deaths per 1000 (or up to 200 per 1 million) of the
population and above the same, respectively. This shows that the GDP falls by 0.013 per-
centage points with each death per 1 million people. Once the threshold of 0.2 deaths per
1000 people is exceeded, however, the gross domestic product becomes less sensitive to
new SARS-CoV-19 deaths and falls by only 0.0013 percentage points with each new death
per 1 million people. The relationship between gross domestic product and SARS-CoV-19
morbidity is similar, with the threshold of 7 new infections per 1000 people. Since theInt. J. Environ. Res. Public Health 2021, 18, 5246 8 of 12
slope of the approximated line was −0.4851, each new infected person per 1000 residents
reduced the GDP by 0.4581. Once the threshold of seven new infections is exceeded, the
contemplated relationship becomes statistically insignificant (very high p-value Kendall
tau-B). Hence, the GDP change is considerably more sensitive to new SARS-CoV-19 deaths
than to infections. The two distinctly identified ranges in the relationship between GDP
and SARS-CoV-19 morbidity and fatality rates indicate that there is a threshold over which
countries manage to adapt to the pandemic. Due to this observation, our second hypothesis
must be accepted. The world economic crisis triggered by the SARS-CoV-19 pandemic is
a complex and multifaceted issue and differs from other economic slowdowns in recent
decades. This is because, additionally to the burden on the healthcare systems, the pan-
demic has directly resulted in the premature deaths of employees, large-scale workplace
absenteeism, productivity reduction, negative supply shocks, manufacturing activity slow-
down, global supply chain disruptions, and decimation of the tourism industry [60]. Given
the complexity of this crisis, a fraction of researchers employed a high-level, comprehensive
approach in their studies, while most of the others focused only on selected economy issues.
Al-Thaqeb et al. claim economic policy uncertainty plays a key role in understanding the
current crisis. They indicate that high uncertainty in terms of economic policy is associated
with adverse effects on households, corporations, and governments, which tend to delay
financial decisions due to the same reasons. This leads to lower consumption, lower loan
issuance, fewer investments, and higher unemployment. They also note that the effects of
political and regulatory uncertainty extend even to the commodity and crypto-currency
markets. [61]. Song and Zhou also acknowledge the fact that uncertainty plays a key role
in the current economic crisis. They draw attention to high periods prior to SARS-CoV-2,
resulting primarily from Chinese economy problems and slow recent growth; synchronized
global economy slowdown; de-globalization; and unfavorable macroeconomic settings,
including deflation [62]. Stiifanić et al. studied the impact of the SARS-CoV-19 pandemic
on crude oil prices and selected stock indexes: DJI, S&P 500, and NASDAQ. They employed
new SARS-CoV-19 infections as the independent variable. In terms of crude oil prices, they
identified uncertainty and supply shock increase in the global stocks of crude oil, which
led to price slumping. They also demonstrated the existence of a link between stock market
prices and the pandemic, indicating, however, that the movement of stock indexes does not
reflect the real situation in the economy but is mainly based on expectations and monetary
and fiscal incentives. [63]. Finally, other researchers studied the impact of the SARS-CoV-19
pandemic on selected industries, namely, travel, hospitality, sports, events, entertainment,
education, and finance. Their approximations were negative for each of the studied indus-
tries [64]. In our study, we focused on the question of how the SARS-CoV-19 pandemic has
affected the economies of 176 selected countries as a whole. Therefore, unlike other authors,
we did not study specific industries or selected economy ratios. Instead, we considered
the change in gross domestic product relative increase throughout the pandemic period
in the studied countries, which we considered to provide a good proxy for the condition
of economy as a whole. Our sample of countries and studied period were considerably
larger than those reported in previous studies. As a result of the above and due to the
robust statistical results, our findings provide global evidence on how the SARS-CoV-19
pandemic has affected the economies of respective countries.
The presented study has several limitations. Firstly, the sample for this study com-
prised observations relating to 176 countries. Hence, not all countries could be considered
in this study. Secondly, we calculated the change in the GDP for each country on the basis
of the initial calculations of 2020 GDP provided by the International Monetary Fund as of
7 March 2021. These variables might require minor adjustments. The aforementioned two
limitations might change the values of coefficients calculated in the study, but not our over-
all results. This is because our results were robust with low p-values (below 0.05). The final
limitation of this study results from the analyzed period. Since we studied observations
relating to only a single year, i.e., 2020, we are not in a position to conclude on the long-term
impact of the SARS-CoV-19 pandemic on the economies of the analyzed countries.Int. J. Environ. Res. Public Health 2021, 18, 5246 9 of 12
In this study, we identified the economies of the countries with regards to the SARS-
CoV-19 pandemic. We did not study the underlying reasons, which we consider to be rather
multifaceted in nature. Hence, further research into adaptation mechanism in the context
of the pandemic could prove interesting from the scientific point of view. In this paper, we
analyzed and identified global trends related to the pandemic and GDP fluctuations. To
this end, we ignored local differences, timing, and intensity of the pandemic. Although
such an analysis was not required for our study, we consider it to be a good indication for
further research. The final indication for the continuation of our research is to study the
long-term impact of coronavirus-2019 on the global economy.
5. Conclusions
The global health and economy crisis caused by coronavirus-2019 is unprecedented,
both in terms of its global dimension and the depth of its impact on the economy, society,
political and legal conditions, and even the environment. The severity of the aforemen-
tioned phenomena and various related factors continues to increase, while the pandemic’s
prolonged duration poses a very real risk of a global catastrophe. As a result, many re-
searchers and state policymakers have shifted the domains of their professional interests
towards the pandemic and its surrounding issues.
In this paper, we studied data relating to 176 countries in the pandemic period and
in the previous year. The objective of this paper was to study the impact of SARS-CoV-19
pandemic on national economies. Given the fact that at the time of writing this article real
data pertaining to GDP values worldwide have just been officially provided, our study
is the first or one of the first to analyze the impact of SARS-CoV-19 on the economies of
countries in the first year of the pandemic. We selected the SARS-CoV-19 morbidity and
fatality rates as proxies for the pandemic’s development and GDP fluctuations in 2020
and 2019 as representative of the state of economy. Firstly, we identified the negative
and statistically significant correlations between the SARS-CoV-19 morbidity and fatality
rates and GDP changes. Next, we determined that the studied relationships were not
linear, with the economies growing increasingly immune to the pandemic. The more
severe the development of the pandemic, the more adaptive to its negative effects the
economies eventually became. This finding is especially interesting as it shows that the
global economy can quickly adjust to fast-changing severe and negative conditions. Hence,
our results also demonstrate how the economies of the respective countries have been
developing immunity to the negative effects of coronavirus-2019. This has been due to
both governmental action and agility of companies.
Our results might have practical implications for policymakers. We identified and
econometrically measured the direct connection between the spread of the SARS-CoV-
19 pandemic, measured with new infections and fatality rates, and the change in gross
domestic product relative increase. Therefore, our results empirically confirm the intuitive
approach of many policymakers, who were the first to assume that the spread of the virus
should be contained and next the economic issues should follow.
Finally, it should be noted that our paper shows the possibility of applying the multi-
segment Theil–Sen model to disciplines such as healthcare and economics.
Author Contributions: Conceptualization, P.K. and K.R.; methodology, P.K.; validation, P.K. and
K.R.; formal analysis, P.K. and K.R.; data curation, P.K. and K.R.; writing—original draft preparation,
P.K. and K.R.; writing—review and editing, P.K. and K.R.; visualization, P.K. All authors have read
and agreed to the published version of the manuscript.
Funding: This research was funded/by IDUB against COVID-19 project granted by Warsaw Univer-
sity of Technology under the program Excellence Initiative: Research University (IDUB).
Institutional Review Board Statement: Not applicable.
Informed Consent Statement: Not applicable.Int. J. Environ. Res. Public Health 2021, 18, 5246 10 of 12
Data Availability Statement: The data used in this study were from the open access databases “Our
World in Data” and “International Monetary Fund” and can be found there. Further information on
data and materials used are available from the corresponding author on reasonable request.
Conflicts of Interest: The authors declare no conflict of interest.
References
1. Lopachev, A.V.; Kazanskaya, R.B.; Khutorova, A.V.; Fedorova, T.N. An Overview of the Pathogenic Mechanisms Involved in
Severe Cases of COVID-19 Infection, and the Proposal of Salicyl Carnosine as a Potential Drug for its Treatment. Eur. J. Pharmacol.
2020, 886, 173457. [CrossRef] [PubMed]
2. Jia, J.S.; Lu, X.; Yuan, Y.; Xu, G.; Jia, J.; Christakis, N.A. Population Flow Drives Spatiotemporal Distribution of COVID-19 in
China. Nature 2020, 582, 389–394. [CrossRef] [PubMed]
3. Huang, C.; Wang, Y.; Li, X. Clinical features of patients infected with 2019 novel coronavirus in Wuhan, China. Lancet 2020, 395,
497–506. [CrossRef]
4. Chen, N.; Zhou, M.; Dong, X. Epidemiological and clinical characteristics of 99 cases of 2019 novel coronavirus pneumonia in
Wuhan, China: A descriptive study. Lancet 2020, 395, 507–513. [CrossRef]
5. Wang, D.; Hu, B.; Hu, C. Clinical characteristics of 138 hospitalized patients with 2019 novel coronavirus-infected pneumonia in
Wuhan, China. JAMA 2020, 323, 1061–1069. [CrossRef]
6. Wu, Z.; McGoogan, J.M. Characteristics of and important lessons from the coronavirus disease 2019 (COVID-19) outbreak
in China. Summary of a report of 72314 cases from the Chinese center for disease control and prevention. JAMA 2020, 323,
1239–1242. [CrossRef]
7. Kang, S.J.; Jung, S.I. Age-Related Morbidity and Mortality among Patients with COVID-19. Infect. Chemother. 2020, 52,
154–164. [CrossRef]
8. Li, H.; Wang, S.; Zhong, F.; Bao, W.; Yipeng, L.; Lei, L.; Hongyan, W.; Yungang, H. Age-Dependent Risks of Incidence and
Mortality of COVID-19 in Hubei Province and Other Parts of China. Front. Med. 2020, 7, 190.
9. Qiurong, R.; Yang, K.; Wang, W.; Jiang, L.; Song, J. Clinical predictors of mortality due to COVID-19 based on an analysis of data
of 150 patients from Wuhan, China. Intensive Care Med. 2020, 46, 846–848.
10. Pettit, N.N.; Erica, L.; MacKenzie, J.; Ridgway, P.; Pursell, K.; Ash, D.; Patel, B.; Pho, M.T. Obesity is Associated with Increased
Risk for Mortality Among Hospitalized Patients with COVID-19. Obesity 2020, 28, 1806–1810. [CrossRef]
11. Rajgor, D.D.; Lee, M.H.; Archuleta, S.; Bagdasarian, N.; Quek, S.C. The many estimates of the COVID-19 case fatality rate. Lancet
Infect. Dis. 2020, 20, 776–777. [CrossRef]
12. Sorci, G.; Faivre, B.; Morand, S. Explaining among-country variation in COVID-19 case fatality rate. Sci. Rep. 2020, 10,
1–11. [CrossRef]
13. Hodgson, S.H.; Mansatta, K.; Mallett, G.; Harris, V.; Emary, K.R.W.; Pollard, A.J. What Defines an Efficacious COVID-19
Vaccine? A Review of the Challenges Assessing the Clinical Efficacy of Vaccines against SARS-CoV-2. Lancet Infect. Dis. 2020, 23,
9–10. [CrossRef]
14. Adekoya, O.B.; Oliyide, J.A. How COVID-19 drives connectedness among commodity and financial markets: Evidence from
TVP-VAR and causality-in-quantiles techniques. Resour. Policy 2021, 70, 101898. [CrossRef]
15. Zhang, D.; Hu, M.; Ji, Q. Financial markets under the global pandemic of COVID-19. Financ. Res. Lett. 2020, 36, 101528.
[CrossRef] [PubMed]
16. Youssef, M.; Mokni, K.; Ajmi, A.N. Dynamic connectedness between stock markets in the presence of the COVID-19 pandemic:
Does economic policy uncertainty matter? Financ. Innov. 2021, 7, 1–27. [CrossRef]
17. Yuan, X.; Li, C.; Zhao, K.; Xu, X. The Changing Patterns of Consumers’ Behavior in China: A Comparison during and after the
COVID-19 Pandemic. Int. J. Environ. Res. Public Health 2021, 18, 2447. [CrossRef]
18. Korneta, P.; Kludacz-Alessandri, M.; Walczak, R. The Impact of COVID-19 on the Performance of Primary Health Care Service
Providers in a Capitation Payment System: A Case Study from Poland. Int. J. Environ. Res. Public Health 2021, 18, 1407. [CrossRef]
19. Naumann, E.; Möhring, K.; Reifenscheid, M.; Wenz, A.; Rettig, T.; Lehrer, R.; Blom, A.G. COVID-19 policies in Germany and their
social, political, and psychological consequences. Eur. Policy Anal. 2020, 6, 191–202. [CrossRef]
20. Nath, H. Covid-19: Macroeconomic Impacts and Policy Issues in India. Space Cult. India 2020, 8, 1–13. [CrossRef]
21. Arndt, C.; Davies, R.; Gabriel, S.; Harris, L.; Makrelov, K.; Robinson, S.; Anderson, L. Covid-19 lockdowns, income distribution,
and food security: An analysis for South Africa. Glob. Food Secur. 2020, 26, 100410. [CrossRef] [PubMed]
22. Bagchi, B.; Chatterjee, S.; Ghosh, R.; Dandapat, D. Impact of COVID-19 on global economy. In Coronavirus Outbreak and the Great
Lockdown; Springer: Singapore, 2020; pp. 15–26.
23. Ozili, P.; Arun, T. Spillover of COVID-19: Impact on the Global Economy. SSRN Electron. J. 2020. [CrossRef]
24. Reinhart, C.; Reinhart, V. The pandemic depression: The global economy will never be the same. Foreign Aff. 2020, 99, 84.
25. Jena, P.R.; Majhi, R.; Kalli, R.; Managi, S.; Majhi, B. Impact of COVID-19 on GDP of major economies: Application of the artificial
neural network forecaster. Econ. Anal. Policy 2021, 69, 324–339. [CrossRef]
26. International Monetary Fund. Available online: https://www.imf.org/external/datamapper/NGDP_RPCH@WEO/OEMDC/
ADVEC/WEOWORLD (accessed on 7 March 2021).Int. J. Environ. Res. Public Health 2021, 18, 5246 11 of 12
27. Goolsbee, A.; Syverson, C. Fear, lockdown, and diversion: Comparing drivers of pandemic economic decline 2020. J. Public Econ.
2021, 193, 104311. [CrossRef] [PubMed]
28. Selby, K.; Durand, M.A.; Gouveia, A.; Bosisio, F.; Barazzetti, G.; Hostettler, M.; von Plessen, C. Citizen Responses to Govern-
ment Restrictions in Switzerland During the COVID-19 Pandemic: Cross-Sectional Survey. JMIR Form. Res. 2020, 4, e20871.
[CrossRef] [PubMed]
29. Bennedsen, M.; Larsen, B.; Schmutte, I.; Scur, D. Preserving Job Matches during the COVID-19 Pandemic: Firm-Level Evidence on the
Role of Government Aid; GLO Discussion Paper; EconStor: Berlin, Germany, 2020; p. 588.
30. Gordon, T.; Dadayan, L.; Rueben, K. State and local government finances in the COVID-19 era. Natl. Tax J. 2020, 73,
733–757. [CrossRef]
31. Hyun, J.; Kim, D.; Shin, S.R. The Role of Global Connectedness and Market Power in Crises: Firm-Level Evidence from the COVID-
19 Pandemic. Available online: https://www.researchgate.net/publication/343794415_The_Role_of_Global_Connectedness_
and_Market_Power_in_Crises_Firm-level_Evidence_from_the_COVID-19_Pandemic (accessed on 2 April 2021).
32. Verbeke, A.; Yuan, W.A. Few Implications of the COVID-19 Pandemic for International Business Strategy Research. J. Manag.
Stud. 2020, 58, 597–601. [CrossRef]
33. Hasell, J.; Mathieu, E.; Beltekian, D.A. Cross-country database of SARS-COV-19 testing. Sci. Data 2020, 7, 345. [CrossRef] [PubMed]
34. Shams, S.A.; Haleem, A.; Javaid, M. Analyzing SARS-COV-19 pandemic for unequal distribution of tests, identified cases, deaths,
and fatality rates in the top 18 countries. Diabetes Metab. Syndr. Clin. Res. Rev. 2020, 14, 953–961. [CrossRef]
35. Arce, G.R. Nonlinear Signal Processing: A Statistical Approach; Wiley: Hoboken, NJ, USA, 2005.
36. Galvani, A.P. Dimensions of superspreading. Nature 2005, 438, 293–295. [CrossRef] [PubMed]
37. Wilson, T. A Proportional-Reduction-in-Error Interpretation for Kendall’s Tau-B. Soc. Forces 1969, 47, 340–342. [CrossRef]
38. Korneta, P. Determinants of sales profitability for Polish agricultural distributors. Int. J. Manag. Econ. 2019, 55, 40–51.
39. Best, D.; Roberts, D. Algorithm AS 89: The Upper Tail Probabilities of Spearman’s Rho. J. R. Stat. Soc. Ser. C (Appl. Stat.) 1975, 24,
377–379. [CrossRef]
40. Signorino, C.S.; Ritter, M.J. Tau-b or Not Tau-b: Measuring the Similarity of Foreign Policy Positions. Int. Stud. Q. 1999, 43,
115–144. [CrossRef]
41. Fredricks, G.A.; Nelsen, R.B. On the relationship between Spearman’s rho and Kendall’s tau for pairs of continuous random
variables. J. Stat. Plan. Inference 2007, 137, 2143–2150. [CrossRef]
42. Bonett, D.G.; Wright, T.A. Sample size requirements for Pearson, Kendall, and Spearman correlations. Psychometrika 2000, 65,
23–28. [CrossRef]
43. Corder, G.W.; Foreman, D.I. Nonparametric Statistics: A Step-by-Step Approach; Wiley: Hoboken, NJ, USA, 2014.
44. Kocsis, T.; Anda, A. Parametric or non-parametric: Analysis of rainfall time series at a Hungarian meteorological station. Q. J.
Hung. Meteorol. Serv. 2018, 122, 203–216. [CrossRef]
45. Sen, P.K. Estimates of the Regression Coefficient Based on Kendall’s Tau. J. Am. Stat. Assoc. 1968, 63, 1379–1389. [CrossRef]
46. Theil, H. A Rank-Invariant Method of Linear and Polynomial Regression Analysis. I, II, III; Akademie van Wetenschappen: Amsterdam,
The Netherlands, 1950.
47. El-Shaarawi, A.H.; Piegorsch, W. Encyclopedia of Environmetrics; Wiley: Hoboken, NJ, USA, 2001.
48. Gilbert, R.O. Statistical Methods for Environmental Pollution Monitoring; Wiley: Hoboken, NJ, USA, 1987.
49. Wilcox, R. A note on the Theil–Sen regression estimator when the regressor is random and the error term is heteroscedastic. Biom.
J. 1998, 40, 261–268. [CrossRef]
50. Granato, G.E. Kendall-Theil Robust Line (KTRLine—Version 1.0)—A Visual Basic Program for Calculating and Graphing Robust
Nonparametric Estimates of Linear-Regression Coefficients between Two Continuous Variables: Techniques and Methods of
the U.S. Geological Survey, 2006, book 4, chap. A7. Available online: https://pubs.usgs.gov/tm/2006/tm4a7/ (accessed on 29
March 2021).
51. Korneta, P. Growth, profitability and liquidity of Polish road transportation companies. In Proceedings of the 20th Interna-
tional Scientific Conference Business Logistics in Modern Management; Strossmayer, J., Ed.; University of Osijek: Osijek, Croatia,
2020; pp. 75–88.
52. Worden, L.; Wannier, R.; Hoff, N.A.; Musene, K.; Selo, B.; Mossoko, M.; Okitolonda-Wemakoy, E.; Tamfum, J.J.M.; Rutherford,
G.W.; Lietman, T.M.; et al. Projections of epidemic transmission and estimation of vaccination impact during an ongoing Ebola
virus disease outbreak in Northeastern Democratic Republic of Congo. PLoS Negl. Trop. Dis. 2019, 13, e0007512. [CrossRef]
53. Barth, D.; Mayosi, B.M.; Badri, M.; Whitelaw, A.; Engel, M.E. Invasive and non-invasive group A β-haemolytic streptococcal
infections in patients attending public sector facilities in South Africa: 2003–2015. South. Afr. J. Infect. Dis. 2018, 33, 12–17.
54. Orlik, T.; Rush, J.; Cousin, M.; Hong, J. Coronavirus Could Cost the Global Economy $2.7 Trillion. Here’s How. Bloomberg
Economics. NiGEM, OECD. 2020. Available online: https://www.bloomberg.com/graphics/2020-coronavirus-pandemic-global-
economic-risk (accessed on 2 April 2021).
55. Maliszewska, M.; Mattoo, A.; Van Der Mensbrugghe, D. The potential impact of COVID-19 on GDP and trade: A preliminary
assessment. World Bank Policy Res. Work. Pap. 2020, 9211. Available online: https://papers.ssrn.com/sol3/papers.cfm?abstract_
id=3573211 (accessed on 2 April 2021).
56. König, M.; Winkler, A. COVID-19: Lockdowns, Fatality Rates and GDP Growth. Evidence for the First Three Quarters of 2020.
Intereconomics 2021, 56, 32–39. [CrossRef] [PubMed]Int. J. Environ. Res. Public Health 2021, 18, 5246 12 of 12
57. Peto, J. Covid-19 mass testing facilities could end the epidemic rapidly. Br. Med. J. 2020, 368, 1163. [CrossRef]
58. Finch, W.H.; Finch, M.E.H. Poverty and Covid-19: Rates of Incidence and Deaths in the United States during the First 10 Weeks of
the Pandemic. Front. Sociol. 2020, 5, 47. [CrossRef]
59. Liang, L.L.; Tseng, C.H.H.; Ho, H.J.; Wu, C.Y. Covid-19 mortality is negatively associated with test number and government
effectiveness. Sci. Rep. 2020, 10, 12567. [CrossRef]
60. Pak, A.; Adegboye, O.A.; Adekunle, A.I.; Rahman, K.M.; McBryde, E.S.; Eisen, D.P. Economic Consequences of the COVID-19
Outbreak: The Need for Epidemic Preparedness. Front. Public Health 2020, 8, 241.
61. Al-Thaqeb, S.A.; Algharabali, B.G.; Alabdulghafour, K.T. The pandemic and economic policy uncertainty. Int. J. Financ. Econ.
2020, 1–11. [CrossRef]
62. Song, L.; Zhou, Y. The COVID-19 Pandemic and Its Impact on the Global Economy: What Does It Take to Turn Crisis into
Opportunity? China World Econ. 2020, 28, 1–25. [CrossRef]
63. Štifanić, D.; Musulin, J.; Miočević, A.; Šegota, S.B.; Šubić, R.; Car, Z. Impact of COVID-19 on Forecasting Stock Prices: An Integra-
tion of Stationary Wavelet Transform and Bidirectional Long Short-Term Memory. Complexity 2020, 1–12. [CrossRef] [PubMed]
64. Gorain, B.; Choudhury, H.; Molugulu, N.; Athawale, R.B.; Kesharwani, P. Fighting Strategies Against the Novel Coronavirus
Pandemic: Impact on Global Economy. Front. Public Health 2020, 8, 606129. [CrossRef] [PubMed]You can also read