The Interaction of Structural Factors and Diffusion in Social Unrest: Evidence from the Swing Riots
←
→
Page content transcription
If your browser does not render page correctly, please read the page content below
British Journal of Political Science (2021), page 1 of 17
doi:10.1017/S0007123420000873

ARTICLE

The Interaction of Structural Factors and Diffusion in
Social Unrest: Evidence from the Swing Riots
Toke Aidt1 and Gabriel Leon-Ablan2*
1
 Faculty of Economics, University of Cambridge, Cambridge, UK and 2Department of Political Economy, King’s College
London, UK
*Corresponding author. E-mail: gabriel.leon_ablan@kcl.ac.uk

(Received 29 April 2019; revised 16 April 2020; accepted 2 December 2020)

    Abstract
    Studies of the causes of social unrest typically focus on structural factors or diffusion. This article demon-
    strates the importance of considering their interaction and reveals a complex interplay between the two.
    This interaction is examined in the context of the English Swing riots of 1830–1831, in which it is possible
    to observe the structural factors relevant to each specific incident; this is often impossible when analyzing
    more recent cases of unrest. The authors find that the riots were triggered by economic factors and that
    diffusion more than tripled the direct effect of changes in local factors. Economic factors and the presence
    of potential riot leaders made an area more susceptible to the incoming diffusion of riots. The ways in
    which structural factors and diffusion interact is relevant to both historical and recent instances of social
    unrest.

Keywords: social unrest; riots; structural factors; diffusion; conflict; Captain Swing

Studies of the causes of social unrest often focus on the role of either structural factors (Campante
and Chor 2012; Finkel, Gehlbach and Olsen 2015; Scacco 2016) or diffusion (Granovetter 1978;
Kuran 1989; Lohmann 1994; Andrews and Biggs 2006). We argue that structural factors and dif-
fusion interact in important ways. For example, an increase in a local factor will affect unrest
locally, but this unrest will diffuse and lead to unrest in other areas too. Furthermore, the struc-
tural factors in a given location may help determine how susceptible it is to unrest diffusing in
from other areas.1
   In this article we study how structural factors affect social unrest and address three related
issues. First, we examine the importance of three categories of factors in generating unrest:
those that relate to motivation, organization and repression. We then consider the effect that a
change in a local factor has on the total amount of unrest in an area: its direct effect in the loca-
tion where the change occurs, and the indirect effect this unrest has in other areas through dif-
fusion. For instance, a worsening of economic conditions in a location may result in unrest there,
which then diffuses to other places. The change in the structural factor has therefore generated
unrest where the change in the factor occurred and led to unrest in other areas through diffusion.
Finally, whether unrest diffuses to a particular location will also depend on that location’s struc-
tural factors. For example, locations with better economic conditions may be less susceptible to
unrest diffusing in from elsewhere.

   1
    There are a number of exceptions, in particular Myers (2000), who looks at the factors that make a city more susceptible
to the spread of riots.
© The Author(s), 2021. Published by Cambridge University Press. This is an Open Access article, distributed under the terms of the Creative
Commons Attribution licence (http://creativecommons.org/licenses/by/4.0/), which permits unrestricted re-use, distribution, and reproduction
in any medium, provided the original work is properly cited.
2 Toke Aidt and Gabriel Leon‐Ablan
Addressing these issues with contemporary data poses two challenges. First, unrest often
involves fast movements of people who come from a variety of places but concentrate in a
small number of locations.2 This means that the number of incidents tends to be relatively
small, and so there is limited cross-sectional variation. Secondly, it is often difficult to determine
what structural values should be used, since the structural factors that affect the individuals who
participate are not necessarily those of the locations where the unrest takes place.
We overcome these challenges by focusing on a historical instance of social unrest: the Swing
riots of 1830–1831. This wave of unrest involved nearly 3,000 discrete incidents that happened in
a short space of time, providing us with considerable cross-sectional variation.3 The Swing riots
took place at a time when it was difficult to travel, and so most people rioted where they lived.
This means that the structural factors that affected the participants were those of the locations
where the riots occurred. This allows us to observe the structural factors relevant to each incident
in a way that is often impossible with more recent data.4 Our analysis uses a large dataset we col-
lected that records all Swing-related incidents and information on a large variety of factors for
more than 9,000 parishes in England.
We find that economic conditions were positively associated with local unrest and increased
the likelihood that riots would diffuse in from nearby areas. This is consistent with the literature
that emphasizes the role of deprivation in unrest (for example, DiPasquale and Glaeser 1998;
Kawalerowicz and Biggs 2015). In contrast to most previous work, we look at both the direct
effect of these factors and the indirect effect they have through diffusion.5 We also find that
organizational factors – particularly leadership – contributed to the unrest, but only because
they facilitated its diffusion. Consequently, leadership in the absence of motivation may not trig-
ger a wave of unrest; this is consistent with the view that social unrest starts spontaneously and
with little organization (Epstein 2002; Hassanpour 2017; Hobsbawm and Rudé 1973). Once the
unrest has started, however, leaders can play an important role in its diffusion (for example,
Strang and Soule 1998; Vasi 2011). Repression does not appear to have affected the unrest,
and whether it facilitated or hindered diffusion depends on how repression is measured. This
is consistent with the mixed findings in the literature: some show that repression hinders social
unrest (for example, DiPasquale and Glaeser 1998; Epstein 2002), while others find that it can
increase it (for example, Rasler 1996; Suh, Vasi, and Chang 2017).
Our main contribution is to examine in detail how structural factors interact with the diffusion
process: we show how changes in local factors can generate unrest in other areas through diffu-
sion, and the extent to which different factors affect a location’s susceptibility to unrest diffusing
in from elsewhere. We do so in a specific context, but these interactions are important to all forms
of social unrest and collective action more generally. Our findings are particularly informative
about peaceful protests and those that only involve small-scale violence (for example,
Chenoweth and Stephan 2011). Furthermore, the types of structural factors we consider appear
to be as important today as they were in the nineteenth century: motivation, organization and
repression are still cited as key factors behind social unrest. The Swing riots were of great histor-
ical consequence too: they are the closest that England has ever come to a popular revolution, and
they played a key role in the passage of the Great Reform Act of 1832 (Aidt and Franck 2015).
2
For example, in the 2011 London riots participants from all over the city concentrated in a small number of locations
(Baudains, Johnson and Braithwaite 2013).
3
The Swing riots were a national wave of unrest in which participants engaged in a variety of actions, all of which were part
of their repertoire of contention (Tarrow 2011). We follow the historiographical literature in referring to all Swing-related
incidents as riots, although they involved a variety of small-scale acts of violence. The object of study is therefore incidents
of small-scale violence that were part of a single wave of contention. Our results are robust to focusing only on subsets of
these incidents.
4
Our data are ecological; below we discuss how this affects our estimation.
5
Unlike previous work (for example, Campante and Chor 2012; Nordås and Davenport 2013), we find that demographic
factors are uncorrelated with social unrest.British Journal of Political Science 3
Framework and Hypotheses
The literature on the causes of social unrest emphasizes both the role of the structural factors that
make individuals more likely to participate and the process of diffusion through which this unrest
spreads between areas. In this article we examine how the two are linked by focusing on the inter-
action between three types of structural factors and the diffusion process. The first group of fac-
tors relates to motivation: people need a reason to participate. Secondly, social unrest only takes
place when a sufficient number of individuals participate, and this may require the presence of
leaders or some form of organization. Finally, the potential consequences in the form of repres-
sion will help each individual decide whether to participate in the unrest.
Once the unrest begins, individuals may decide to join as a result of what they see happening
in other areas, and this process of diffusion can interact with the structural factors. For example, a
change in a factor in location i will affect unrest locally, which in turn can lead to unrest in other
locations through diffusion. Furthermore, the structural factors mediate this diffusion, in the
sense that conditions in location j may affect the probability that it experiences unrest as a result
of the unrest in location i. In the rest of this section we develop our specific hypotheses.
Motivation
Many factors could motivate individuals to participate in social unrest. Early research on the
United States identified two factors that made cities more likely to experience race riots: the frac-
tion of African Americans in the population and its location in the South (Spilerman 1970). Since
then the literature has looked at other cases and other factors, including poverty and income
shocks (for example, Aidt and Leon 2016; Kawalerowicz and Biggs 2015), demographics (for
example, Campante and Chor 2012; Nordås and Davenport 2013; Urdal 2006), and ethnic
and religious diversity (for example, Scacco 2016; Wilkinson 2004; Wilkinson, 2009). Myers
(1997) finds that economic and migration pressures in the United States help explain the fre-
quency of race riots in the 1960s. Olzak, Shanahan and McEneaney (1996) and Olzak and
Shanahan (2003) show that ethnic competition was a primary driver of riots in the United
States, and Dancygier (2010) highlights the interaction between economic scarcity and political
power in determining the incidence of immigrant riots in the United Kingdom.6 In the context
of the Swing riots, Caprettini and Voth (2020) have shown that the adoption of the threshing
machine, a form of labor-saving technology, was an important factor in determining whether
a parish experienced riots.
These factors could also affect how individuals respond to unrest taking place near them.
Granovetter (1978) stresses that individuals have different thresholds for participation, and socio-
economic factors could help determine these thresholds. For example, deprivation could make
individuals more likely to imitate the actions of their neighbors. We discuss diffusion in more
detail below. Similarly, Myers (2000) argues that some factors might make a city more susceptible
to diffusion, including the size of its black population. Scacco (2016) finds that in Nigeria, poverty
is the “pull’ factor, but that network connections are necessary to turn this into unrest, while
Soule (1997) shows that tactics spread across universities and colleges that were similar in
terms of type, endowment and reputation. That is, local conditions can help determine whether
unrest will happen as a result of diffusion from nearby areas.
HYPOTHESIS 1a: Factors that motivate potential rioters increase the likelihood of unrest.
HYPOTHESIS 1b: Factors that motivate potential rioters increase the likelihood that unrest diffuses
in from nearby areas.
6
Brooke and Ketchley (2018) show that higher literacy rates and better rail connectivity helped the diffusion of the Muslim
Brotherhood in Egypt.4 Toke Aidt and Gabriel Leon‐Ablan
Organizational Capacity
The literature takes two different views on the role of organizational capacity, consistent with the
distinction drawn by Andrews and Biggs (2006) between spontaneity and organization. The first
interprets unrest as a spontaneous response to structural factors with minimal local organization
or coordination between individuals (for example, Epstein 2002; Hobsbawm and Rudé 1973).
This is consistent with the decentralized nature of many riots (for example, Morrell et al.
2011) and with the idea that unrest can be spontaneous (Hassanpour 2017). The second view
dates back to at least resource mobilization theory (McAdam 1982; McCarthy and Zald 1977),
which emphasizes the importance of associations and the rationality of actors in organizing col-
lective action. For example, Morris (1981) highlights the importance of a movement’s internal
organization, Minkoff and McCarthy (2005) focus on the role of organizational decision making,
and Dahlum, Knutsen and Wig (2019) examine the interaction between motivation and capacity,
arguing that the industrial and middle classes are best placed to spearhead a successful movement
because they are the most likely to see the benefits (motivation) but also have the ability to coord-
inate (capacity). In the case of incidents like those in the Swing riots, leadership is likely to matter
more than organizations. For example, leaders could help organize collective action. A number of
studies have examined the role of leaders in social unrest, including Strang and Soule (1998), who
consider the part played by ‘professional change agents’.
Leaders could also play an important role in the process of diffusion. For example, they could
be more informed about what is happening elsewhere and better placed to organize local action in
response. Morris (1981), McAdam (1982) and Andrews and Biggs (2006) argue that organization
is necessary for protest to spread, while Vasi (2011) examines the role of brokers who create links
between various groups. Leaders assume the role that in the more general diffusion literature is
played by the innovators and early adopters (Givan, Roberts and Soule 2010, 8). Areas with more
leaders should therefore be more likely to experience unrest as a result of diffusion. We summar-
ize this discussion in the following hypothesis:
HYPOTHESIS 2a: Factors that facilitate local organization increase the likelihood of unrest.
HYPOTHESIS 2b: Factors that facilitate local organization increase the likelihood that unrest diffuses
in from nearby areas.
The alternative to Hypothesis 2a is that the unrest is spontaneous and happens without organ-
ization. The alternative to Hypothesis 2b is that diffusion is mediated by factors other than
organization.
Repression
Since repression can increase the costs of participation, we would expect to see less unrest in areas
with more repression. For example, DiPasquale and Glaeser (1998) show that police expenditures
reduced riot intensity across US cities in the 1960s. Wilkinson (2004, 2009) argues that riots take
place only if the state apparatus decides not to repress them, which in turn depends on electoral
incentives.7 In general, the literature finds conflicting results, which is consistent with the idea in
the threats and opportunities literature that repression may trigger more unrest (threat), but the
lack of repression may permit it (opportunities). Repression could lead to more unrest if, for
example, it causes outrage in the population. DiPasquale and Glaeser (1998) find that repression
reduces unrest, while in Opp and Roehl (1990) and Rasler (1996) conclude that it can increase it.
7
Klein and Regan (2018) find that the state responds in a coercive manner when protests generate high concession costs,
while it makes concessions when disruption costs are high. Unfortunately, we do not have data to test hypotheses about
concessions.British Journal of Political Science 5
Repression is at the core of many well-known models of diffusion, which maintain that the
threat of punishment can prevent individuals from participating (for example, Granovetter 1978;
Kuran 1989). But repression could simply displace the unrest or even increase it. For example, dur-
ing the 2011 London riots participants reacted to increases in policing by relocating their activities
to other parts of the city (Davies et al. 2013), while Suh, Vasi and Chang (2017) show that repres-
sion facilitated the spread of the Occupy protests in 2011 by encouraging the creation of new
Facebook and Twitter accounts in other cities. We summarize this discussion as follows:
HYPOTHESIS 3a: Repression decreases the likelihood of unrest.
HYPOTHESIS 3b: Repression decreases the likelihood that unrest diffuses in from nearby areas.
The alternative to Hypothesis 3a is that repression increases the likelihood of unrest, while the
alternative to Hypothesis 3b is that repression facilitates diffusion.
Diffusion
The literature on the diffusion of social unrest is extensive, but our focus here is on how this pro-
cess interacts with the structural factors. The diffusion of social unrest shares many features with
technology diffusion (Rogers 1995): it begins with instigators in one location, and spreads when
individuals in other places decide to join. Granovetter (1978) shows how an individual’s decision
can set this process in motion, Kuran (1989) uses this logic to explain revolutions, and Lohmann
(1994) extends it into a theory of information cascades. What spreads in this case could be ideas
about new elements in the repertoire of contention (Biggs 2003; McAdam, Tarrow and Tilly 2001;
Tarrow 2011) or issue frames (Givan, Roberts and Soule 2010). Diffusion could also be the result
of both increases in rates of protest and in the density of social movement organizations (Minkoff
1997). McAdam and Paulsen (1993) argue that diffusion happens through interactions between
individuals who are part of the same social networks.8
In the context of the Swing riots, previous work has emphasized the importance of diffusion
between nearby parishes (Aidt, Leon-Ablan and Satchell 2020; Hobsbawm and Rudé 1973). This
is natural because the Swing riots pre-date modern communication technologies, and so at that
time information had to travel spatially.9
HYPOTHESIS 4: Social unrest diffuses between geographically proximate areas.
The Historical Case and Operationalization
Background
The Swing riots were the largest rural uprising in nineteenth-century England. They started in
Kent in August 1830, quickly spread to the surrounding counties, and peaked in late
November; by March 1831 they had largely ended. During this period there were nearly 3,000
incidents that included the burning of barns and ricks, the destruction of threshing machines,
robbery and forced levies of money, assaults on poor law officials, wage and tithe riots, and
anonymous threatening letters.10 Figure 1 shows the locations of these incidents.
8
For example, Vasi and Suh (2016) show that information about the Occupy movement spread through Facebook and
Twitter.
9
The telegraph had only recently been invented and was only in military use; the expansion of the railways did not happen
until a decade after the Swing riots.
10
Appendix Table A1 reports the number of occurrences by type. Our results are robust to dropping the anonymous threa-
tening letters. They are also robust to splitting the sample into small and large incidents (see Appendix Table A5).6 Toke Aidt and Gabriel Leon‐Ablan
Figure 1. The location of the Swing riots
Note: the map shows the location of all
Swing-related incidents. The radius of each circle
reflects the number of incidents in each parish.
The rioters were mostly farm laborers who were employed by tenant farmers on precarious
contracts.11 Rural unemployment was high throughout this period, especially outside the peak
harvest season, and many farm laborers lived in extreme poverty. The demands of the Swing rio-
ters were mostly economic: higher wages, separation of poor law subsidies from wage payments
and more work. The initial response was local and slow, and this allowed the riots to spread for
months. This changed when a new national government came to power in November 1830 and
introduced new measures aimed at ending the riots. By December 1830 over 2,000 rioters
had been arrested, and many of them were eventually sentenced to death or transported to
Australia.
Data and Measurement
We digitized and geo-coded the Swing riots data in Hobsbawm and Rudé (1973, Appendix II),
the Family and Community Historical Research Society (Holland 2005) and Griffin (2012). These
sources relied on information from Home Office documents, newspapers, and national and local
archives. The data record the location (parish/township/hamlet) and county of each
Swing-related incident, its date and in some cases a short description of what happened. The
data are almost certainly a complete record of what was reported, and although some incidents
were likely missed in these reports, we have no reason to believe that our sample is unrepresen-
tative.12 The data on structural factors come from a variety of primary and secondary sources,
11
However, the limited data on occupation suggest that about 16 per cent of arrested rioters were village craftsmen and
traders.
12
One possibility is that incidents that took place in parishes near locations that printed newspapers were more likely to be
reported. The Appendix shows evidence that suggests this was not case.British Journal of Political Science 7
including the 1831 Population Census of Great Britain.13 These data are recorded at the parish
level and are fully available for 9,484 English parishes.14 They do not exhibit any time variation,
and so our analysis focuses on cross-sectional specifications: we use the total number of incidents
experienced by each parish during the duration of the Swing riots (28 June 1830 to 3 April 1831).
The Appendix discusses in more detail our sources and how our variables are constructed:
Table A2 shows the correlations between the variables and Table A3 reports descriptive statistics.
Motivation
To operationalize the factors outlined in the hypotheses we turn to the historiographical litera-
ture. There is general agreement among social historians that the Swing rioters were primarily
motivated by economic factors. Hammond and Hammond (1912, Ch. 11) and Hobsbawm and
Rudé (1973, Ch. 4) emphasized the importance of the local agricultural economy (cereal versus
dairy production) and the number of people working in agriculture. Hammond and Hammond
(1912, 85) also argued that the Enclosure Acts of rural England were an important factor, since
they reduced the access of the local poor to common land in some rural areas, potentially increas-
ing their economic hardship. The wealth of a parish could have played a role too, for example by
increasing inequality or the generosity of the poor laws (the welfare system), which was funded
locally.15
To capture these factors, we use Caird’s (1852) division of England into the eastern counties
dominated by cereal production (mostly grain and wheat) and those in the west that focused on
dairy farming (see Appendix M1). We use this to construct an indicator variable Cereal that
equals 1 if the region specialized in cereals; this variable captures variation in the type of agricul-
ture. We measure the importance of agriculture to the parish economy by recording the number
of families engaged in this activity (log Families in Agriculture). We include a dummy variable
Enclosure that equals 1 if the parish had enclosed prior to 1830. We also include a variable
Wealth that measures the aggregate value of property in 1815.
Finally, we also include two demographic variables: the number of adult men (log Males) and
the population of a parish (log Population). Most rioters were men, and so log Males proxies for
the number of potential rioters. The population of the parish helps control for urbanization.16
Organizational Capacity
Charlesworth (1979), Tilly (1995, Ch. 7) and Thompson (1963, 225–227) stressed the central role
of local leaders in initiating riots in a parish, and suggested that these leaders were often the eco-
nomically independent and literate artisans, craftsmen, traders and shopkeepers.17 Consequently,
we measure organizational capacity by including the number of people employed in trade and
handicrafts (log Traders and Craftsmen) and in the professions including law, medicine and
teaching (log Professionals). Furthermore, civic groups and individuals could petition parliament
in relation to local or national issues, and this likely required initiative and leadership. We
13
The 1831 Population Census of Great Britain was collected in May 1831, but this is unlikely to introduce reverse causality
because the riots did not lead to large changes in the demography or employment structure of the parishes. Our results are
robust to using population information from the 1821 Census, but data on employment structure were not recorded that year.
14
We have no information on the riots for Scotland, and are missing data for most of the structural factors for Wales.
15
Under the poor law system, each parish was responsible for its own poor, and payments and wage subsidies were funded
out of taxes levied on local property owners. Wealthier parishes were thus able to provide more help. This helped reduce labor
mobility, as laborers lost their right to aid when they moved to another parish (Marshall 1968).
16
Since we control for the population of a parish, the coefficient on the number of men captures changes in the fraction of
men in the population.
17
This hypothesis is motivated by several well-documented cases in which riots were led by village radicals. We focus on
local leaders; the question of national leadership and conspiracy has been investigated and dismissed by others (for example,
Hobsbawm and Rudé 1973; Jones 2009).8 Toke Aidt and Gabriel Leon‐Ablan
therefore use the total number of petitions sent from a parish as a proxy for organizational cap-
acity. The variable log Petitions records the number of petitions sent to parliament between 1828
and 1831 on the three main social issues of the period – slavery, Catholic rights and parliamen-
tary reform. Finally, newspapers could have allowed local leaders to stay informed about riots in
other parts of the country; the variable Newspapers is a dummy that equals 1 if the parish was
within 10 km of where a newspaper was published.
Repression
In the 1830s law and order was the responsibility of local magistrates, but their ability to act was
limited: they relied on volunteers, many of whom were initially reluctant to help. This generated
large spatial differences in the response to the riots, and Hobsbawm and Rudé (1973, 189) argue
that the riots happened largely in areas with little or no repression. We capture repression
through two variables: log Distance to Garrison and Police; the first measures the distance to
the nearest garrison, while the second is a dummy that equals 1 if the parish is located within
a 10 km radius of where a police force was based. We use these variables because the effectiveness
with which the local magistrates could respond to the riots likely depended on whether there was
a garrison or police force nearby.18 Appendix Figure M4 shows the location of the garrisons and
police forces.19 The garrisons were located primarily at the navy ports, while the police forces
were mostly located in urban areas.
Diffusion
Hypothesis 4 suggests that diffusion took place between areas that were near each other geograph-
ically; this is consistent with the historical context and with previous studies of the Swing riots
(Aidt, Leon-Ablan and Satchell 2020; Hobsbawm and Rudé 1973). Since our data for the struc-
tural factors do not exhibit time variation, we need to use cross-sectional specifications. We meas-
ure diffusion with a spatial lag that equals the average number of riots that took place in the
neighborhood of each parish.20 In the next section we discuss how this is done econometrically.
Empirical Specification
The structural factors exhibited no time variation during the 40 weeks of unrest, and so we have
to use cross-sectional variation in the total number of incidents experienced by different
parishes.21 We regress the total number of riots in a parish on the structural factors and on a
spatial lag. This spatial lag measures the average number of riots in a 10 km neighborhood of
each parish; we use 10 km because this corresponds to a walking distance of 2–3 hours, which
is as far as the agricultural laborers typically traveled (Hobsbawm and Rudé 1973, 212). The spa-
tial lag measures the intensity of rioting in the neighborhood of a parish, which we interpret as a
18
Police forces could only operate in the areas where they were based, while troops stationed in a garrison could be mobi-
lized all over the country.
19
The police forces that existed in 1830–1831 were funded by the Municipal Corporations and were tasked with improving
public safety in urban areas.
20
This variable is clearly endogenous, and so we use an instrumental variable strategy that we describe in the next section.
21
Ecological studies often suffer from two problems. The first is that variables may have both contextual and compositional
effects. This is true in our case, and unfortunately our data do not allow us to distinguish between the two. The second prob-
lem is that ecological studies often use population averages of individual-level variables. When such a measure is used on the
left-hand side, the estimates will be biased unless additional information about the joint distribution of the variables can be
used. However, following the reasoning in Greenland (2001), our study to some extent avoids this problem because our
dependent variable – the number of riots in a parish – is contextual. Some of our independent variables are population
averages of binary variables (for example, families in agriculture/families not in agriculture), and so they will not work as
controls (Greenland 2001). But this measurement problem is addressed by our use of an instrumental variables (IV) strategy.British Journal of Political Science 9
measure of diffusion. This means that we explain cross-sectional variation in riots using variation
in the structural factors and in the spatial lag. There are two main sources of endogeneity: omitted
variables that are correlated with some of the factors we consider, and simultaneity bias induced
by the spatial lag. We therefore employ an instrumental variable strategy, which we describe in
more detail in the next section.
We then consider how changes in a structural factor in one parish may affect the total number
of riots in the country. The intuition is that a change in a factor in a parish will lead to, say, more
riots in that parish, and those riots will then diffuse. Thus the total effect needs to take this dif-
fusion into account. The size of this total effect will depend on the parish we consider: changes in
structural factors in well-connected parishes will generate more diffusion than changes in rela-
tively isolated ones.
Finally, we run a regression that includes interactions between the structural factors and the
spatial lag. This splits the effect of each factor into two: that which it has when there are no
riots near the parish, and the additional effect of this factor when there are riots nearby. The
first effect can be thought of as the role of that factor in triggering riots in the absence of diffusion
(including the first riot in a wave of unrest), while the second we interpret as the effect of that
factor in facilitating or hindering diffusion.
Specification
The baseline specification is:
riots = ai + factors × g + b × W × riots + county × d + u, (1)
which is a standard spatial autoregressive model in which riots is a n × 1 vector where n is the
number of parishes and element i is the total number of riots that took place in parish i between
Monday, 28 June 1830 and Sunday, 3 April 1831. On the right-hand side, the first term includes a
scalar α and a unit vector i of length n. The matrix factors has dimension n × k where k is
the number of structural factors, with row i corresponding to the value of the factor for parish
i, while γ is a vector of length k with its elements corresponding to the coefficients on the
factors. We consider the twelve parish-specific factors related to motivation, organizational cap-
acity and repression introduced above. The third term includes the scalar β and the spatial lag
W × riots. W is a n × n row-normalized weight matrix where element (i, j) is non-zero if parishes
i and j are within 10 km of each other and all other elements are set to 0.22 This spatial lag cap-
tures diffusion: for a parish i it records the average number of riots that took place in parishes
within 10 km.23 The matrix county has dimension n × c where c is the number of counties,
with element (i, j) being equal to 1 if parish i is in county j and 0 otherwise, while δ is a c × 1
vector of county fixed effects. The inclusion of county effects helps control for shared character-
istics between clusters of parishes and exposure to the same shocks, so that the specification
exploits variation in parish factors and in the spatial lag relative to the within-county average.
The error is given by the n × 1 vector u.
The presence of a spatial lag in Equation 1 implies that ordinary least squares estimates will be
biased and inconsistent, since the spatial lag is mechanically correlated with the error. There will
also be omitted variables that could potentially bias our results. To address these issues, we
employ an IV strategy and estimate the equation with a spatial two-stage least-squares (2SLS) esti-
mator developed by Kelejian and Prucha (1998). This estimator instruments for the spatial lag
22
The diagonal elements are all set to 0, so that a parish is not its own neighbor.
23
The choice of whether the weight matrix is row-normalized should be done on the basis of theory (Plümper and
Neumayer 2010). We row-normalize because in some specifications we consider the impact that the structural factors in par-
ish i’s neighbors may have on riots in i, and it makes sense to average these values across neighboring parishes (since it is
likely that what matters is the average wealth across parishes, for example, rather than the sum total of their wealth).10 Toke Aidt and Gabriel Leon‐Ablan
with factors, W × factors and W 2 × factors, where W is the weight matrix, W 2 is the second spa-
tial lag, and factors is the matrix of structural factors. The intransitive nature of our network,
where i and j can be neighbors, j and k can be neighbors, but i and k will often not be, is a suf-
ficient condition for this instrument set to be valid and informative. We use the spatial hetero-
skedasticity autocorrelation consistent (SHAC) version of this estimator, which adjusts the spatial
2SLS errors for heteroskedasticity of unknown form and for spatial autocorrelation (Kelejian and
Prucha 2007). For robustness, we also employ a maximum-likelihood Poisson estimator that takes
into account the count nature of our dependent variable.
Results
Structural Factors
Table 1 reports SHAC and Poisson estimates of γ and β. Column 1 shows a specification with the
twelve factors and Column 2 reports maximum-likelihood Poisson estimates. Column 3 reports
results that control for the effect that the structural factors of neighboring parishes have on the
riots in parish i. To account for these factors, we add the term W × factors × ρ to Equation 1.
Here the row-normalized weight matrix W has dimension n × n, with all elements set to zero
except those corresponding to parishes within 10 km of each other. Importantly, the fact that
the weight matrix is row-normalized implies that it averages the value of each of the twelve struc-
tural factors across the neighboring parishes.24
We find that parishes located in the cereal-producing regions of England and those with more
families employed in agriculture experienced more riots. The enclosure of common land before
1830 is uncorrelated with the riots, contrary to the conjecture in Hammond and Hammond
(1912). Property values (Wealth) are positively associated with riots, which is consistent with the
hypothesis that inequality aggravated the discontent that led to rioting, but also with the idea
that laborers in wealthy parishes rioted because they anticipated the concessions that those parishes
could make. These effects are large; for example, cereal-growing areas are associated with an add-
itional 0.111 riots, which is equal to 50 per cent of the average number of riots across parishes. A
one-standard-deviation increase in the value of log Families in Agriculture is associated with 0.08
more riots, which is equal to a third of the average number of riots.25 The coefficients on log
Males and log Population are not significantly different from zero.
Turning to organizational capacity, the number of people employed in trade, in the profes-
sions, and the number of petitions sent to parliament are all positively associated with the num-
ber of riots in a parish. In particular, a one-standard-deviation increase in the value of these
variables is associated with an increase in riots that is equal in size to 41, 23 and 23 per cent
of the average number of riots across parishes.26 These results are consistent with resource mobil-
ization theory (McAdam 1982; McCarthy and Zald 1977), and in particular with the literature
that emphasizes the role of leaders (Charlesworth 1979; Strang and Soule 1998; Vasi 2011).
Finally, in one specification, being close to a town where a newspaper was published had a nega-
tive and significant effect on riots. Only a small number of cities had newspapers, and they were
typically county seats where local politics and social conditions made rioting less likely.
24
Appendix Table A4 reports the estimates for ρ. Only W × Log Petitions and W × Police have significant coefficients, sug-
gesting that the structural factors of neighboring parishes are largely unimportant.
25
We use the coefficients in Column 1 and the fact that the sample average number of riots is 0.22 (see the Appendix).
Cereal is a dummy variable, and so being in a cereal-growing area would result in 0.111 additional riots, an amount that is 50
per cent of the sample average number of riots. The standard deviation for Families in Agriculture is 1.14, and so a
one-standard-deviation increase would result in 0.067 × 1.14 = 0.08, and so about 33 per cent of the sample average number
of riots.
26
For ln Traders and Craftsmen the standard deviation is 1.58, and so the calculation is (0.055 × 1.58)/0.22 = 0.41, for ln
Professionals the standard deviation is 1.31, and so (0.035 × 1.31)/0.22 = 0.23, and for petitions it is 0.51, and so (0.105 ×
0.51)/0.22 = 0.23.British Journal of Political Science 11
Table 1. The effect of parish-specific structural factors
1 2 3
Variables Riots Riots Riots
Motivation
Cereal 0.111 0.612 0.057
(0.032)*** (0.200)** (0.035)+
Log Families in Agriculture 0.067 0.360 0.065
(0.016)*** (0.066)*** (0.020)**
Enclosure 0.005 0.132 0.006
(0.015) (0.095) (0.015)
Log Wealth 0.046 0.091 0.058
(0.020)* (0.128) (0.023)*
Log Males −0.020 −0.663 0.018
(0.045) (0.719) (0.048)
Log Population 0.011 0.829 0.001
(0.035) (0.732) (0.039)
Organizational capacity
Log Traders and Craftsmen 0.055 0.209 0.044
(0.015)*** (0.089)* (0.015)**
Log Professionals 0.035 −0.042 0.036
(0.008)*** (0.059) (0.009)***
Log Petitions 0.105 0.173 0.116
(0.027)*** (0.085)* (0.028)***
Newspapers −0.029 −0.059 −0.038
(0.011)** (0.111) (0.032)
Repression
Log Distance to Garrison 0.010 0.076 −0.078
(0.007) (0.075) (0.078)
Police 0.025 0.145 0.073
(0.011)* (0.094) (0.022)***
Diffusion
W × riots 0.758 0.484 0.935
(0.043)*** (0.069)*** (0.033)***
Observations 9,484 9,248 9,484
Dummies County County County
Structural factors of neighbors No No Yes
Standard errors Spatial Clustered Spatial
Estimation SHAC Poisson SHAC
Note: standard errors in parentheses. Constants not reported. The unit of observation is the parish, and element i in the vector riots equals
the total number of riots in parish i during the Swing riots. For a parish i, W x riots refers to the average number of riots across parishes
within 10 km of its centroid (excluding riots that happened in i itself). The SHAC estimator used to obtain the coefficients in Columns 1 and 3
is implemented with the sphet package in R. The standard errors reported in these columns are robust to heteroskedasticity and spatial
correlation. The coefficients in Column 2 are from a Poisson regression estimated using the ppml command in Stata. Column 3 shows a
specification that includes the structural factors of neighboring parishes. This allows the average of each of the twelve factors in parishes
within 10 km of parish to influence the riots in i. *** p < 0.001, ** p < 0.01, * p < 0.05, < 0.1
We observe that proximity to a police force is correlated with more riots, which is consistent
with the idea in the threats and opportunities literature that repression can lead to more unrest.
However, distance to a garrison is uncorrelated with the riots. These mixed results are consistent
with the findings in the empirical and theoretical literature on repression and unrest.
Finally, the coefficient on the spatial lag is positive and highly significant in all three columns:
the total number of riots in a parish is positively associated with riots nearby, showing that riots
cluster in space.27
27
Appendix Table A5 shows that our results are robust to using only types of incidents that are large and to using only
types of incidents that are small. Table A6 shows that the results in Table 1 are robust to allowing for a 20 km neighborhood, a
30 km neighborhood, removing the county of Kent from the sample (since that is where the riots started) and removing all
parishes within 20 km of London.12 Toke Aidt and Gabriel Leon‐Ablan
The Effect of Changes in Structural Factors
In order to examine how diffusion can augment the effect of changes in structural factors, we con-
duct a thought experiment: we increase the value of a structural variable in one parish by 1 and
calculate the total number of riots that would result from this change. The effect has two parts.
First, the change in the factor affects the number of riots in the parish where the change happens.
Second, these additional riots diffuse and lead to new riots in other parishes, which in turn also
diffuse and so on. To estimate the total effect, we need to trace the consequences of the change
in the factor through the whole network of parishes. To do this we solve for riots in Equation 1:
riots = N(ai) + N(factors × g) + N(county × d) + Nu, (2)
Where
N ; (I − b1 W)−1 , (3)
where the term N(factors × γ) captures the effect of the factors. The spatial connections between
parishes are summarized in the matrix N. In particular, Column i captures the effect of a one-unit
change in riots in parish i, where Nj,i is the effect this change has on parish j. Therefore, the sum of
the elements in Column i corresponds to the total effect of a one-unit change in riots in parish i.
The total impact of a one-unit increase in factor k in parish i is given by [N1,i + … + Nn,i] × γk; that
is, γk tells us the number of additional riots that result from a one-unit increase in factor k in parish
i, and [N1,i + … + Nn,i] is the total number of riots that result from the diffusion of each additional
riot in i.
The size of this effect depends on which parish sees the change in the structural factor, since
connectivity affects its diffusion; this is reflected in the fact that different columns have different
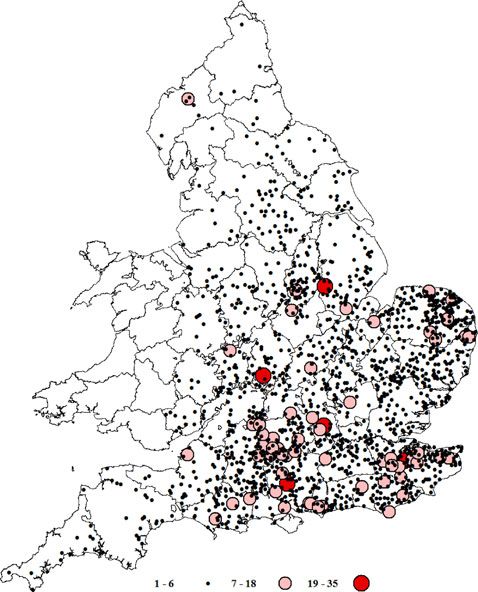
totals. Figure 2 summarizes this information by presenting the frequency distribution of column
totals (based on the coefficients in Column 1 of Table 1). The distribution has a mean of 4.15, a
median of 4.19 and a standard deviation of 0.55, with a maximum impact of 6.39. That is, a shock
to factor k in the parish with the average column total will generate a total riot effect equal to
4.15 × γk, of which γk is the direct effect and 3.15 × γk is the result of diffusion. For example, sup-
pose that the variable ln Petitions goes up by 1 in the parish with the average column total. This
then leads to a direct increase of 0.105 riots in that parish, plus an additional 3.15 × 0.105 = 0.33
riots from diffusion. In conclusion, the average effect due to the diffusion process is 3.15 times the
size of the direct effect of an exogenous change in a structural factor.28
How Structural Factors Affect Diffusion
We now turn to the question of how structural factors affect the diffusion of riots into a parish.
To do so, we augment Equation 1 with a set of interactions between the structural factors and the
spatial lag:
12
fk D(factorsk ) × W × riots, (4)
k=1
where the ϕk are parameters and D(factorsk) is an n × n matrix where element (i,i) is equal to the
value of factor k for parish i, with all non-diagonal elements set equal to 0.
Including these interaction terms splits each of the effects in Table 1 into two: the effect of the
factor when the spatial lag is zero, and the additional effect that factor has when the spatial lag is
28
In principle, it is possible that structural factors in parish i affect riots in j directly. However, Appendix Table A4 shows
that this is not the case.British Journal of Political Science 13
Figure 2. Frequency distribution of the total increase in riots that results from a one-unit increase in factor k (setting γk = 1)
Note: the column totals are calculated using the estimates reported in Column 1 of Table 1. The mean of this distribution is 4.15 and the
median is 4.19.
non-zero. Since the first coefficient is the effect of the factor in the absence of diffusion, we can
interpret it as the role of that factor in triggering the initial riot. We interpret the second as the
effect of the structural factor on the process of diffusion: a positive coefficient means that the fac-
tor facilitates diffusion into the parish, while a negative coefficient means that it hinders it.
Table 2 reports the results. We find that diffusion was higher into parishes that grew cereals
and those with more families in agriculture.29 We also find that diffusion was higher in parishes
that had recently experienced enclosure and those with greater wealth.30 That is, economic con-
ditions facilitated the spread of riots. Of these variables, only the type of agriculture still shows a
direct effect, so that it can trigger riots (including the initial one) in the absence of diffusion.
Population size has a positive and marginally significant effect.
Furthermore, three of the variables that capture leadership – log Traders and Craftsmen, log
Professionals and log Petitions – are associated with greater diffusion.31 None of these variables
shows a direct effect once their interaction with the spatial lag is included, suggesting that the
correlations we found above are largely due to cases where leadership facilitated the diffusion
of nearby riots. One interpretation of these results is that in the absence of motivation, leadership
is not enough to set off the initial riot. This is consistent with the literature that views riots as
29
To get a sense of the size of these effects, suppose that the value of the spatial lag is 1. Diffusion in cereal-growing
parishes is associated with 0.009 more riots than it is in parishes that do not grow cereals. This value is equivalent to
0.009/0.22 = 0.04, and so 4 per cent of the average number of riots across the sample. Similarly, areas with a value of log
Families in Agriculture that is one standard deviation higher will see diffusion that is associated with 0.013 more riots
than it is in the counterfactual parishes. This calculation uses the standard deviation of 1.14, and so (0.013 × 1.14)/0.22 =
0.07. This is equivalent to 7 per cent of the average number of riots across the sample.
30
These effects are 3 and 2 per cent, respectively.
31
The effects here, all calculated relative to one standard deviation of the variable, are 6, 2 and 5 per cent.14 Toke Aidt and Gabriel Leon‐Ablan
Table 2. The effect of parish-specific structural factors on diffusion
Category Variables Riots
Motivation Cereal 0.078
(0.028)**
D(Cereal) × W × riots 0.009
(0.002)***
Log Families in Agriculture −0.016
(0.015)
D(Log Families in Agriculture) × W × riots 0.013
(0.003)***
Enclosure −0.025
(0.021)
D(Enclosure) × W × riots 0.006
(0.002)**
Log Wealth −0.011
(0.012)
D(Log Wealth) × W × riots 0.010
(0.003)***
Log Males −0.067
(0.050)
D(Log Males) × W × riots −0.003
(0.006)
Log Population 0.140
(0.055)*
D(Log Population) × W × riots −0.010
(0.008)
Organizational capacity Log Traders and Craftsmen −0.006
(0.012)
D(Log Traders and Craftsmen) × W × riots 0.008
(0.003)*
Log Professionals 0.013
(0.007)+
D(Log Professionals) × W × riots 0.003
(0.001)***
Log Petitions 0.010
(0.022)
D(Log Petitions) × W × riots 0.021
(0.002)***
Newspaper −0.008
(0.011)
D(Newspaper) × W × riots −0.006
(0.001)***
Repression Log Distance to Garrison 0.035
(0.017)*
D(Log Distance to Garrison) × W × riots −0.004
(0.001)***
Police −0.016
(0.013)
D(Police) × W × riots 0.005
(0.001)***
Diffusion W × riots 0.174
(0.123)
Observations 9,484
County dummies YES
Standard errors Spatial
Estimation SHAC
Note: standard errors in parentheses. Constants not reported. D(factork) refers to an n × n diagonal matrix where element (i,i) equals the
value of structural factor k in parish i. The expression D(factork) × W × riots refers to the interaction between each parish’s factor k and the
spatial lag. The results are from the SHAC estimator which is implemented with the sphet package in R. The standard errors are robust to
heteroskedasticity and spatial correlation. *** p < 0.001, ** p < 0.01, * p < 0.05, < 0.1British Journal of Political Science 15
spontaneous (Epstein 2002; Hassanpour 2017; Morrell et al. 2011). However, leaders still matter
because they help the initial unrest to diffuse (Strang and Soule 1998; Vasi 2011).32
Finally, we find that repression is positively correlated with diffusion when measured using prox-
imity to a police force (Police), but negatively correlated with diffusion when it is measured using
the distance to the nearest garrison (Distance to Garrison). This is consistent with the threats and
opportunities literature; the presence of a police force may have increased local discontent with the
authorities and facilitated diffusion, while being far from a garrison may have limited the magis-
trates’ ability to repress and hence allowed the riots to spread into a parish. These findings are con-
sistent with the mixed results found in the literature on repression and unrest.
In summary, we find that motivation had both a direct effect on riots in a parish and facilitated
their diffusion. The presence of leaders was correlated with diffusion; repression was associated
with diffusion too, but the direction of the relationship depends on how repression is measured.
Conclusion
We examine the effect that three types of structural factors have on social unrest, how changes in
these factors can generate unrest that then diffuses to other areas, and the extent to which struc-
tural factors facilitate or hinder diffusion. We do this in the context of a historical episode of
social unrest, the Swing riots of 1830–1831. The Swing riots were the foundational case in the
study of popular unrest in social history, and provide us with an ideal setting in which to address
these issues: unlike more recent data on social unrest, we have a large number of discrete inci-
dents, each with a well-defined set of structural factors. We find that factors related to economic
activity likely triggered the unrest, and that both economic factors and local leadership are asso-
ciated with greater diffusion. Whether repression facilitated or hindered diffusion depends on
how repression is measured. Finally, if a factor in a given parish is changed so as to generate
an additional incident, this change would on average generate 3.15 more incidents through
diffusion.
Our results show that structural factors and the diffusion process are closely linked. Although
our findings are obtained by focusing on a specific time and place, the complex interplay between
structural factors and diffusion that we uncover is relevant to many contemporary episodes of
social unrest.
Supplementary material. Online appendices are available at https://doi.org/10.1017/S0007123420000873.
Data availability. The data, replication instructions, and the data’s codebook can be found at Aidt and Leon-Ablan (2020)
(https://doi.org/10.7910/DVN/H0IB1M).
Acknowledgements. The authors are listed in alphabetical order. We wish to thank Ali Hemmingway, Jay Lee, Simon
Pittaway, Naomi Roba, Andriy Levitskyy and Arjun Dwesar Kumar for excellent research assistance. We are also grateful
to the Cambridge Group for the History of Population and Social Structure for providing us with shape files for the
maps of the ancient counties and parishes (ESRC Grant RES-000-23-1579), access to the digitized 1831 Population
Census (ESRC Grant RES-000-23-1579), and access to part of the digitized 1815 Poor Law returns and the directory of stage-
coach services 1836 (Leverhulme Trust, RPG-2013-093). We thank Mauricio Rodriguez Acosta for sharing with us data on
the location of police forces in England and Wales. We wish to thank the seminar audiences at King’s College London, Essex,
Oslo, Nottingham, Munich, Sheffield, Leicester, Rennes, Barcelona, Birmingham, UCL, Alghero, LSE, Oxford, Universitat
Pompeu Fabra, Glasgow, York, NEPS, EPCS, Silvaplana, EPSA and MPSA for their comments. We thank Barry
Eichengreen, Marco Manacorda, Andrea Tesei, Kristian S. Gleditsch, Vincenzo Bove, Ruben Enikolopov, Antonio
Ciccone, Stephane Wolton, Jordi Blanes i Vidal, Lena Gerling, Carlos Velasco, Pramila Krishnan, Elena Seghezza,
Jean-Paul Azam, Nadia McCloud-Rose, Benjamin Wesley Campbell and James Fenske for their helpful suggestions, and
Leigh Shaw-Taylor for many insightful discussions.
Financial support. This research was supported by the British Academy (BA grant JHAG097).
32
The effect of newspapers is taken up by the interaction, so they are associated with lower diffusion into the parish.16 Toke Aidt and Gabriel Leon‐Ablan References Aidt TS and Leon-Ablan G (2020) “Replication Data for: The interaction of structural factors and diffusion in social unrest: evidence from the Swing riots”, https://doi.org/10.7910/DVN/H0IB1M, Harvard Dataverse, V1, UNF:6:U5un/ VvQ0Ejg5BxP9+Z5OA== [fileUNF] Aidt TS and Franck R (2015) Democratization under the threat of revolution: evidence from the Great Reform Act of 1832. Econometrica 83(2), 505–547. Aidt TS and Leon G (2016) The democratic window of opportunity: evidence from riots in sub-Saharan Africa. Journal of Conflict Resolution 60(4), 694–717. Aidt TS, Leon-Ablan G and Satchell M (2020) The social dynamics of collective action: evidence from the diffusion of the Swing riots, 1830–1831. The Journal of Politics. Forthcoming. Andrews KT and Biggs M (2006) The dynamics of protest diffusion: movement organizations, social networks, and news media in the 1960 sit-ins. American Sociological Review 71(5), 752–777. Baudains P, Johnson SD and Braithwaite AM (2013) Geographic patterns of diffusion in the 2011 London riots. Applied Geography 45, 211–219. Biggs M (2003) Positive feedback in collective mobilization: the American strike wave of 1886. Theory and Society 32, 217– 254. Brooke S and Ketchley N (2018) Social and institutional origins of political Islam. American Political Science Review 112(2), 376–394. Caird J (1852) English Agriculture in 1850–1851. London: Longman, Brown, Green and Longmans. Campante FR and Chor D (2012) Why was the Arab world poised for revolution? Schooling, economic opportunities, and the Arab Spring. Journal of Economic Perspectives 26(2), 167–188. Caprettini B and Voth J (2020) Rage against the machines: Labor-saving technology and unrest in industrializing England. AER Insights. Forthcoming. Charlesworth A (1979) Social Protest in a Rural Society: The Spatial Diffusion of the Captain Swing Disturbances of 1830– 1831. Norwich: University of East Anglia. Chenoweth E and Stephan MJ (2011) Why Civil Resistance Works: The Strategic Logic of Nonviolent Conflict. New York: Columbia University Press. Dahlum S, Knutsen CH and Wig T (2019) Who revolts? Empirically revisiting the social origins of democracy. The Journal of Politics 81(4), 1494–1499. Dancygier RM (2010) Immigration and Conflict in Europe. Cambridge: Cambridge University Press. Davies T et al. (2013) A mathematical model of the London riots and their policing. Scientific Reports 3, 1303. DiPasquale D and Glaeser EL (1998) The Los Angeles riot and the economics of urban unrest. Journal of Urban Economics 43(1), 52–78. Epstein JM (2002) Modeling civil violence: an agent-based computational approach. Proceedings of the National Academy of Sciences 99(suppl 3), 7243–7250. Finkel E, Gehlbach S and Olsen TD (2015) Does reform prevent rebellion? Evidence from Russia’s emancipation of the serfs. Comparative Political Studies 48, 984–1019. Givan RK, Roberts KM and Soule SA (2010) Introduction: the dimensions of diffusion. In Givan RK, Roberts KM and SA Soule (eds), The Diffusion of Social Movements: Actors, Mechanisms, and Political Effects. Cambridge: Cambridge University Press, 1–18. Granovetter M (1978) Threshold models of collective behavior. American Journal of Sociology 83(6), 1420–1443. Greenland S (2001) Ecologic versus individual-level sources of bias in ecologic estimates of contextual health effects. International Journal of Epidemiology 30(6), 1343–1350. Griffin CJ (2012) The Rural War. Captain Swing and the Politics of Protest. Manchester, UK: Manchester University Press. Hammond JL and Hammond B (1912) The Village Labourer 1760–1832. London: Longman Green & Co. Hassanpour N (2017) Leading from the Periphery and Network Collective Action. Cambridge: Cambridge University Press. Hobsbawm E and Rudé G (1973) Captain Swing. Harmondsworth: Penguin University Books. Holland M (2005) Swing Unmasked. The Agricultural Riots of 1830 to 1832 and their Wider Implications. Milton Keynes: FACHRS Publications. Jones P (2009) Finding Captain Swing: protest, parish relations, and the state of the public mind in 1830. International Review of Social History 54, 429–458. Kawalerowicz J and Biggs M (2015) Anarchy in the UK: economic deprivation, social disorganization, and political grie- vances in the London riot of 2011. Social Forces 94(2), 673–698. Kelejian H and Prucha I (1998) A generalized spatial two-stage least squares procedure for estimating a spatial autoregressive model with autoregressive disturbances. Journal of Real Estate Finance and Economics 17(1), 99–121. Kelejian H and Prucha I (2007) HAC estimation in a spatial framework. Journal of Econometrics 140(1), 131–154. Klein GR and Regan PM (2018) Dynamics of political protests. International Organization 72(2), 485–521. Kuran T (1989) Sparks and prairie fires: a theory of unanticipated political revolution. Public Choice 61(1), 41–74.
You can also read