The Medical Journal of Australia - accepted article - 4 September 2020
←
→
Page content transcription
If your browser does not render page correctly, please read the page content below
The Medical Journal of Australia – accepted article –
                 4 September 2020
4 September 2020

This article has been accepted for publication and has undergone full peer review but has not completed the copyediting,
typesetting, pagination and proofreading process; further changes may be made before final publication.

The probability of the 6-week lockdown in
Victoria (commencing 9 July 2020)
achieving elimination of community
transmission of SARS-CoV-2
Modelling suggests that elimination could have been achieved if Victoria had gone into full stage 4 lockdown
immediately from 9 July

Victoria is the unlucky state in a lucky country. Australian states and territories, other than N ew South Wales, have
achieved elimination of community transmission of the sudden acute respiratory syndrome coronavirus 2 (SARS-CoV-
2): 28 days of no locally acquired cases where the source is unknown; twice the maximum incubation period.
   The situation in NSW is mixed. On one hand, NSW had ongoing case notifications of 10 –20 per day in the month to
mid-August 2020, arising largely from imported cases from Victoria. On the other hand, on 16 July there had only been
three locally acquired cases of SARS-CoV-2 infection with no known source in the preceding 28 days, suggesting NSW
was on the cusp of elimination. 1 If NSW successfully contains the current outbreak, it may resume its prior trajectory
towards the elimination of local transmission, leaving Victoria isolated as the only state with community transmission.
As of late August, Queensland is also experiencing community transmission — possibly ending its elimination status
(as defined by 28 days of no locally acquired cases where the source is unknown ), subject to investigation of the new
cases.
   It seems unlikely that states and territories that have eliminated local transmission will relinquish their status by freely
opening borders and engaging with Victoria (and NSW if community transmission remains). Indeed, on 17 August the
Queensland Premier stated: “Let me make it very clear, we will always put Queenslan ders first and … we do not have
any intentions of opening any borders while there is community transmission active in Victoria and in New South
Wales”. 2 Australia proceeding with two separate systems (six or seven states and territories having eliminated t he virus,
one or two not) is a significant concern.
   There are three general strategic policy responses to the challenge of coronavirus disease 2019 (COVID-19):
elimination, suppression, and mitigation (or herd immunity). No response is free of economic, s ocial and health harms;
rather, it is about minimising harm. Society has largely rejected a mitigation response because of concerns about the
likely high morbidity and mortality arising from such a response. On 24 July, the Australian Health Protection Pri ncipal
Committee recommended “that the goal for Australia is to have no community transmission of COVID -19”, 3 and on the
same day Prime Minister Scott Morrison accepted and affirmed this recommendation, stating “The goal of that is
obviously, and has always been no community transmission”. 4 Unfortunately, this first clear statement that Australia’s
goal is to eliminate community transmission was late in coming, as the Victorian outbreak was already in full swing ,
with case numbers peaking at a 5-day average of about 500 per day from 29 July to 5 August, resulting in a stage 4
lockdown commencing on 3 August.

Elimination strategy
We know from New Zealand (population, 5.0 million) 5 and Taiwan (23.8 million) 6 that elimination of community
transmission is achievable in island jurisdictions, with NZ having no community transmission for 102 days until 11
August. The advantage of elimination is that despite international border closures or strict quarantine, citizens can go
about life with a near-normal functioning of their society and economy.
   Elimination presents challenges. First, there is the extra effort to achieve it, and the fact that aiming to achieve
elimination does not guarantee success. Second, having achieved elimination, there is the constant risk of the virus re-
entering due to quarantine breaches (eg, the current outbreak in NZ).
   How frequently a COVID-19-free jurisdiction with tight border controls will retain elimination status is unclear,
although we know that NZ lasted 102 days with no community transmission and that Western Australia, Northern
Territory, South Australia, Australian Capital Territory, Queensland and Tasmania achieved over 100 days without a
locally acquired case with no known source (although the status of Queensland is unclear as of early September).
The Medical Journal of Australia – accepted article –
4 September 2020
Was elimination achievable with a 6-week stage 3 lockdown as implemented in Victoria from 9
July, or a more stringent lockdown?
Lockdowns are effective for COVID-19 pandemic control. 7,8 Our case for an explicit elimination strategy in Victoria at
lockdown commencement in early July was that given Victoria was going into a lockdown for 6 weeks, there was
probably only a marginal extra cost of “going hard” with a rigorous public health response that increased the probability
of achieving elimination. But was elimination achievable within 6 weeks?
We examined four policy scenarios using an agent-based model, a type of microsimulation of individuals. The model
accurately reflects the prior experience of both NZ and Australia (https://github.com/JTHooker/COVIDModel), and here
we adapted it to Victoria (including the case counts up to 14 July; see Supporting Information for details). The four
policy approaches, all simulated from 9 July 2020, were:
Standard: reflecting the first Australian stage 3 lockdown (calibrated to case numbers as described at
https://github.com/JTHooker/COVIDModel), with key parameters including 85% of people observing physical
distancing; those observing physical distancing doing so 85% of the time; 30% of adult workers being essential
workers; 93% of people asked to isolate doing so; 20% uptake of the COVIDSafe app; but no closure of schools and
no mask wearing.
Standard with masks at 50%: Standard, plus 50% of people wearing masks in crowded indoor environments.
Stringent with masks at 50%: Standard with masks at 50%, plus schools closed and essential workers restricted to
20% of workers.
Stringent with masks at 90%: Stringent, with mask use increased to 90% (ie, close to stage 4, which was actually
implemented in Victoria as of 5 August after the 5-day moving average case numbers increased from 300 to 500 in
the first 3 weeks of stage 3).
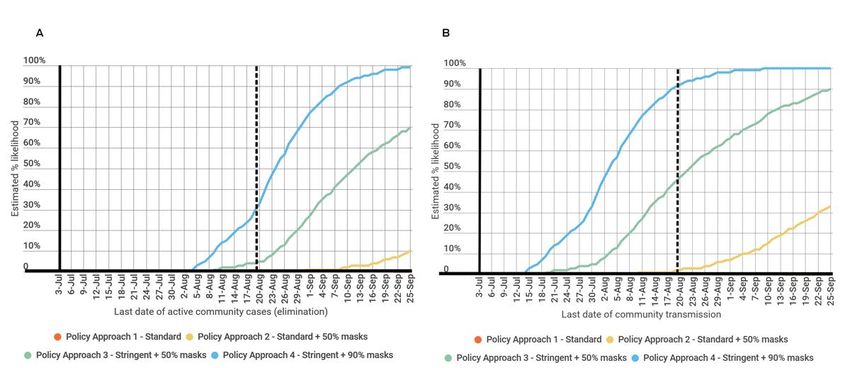
Box 1 shows the percentage likelihood of elimination in Victoria, defined as the date of clearance of infection by the
last case, and the date of last acquisition of infection. The model is omniscient about infectious status; in the real world,
based on a definition of 28 days of no cases, elimination would occur about 2 weeks after the clearance dates shown in
Box 1, A.
Under the “standard” policy approach (ie, equivalent to stage 3 without masks), there was no chance that all infected
people will have cleared their SARS-CoV-2 infection by 19 August (6 weeks after lockdown commenced; Box 1, A).
The probabilities for the other three policy approaches achieving elimination 6 weeks after implementation (Box 1, A)
were 0% for “standard with masks at 50%”; about 4% for “stringent with masks at 50%”; and 30% for “stringent with
masks at 90%”. The probabilities of the last actual infection occurring by 19 August were more encouraging at 0%, 1%,
45% and 90%, respectively (Box 1, B).
Of particular note, given that the stage 3 lockdown imposed on 9 July failed because caseloads increased to an average
of 500 per day, in our simulations 48% of the 1000 iterations of the “standard” scenario (stage 3, no masks) and 22% of
the 1000 iterations for “standard with masks at 50%” had peaks in the first 3 weeks in excess of 400 per day. This is
consistent with what eventuated, and further speaks (in hindsight) to the desirability of having gone straight into a stage
4 lockdown on 9 July; the “stringent with masks at 90%” scenario had no instances of peak cases greater than 400 per
day in the first 3 weeks.
Undertaking simulation modelling of SARS-CoV-2 policy options is challenging and the uncertainties are still
considerable even when using the best estimates available. Nevertheless, our results lend weight to the proposition that
elimination was achievable if Victoria had gone into stage 4 lockdown with mandatory wearing of masks immediately
from 9 July.
A ten-point plan to maximise the chance of elimination in Victoria
Box 2 lists enhancements to the stay-at-home orders of the 9 July lockdown. The first and critical point was leadership.
As above, we did get a clear statement of an elimination goal from the Chief Health Officers ( who comprise the
Australian Health Protection Principal Committee membership) and Prime Minister Scott Morrison on 24 July, but with
the benefit of hindsight it was perhaps too late. Target-setting is still not occurring (eg, a target number of cases per day
could be set for when we step out of stage 4 under both elimination and suppression strategy options). Moreover, an
expert advisory group on elimination was not convened, limiting the capacity for an optimal evidence-informed policy
response.
Nevertheless, since the 9 July lockdown, progress with other aspects of the ten-point plan has been made with the
closure of schools, mandatory mask wearing, and commitments to improve contact tracing capacity.
Conclusion
We argued in the preprint version of this article on 17 July that Melbourne and Victoria should not waste the opportunity
that the (then) 6-week lockdown presented and go hard and early. By learning from the lessons on social and preventive
measures to lower SARS-CoV-2 transmissibility, 7,8,12,14 and specifically the lessons from NZ, 3 Taiwan and the sixThe Medical Journal of Australia – accepted article –
4 September 2020
Australian jurisdictions that have achieved elimination, Victoria could have increased its chances of also eliminating
community transmission.
Our work and that of others who have independently considered the alternatives consistently demonstrates that
elimination was possible, and if achieved would have been optimal for health and for the economy in the long term.15-
17
In this article, we modelled the situation as at mid-July — we are now updating modelling under the current situation.
Authors’ note: This Perspective was submitted to the MJA on 16 July 2020 and published as a preprint on 17 July.9 The revised version, submitted on 23
August, retains the simulation modelling of the original but the uncertainty of inputs was updated to include uncertainty other than stochastic uncertainty. Our
aim was rapid modelling to estimate the probability of virus elimination during the planned 6-week stage 3 lockdown that Victoria had just commenced.
Competing interests: No relevant disclosures.
Provenance: Not commissioned; externally peer reviewed.
Author details
Tony Blakely1
Jason Thompson2
Natalie Carvalho3
Laxman Bablani1
Nick Wilson4
Mark Stevenson2
1 Centre for Epidemiology and Biostatistics, University of Melbourne, Melbourne, VIC.
2 Transport, Health and Urban Design Research Lab, University of Melbourne, Melbourne, VIC.
3 Centre for Health Policy, University of Melbourne, Melbourne, VIC.
4 University of Otago, Dunedin, NZ.
antony.blakely@unimelb.edu.au
References
1 New South Wales Government. COVID-19. https://www.nsw.gov.au/covid-19 (viewed Aug 2020).
2 Masige S. Queensland won't open its borders to Victoria and New South Wales until there is zero community transmission, the premier says. Business
Insider Australia 2020; 17 Aug. https://www.businessinsider.com.au/queensland-border-closure-victoria-new-south-wales-community-transmissions-
2020-8 (viewed Sept 2020).
3 Australian Health Protection Principal Committee. Australian Health Protection Principal Committee (AHPPC) statement on strategic direction. Canberra:
Australian Government Department of Health, 2020. https://www.health.gov.au/news/australian-health-protection-principal-committee-ahppc-statement-
on-strategic-direction (viewed Sept 2020).
4 Prime Minister of Australia. Press conference – Australian Parliament House, ACT. 24 July 2020. https://www.pm.gov.au/media/press-conference-
australian-parliament-house-act-24jul20 (viewed Sept 2020).
5 Baker MG, Kvalsvig A, Verrall AJ. New Zealand’s COVID-19 elimination strategy. Med J Aust 2020; 213: 198-200.
6 United Nations Department of Economic and Social Affairs. World population prospects 2019: data booklet. New York: UN, 2019.
7 Flaxman S, Mishra S, Gandy A, et al. Estimating the effects of non-pharmaceutical interventions on COVID-19 in Europe. Nature 2020; 584: 257–261.
8 Hsiang S, Allen D, Annan-Phan S, et al. The effect of large-scale anti-contagion policies on the COVID-19 pandemic. Nature 2020; 584: 262–267.
9 Blakely T, Thompson J, Carvalho N, et al. Maximizing the probability that the 6-week lock-down in Victoria delivers a COVID-19 free Australia. Med J Aust
2020; https://www.mja.com.au/journal/2020/maximizing-probability-6-week-lock-down-victoria-delivers-covid-19-free-australia [Preprint, 17 July 2020].
10 New Zealand Government Ministry of Health. Aotearoa/New Zealand’s COVID-19 elimination strategy: an overview. Wellington, NZ Ministry of Health,
2020. https://www.health.govt.nz/system/files/documents/pages/aotearoa-new_zealands_covid-19_elimination_strategy-_an_overview17may.pdf
(viewed Aug 2020).
11 Li X, Xu W, Dozier M, et al. The role of children in transmission of SARS-CoV-2: a rapid review. J Glob Health 2020; 10: 10.011101.
12 Bi Q, Wu Y, Mei S, et al. Epidemiology and transmission of COVID-19 in 391 cases and 1286 of their close contacts in Shenzhen, China: a retrospective
cohort study. Lancet Infect Dis 2020; 20: 911-919.
13 New Zealand Government. Unite against COVID-19. https://covid19.govt.nz/ (viewed Aug 2020).
14 Chu DK, Akl EA, Duda S, et al. Physical distancing, face masks, and eye protection to prevent person-to-person transmission of SARS-CoV-2 and
COVID-19: a systematic review and meta-analysis. Lancet 2020; 395: 1973-1987.
15 Daly J. COVID-19: the endgame and how to get there. Melbourne: Grattan Institute, 2020.
16 Group of Eight Australia. COVID-19 roadmap to recovery: a report for the nation. Canberra: Group of Eight, 2020. https://go8.edu.au/research/roadmap-
to-recovery (viewed Aug 2020).
17 Chang S, Harding N, Zachreson C, et al. Modelling transmission and control of the COVID-19 pandemic in Australia. arXiv 2020; 2003.10218v3.The Medical Journal of Australia – accepted article –
4 September 2020
[Boxes]
1 Percentage likelihood of elimination of community transmission of SARS-CoV-2 infection in Victoria, by
date of clearance of last active infection (A) and date of acquisition of last infection (B)*
* Across 1000 Monte Carlo simulations in an agent-based SEIR (susceptible, exposed, infectious, recovered) model. The vertical dashed
line is the date 6 weeks after implementation of the lockdown policies. Compared with modelling published in the preprint version of this
article, 9 the only change here is the inclusion of additional parameter uncertainty in addition to stochastic uncertainty (see Supporting
Information), resulting in increased sloping in the curves due to a wider range of potential parameter values (i e, the time distribution to
elimination is wider).The Medical Journal of Australia – accepted article –
4 September 2020
2 A ten-point plan to maximise the chance of successful elimination of community transmission of SARS-
CoV-2 in Victoria, based on the planned 6-week lockdown from 9 July 2020 (as published on 18 July
2020) 9
▪ Strong and decisive leadership with strategic clarity. An explicit goal of elimination should be art iculated, learning from
the New Zealand experience (Prime Minister Jacinda Ardern, government ministers and senior officials). 10 A clear set
of targets for loosening of policies needs to be articulated, so citizens know what is likely to happen and when.
▪ Convene an expert advisory group of experts in the elimination strategy and SARS -CoV-2 public health response,
reporting weekly to the Victorian Chief Health Officer, with the agenda, papers and minutes made publicly available.
▪ Close all schools. Although children do not usually suffer severe illness from SARS-CoV-2 infection, the virus still
transmits between children and staff in schools. 11 Accordingly, schools need to close until such time as the daily rate
of SARS-CoV-2 infection without a known source falls beneath a target set by the Chief Health Officer.
▪ Tighten the definition of essential shops to remain open. Supermarkets and chemists need to remain open. However,
department stores and hardware stores should be closed. A staged re-opening based on set target levels of daily
numbers of SARS-CoV-2 infection without a known source should then be implemented, so long as mask wearing by
both staff and patrons is mandatory, along with hand sanitiser use on entry and exit from stores.
▪ Require mask wearing by Melbourne residents in indoor environments where 1.5 m physical distancing cannot be
ensured, such as supermarkets and (especially) public transport. While no panacea, the wearing of masks reduces
the chance of infected people spreading the virus. 12
▪ Tighten the definition of essential workers and work. There is currently a loose definition of who is an essenti al worker
and what is essential work. This needs urgent tightening; for example, as per the NZ definitions used in their level 4
lockdown. 13
▪ Require mask wearing by essential workers whenever they are in close contact with people other than those in their
immediate household.
▪ Ensure financial and other supports to businesses, community and other groups most affected by more stringent stay -
at-home and lockdown requirements, and provide enhancements, targeted where warranted, to programs such as
JobKeeper and JobSeeker.
▪ Further strengthen contact tracing to ensure the majority of notifications (and their close contacts) are interviewed
within 24 hours of the index case notification and placed in isolation if necessary. The use of smart phone and digital
adjuncts needs to be improved, be that for initial contact tracing (eg, the COVID Safe App, or a South Korean-style
use of telecoms data) or monitoring of adequacy of isolation (eg, text message follow-up, GPS monitoring, or
electronic bracelets).
▪ Extend suspension of international arrivals into Victorian quarantine and divert resources. To allow a stronger focus
on elimination within Victoria, extend the suspension of international arrivals to Victoria. Quarantine capacity can be
redeployed for isolation of Melbournian residents infected with SARS-CoV-2 (and potentially high risk close contacts)
if they do not have satisfactory home environments for self-isolation.The Medical Journal of Australia – accepted article –
4 September 2020
Supporting Information: supplementary methods, table and references
The probability of the 6-week lock-down in Victoria (commencing 9 July 2020) achieving
elimination of community transmission of SARS-CoV-2
Individual agents making up a synthetic population representing the Victorian population were modelled using an agent -
based model (ABM) that has been built for multiple COVID-19 modelling tasks. For this paper, we utilised functionality
necessary for estimating the probability of, and time to, local elimination. The ABM was calibrated to produce an
unmitigated epidemic resulting in approximately 60% infection across the population, consistent with an estimated R0
value of between 2.3 and 2.75 1,2.
In the ABM, agents move and interact based on stochastic processes and/or in response to policies reflecting
exogenous, government-imposed restrictions. Their aggregate behaviour, experiences (e.g., of susceptibility, exposure,
infection and recovery) and actions were used to assess the effect of modelled SARS -CoV-2 elimination / suppression
strategies across the Victorian population. Specifically, we estimated the median date of elimination in Victoria under
such policies. Elimination was defined here as no active cases (both the clearance of infection among the last case, and
the (earlier) last case to get infected), which differs from that observable in the real-world as the model user has perfect
knowledge of active cases in the synthetic population – i.e., there is no need to wait for the lapse of multiple incubation
or illness periods 3.
Because the ABM is underpinned by stochastic processes, and there is uncertainty in parameters, we report results
from 1000 model runs conducted for 100 simulated days. All programming, documentation, data and details related to
the calculations, estimations and assumptions are available for do wnload from the online repository (see footnotes to
Table 1 for URLs).
Key generic parameters include population mobility and close contacts, quarantine measures and compliance,
transmissibility, age, student status, workforce status (e.g., essential worker status), household structure (including
group homes), superspreading events, school closure policies, case fatality rates based on age deciles, mask uptake and
mask efficacy, distance, and COVID-Safe tracing application uptake.
Stochasticity in the model occurs at two levels: 1) model initialization and parameter uncertainty, and 2) individual
agent actions. Uncertainty at the higher initialisation level is used in the model’s set -up procedures (e.g., the initial
stringency of policy settings, health system capacity, and desired restrictions on agent movement) as well as variables
that determine cut-off scores for binary classification of agents into groups of importance (e.g., essential workers). These
are generally ‘normal’ distributions.
There is also stochasticity in the lower-level factors attached to variables of importance for each agent. These are
often related to epidemiological factors (e.g., mask efficacy for individuals) or the likelihood of taking acti ons at each
time-step. These are more likely to be either beta distributions (in the case of probabilities between 0 and 1), or log -
normal distributions (e.g., distribution of individual incubation and illness durations should the agent become infected).
Parameters specifically used in the model under policies 1-4 (1. Standard, 2. Standard + 50% masks, 3. Stringent + 50%
masks, 4. Stringent + 90% masks) are set out in Table 1.The Medical Journal of Australia – accepted article –
4 September 2020
Table 1. Parameter estimates and ‘agent’ characteristics most relevant to current paper used in the agent -
based model (for full details see source code and ODD protocol in footnote to this table)
Key Parameters Parameter Estimates (Policies 1, 2, 3, 4)
Physical distancing (% of people limiting movement and m = 85%, sd = 3%
maintaining a distance of 1.5m in public, normal
distribution)¥ 4
Physical distancing - time (% of time that people m = 85%, sd = 3%
successfully maintain a distance of 1.5m, normal
distribution)¥4
Proportion of essential workers¥ m = 30% of working age-people in standard conditions 1 and 2,
m = 20% of working aged in stringent conditions 3 and 4,
Mean incubation period (days, log-normal)5 m = 5.1, sd = 1.5
Mean illness period (days, log-normal)6 m = 20.8, sd = 2
Mean adherence with isolation of infected cases (beta m = 93.3%
distribution) ¥ (beta 28, 2; median = 94.3%, SD = 4.5%) †
Potential super-spreaders as a proportion of infected m = 10%, sd = 2%
population (normal distribution)¥¥
Number of days after initial infection that new cases are 6*
reported¥*
Date of case simulation initialisation (Day 0) July 8th, 2020
Days from case 0 to policy enactment 1 (July 9th, 2020)
Asymptomatic cases (% of cases, normal distribution) 3,6 m = 25%, sd = 3%
Infectiousness of asymptomatic cases vs symptomatic m = 33%, sd = 6%
cases (per contact, normal distribution) 7
Schools shutdown policy enacted False (policies 1 and 2), True (policies 3 and 4)
Proportion of people wearing face-masks during 0% (policy 1), 50% (policies 2 and 3), 90% (policy 4)₤
interactions outside the home (specified scenario, so not
parameterized with uncertainty)
Reduction in transmission risk per contact for people 80%8 (beta 79.2, 19.8; median = 80.2%; SD = 4.0%).†
wearing face-masks (beta distribution) ¥¥¥
Compliance with isolation orders (beta distribution) ¥ 95% (beta 450.3, 23.7, 19.8; median = 95.1%; SD = 1.0%).†
Seeded cases An initial volume of 1000 active cases was seeded into the model
on day 0. This was followed by 7 days of new seeded, estimated (E)
cases, with estimates drawn from the previous period’s growth
phase E(t) = 5.54 * 1.12^t . (i.e. the seeded cases represent the
expected growth in infections already acquired; the model takes
over generating cases after about 7 days.)
COVID-Safe App Uptake (normal distribution) m = 20%, sd = 4%The Medical Journal of Australia – accepted article –
4 September 2020
Agent Characteristics Definition
Infection status Infected, susceptible, recovered, deceased
Time now The number of days (integer) since an infected person first
became infected with SARS-CoV-2
Age-range The age-bracket (categorical) of the person, set to census data
deciles from 0 to 100. Used in this simulation to capture
differences in exposure risk through school closures and
workforce status.
Risk of death The overall risk of death (float) for each person based on their
age-profile. Purely used in this simulation to remove the agents
dying during the 100 day simulation time.
Location Agents interact in over a 2-dimensional plane with their
location recorded at each time-step via an x/y coordinate
system.
Span The distance the person moves around the environment away
from their home location – longer distances result in higher
likelihood of close contact with novel other people (agents) in
the model.
Heading / Distance The direction and extent of travel of the person at the current
time-step. The heading and speed variables combine to create
local communities and control interaction between and across
communities. At higher lockdown stringency levels, agents are
restricted to movement in areas closer to their home location.
Contacts A count (integer) of contacts the person (agent) had interacted
with in the past day as they moved within the model’s
environment. This is used in estimation of contacts with
transmission potential each time-step and calculation of
individual reproduction numbers at the end of infectious
periods.
Code for ABM at: https://github.com/JTHooker/COVIDModel (last accessed 23 August 2020).
ODD protocol at: https://github.com/JTHooker/COVIDModel/blob/master/ODD%20Protocol%20Aus%20NZ%20COVID19%20mo del.pdf
(last accessed 23 August 2020).
¥ Assumed parameter based on expert opinion in conjunctions with available public data sources such as Google COVID -19 mobility
reports.
¥¥ 10% of the population potentially transmit infections widely through occasio nal travel to random locations.
¥¥¥ The source paper reports an adjusted odds ratio of 0.15 for a systematic review of observational studies. Given possible residual
confounding, and to be conservative, we used 80% rather than 85%.
*This reports all cases known to the model user on day 6 of their infection. In alternative modes, code also allows for under -reporting
under extreme pressure on the track and trace system (e.g., in unmitigated scenarios).
₤ % mask wearing is fixed part of scenario, therefore no uncertainty.The Medical Journal of Australia – accepted article –
4 September 2020
References
1 Rahman B, Sadraddin E, Porreca A. The basic reproduction number of SARS-CoV-2 in Wuhan is about to die out, how about the rest of the World?
Reviews in Medical Virology 2020; 30(4): e2111.
2 Davies NG, Klepac P, Liu Y, et al. Age-dependent effects in the transmission and control of COVID-19 epidemics. Nature Medicine 2020; 26(8): 1205-11.
3 Lokuge K, Banks E, Davis S, et al. Exit strategies: optimising feasible surveillance for detection, elimination and ongoing prevention of COVID-19
community transmission. medRxiv 2020: doi.org/10.1101/2020.04.19.20071217.
4 Google Incorporated. COVID-19 Community Mobility Report. United States: Google; 2020.
5 Lauer SA, Grantz KH, Bi Q, et al. The Incubation Period of Coronavirus Disease 2019 (COVID-19) From Publicly Reported Confirmed Cases: Estimation
and Application. Ann Intern Med 2020; 172: 577-82.
6 Bi Q, Wu Y, Mei S, et al. Epidemiology and transmission of COVID-19 in 391 cases and 1286 of their close contacts in Shenzhen, China: a retrospective
cohort study. Lancet Infect Dis 2020; 20: 911–19.
7 He D, Zhao S, Lin Q, et al. The relative transmissibility of asymptomatic COVID-19 infections among close contacts. Int J Infect Dis 2020; 94: 145-7.
8 Chu DK, Akl EA, Duda S, et al. Physical distancing, face masks, and eye protection to prevent person-to-person transmission of SARS-CoV-2 and
COVID-19: a systematic review and meta-analysis. The Lancet 2020; 395: 1973-1987.You can also read