The Most Challenging Places to Live With Allergies
←
→
Page content transcription
If your browser does not render page correctly, please read the page content below
The Most Challenging Places
   to Live With Allergies

                              1235 South Clark Street • Suite 305 • Arlington, VA 22202
                                     800-7-ASTHMA (800-727-8462) • aafa.org
Improving the Quality of Life
for People With Seasonal Allergies                                                                                                              THE IMPACT
                                                                                                                                                OF COVID-19
The Asthma and Allergy Foundation of America (AAFA) is pleased to share
                                                                                                                                                In 2020, fewer people were
the 2021 Allergy Capitals™ report. This report uses both spring and fall allergy
                                                                                                                                                affected by pollen allergies.
data to rank the 100 largest cities in the continental United States.
                                                                                                                                                When the year began, experts
Both spring and fall pollen has increasingly gotten worse every year with longer,                                                               expected weather and pollen
warmer growing seasons caused by climate change. These seasons produce                                                                          to have significant effects. By the
stronger pollen at higher quantities.                                                                                                           spring, COVID-19 restrictions
                                                                                                                                                kept many people inside more.
Since 2003, AAFA has produced this report to help people recognize, prevent, and                                                                This limited their exposure to
manage allergy symptoms. The report also helps communities see where the needs                                                                  pollen. Children felt the least
of people with allergic diseases can be better met. Through the ranking, we seek                                                                impact from seasonal allergies
to raise awareness about the impact of seasonal allergies. We also hope to provide                                                              due to closed schools and less
helpful information to improve the quality of life for people who experience them.                                                              time spent outdoors.
Communities need to work together to provide solutions to the challenges raised
by climate change, rising health care costs, and access to specialized care.

AAFA is dedicated to improving the quality of life for people with asthma and
allergic diseases through education, advocacy, research, and support. We will
continue to promote public policy ideas that improve and protect quality of life
and treatment options for people affected. People with asthma and allergies
should be able to find relief no matter where they live.

In this report, we cover:

• Background. . . . . . . . . . . . . . . . . . . . . . . . . . . . . . . . . . . . . . . . . . . . . . . . . . . . . . . . . . . . . . . . 3
• About Seasonal Allergies. . . . . . . . . . . . . . . . . . . . . . . . . . . . . . . . . . . . . . . . . . . . . . . . . . . . 4
• Managing Your Contact With Pollen. . . . . . . . . . . . . . . . . . . . . . . . . . . . . . . . . . . . . . . . . . 5
• Spotlight: Climate Change and Allergies. . . . . . . . . . . . . . . . . . . . . . . . . . . . . . . . . . . . . . 6
• 2021 Allergy Capitals™ . . . . . . . . . . . . . . . . . . . . . . . . . . . . . . . . . . . . . . . . . . . . . . . . . . . . . . 9
• Seasonal Ranking of Most Challenging Places to Live With Allergies. . . . . . . . . . . . 13
• Methodology, Acknowledgements, and References. . . . . . . . . . . . . . . . . . . . . . . . . . . 17

                                                                                                                                                                         allergycapitals.com          2
                                                                                                                                                          ©2021 Asthma and Allergy Foundation of America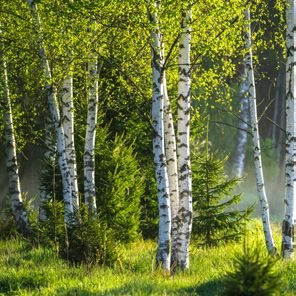
Background
ABOUT THE ASTHMA AND ALLERGY                             For millions of Americans, allergies are life-limiting. Allergic conditions
FOUNDATION OF AMERICA                                    are among the most common medical conditions affecting people in
Founded in 1953, AAFA is the oldest and largest          the United States. People with allergies need to know what allergens
non-profit patient organization dedicated to saving      trigger their symptoms, find ways to reduce their exposure to those
lives and reducing the burden of disease for people      allergens, and have access to the right treatments for their needs.1
with asthma, allergies, and related conditions through   Allergies are a major public health concern. More than 50 million
research, education, advocacy, and support.              Americans suffer from allergies every year.1 It is among the
                                                         country’s most common, but overlooked, diseases. There is no
                                                         cure for allergies. But allergies can be managed with prevention
                                                         and treatment. A good allergy treatment plan is based on medical
                                                         history, the results of allergy tests, and symptom severity. See the
                                                         “Managing Your Contact With Pollen” section on page 5 for tips
                                                         on ways to manage your seasonal allergy symptoms.

                                                         One of the most common allergic conditions is allergic rhinitis,
                                                         often called hay fever. It causes symptoms such as:
AAFA empowers patients and their families by
providing practical, evidence-based information          • Sneezing
and community programs and services. AAFA offers         • Stuffy nose
extensive online support communities for individuals     • Runny nose
and families affected by asthma and allergic diseases,   • Watery eyes
such as food allergies and atopic dermatitis (eczema).   • Itching of the nose, eyes, or the roof of the mouth
AAFA also helps consumers identify products to
                                                         Allergic sensitivity to airborne pollen from trees, grasses, or
help them have healthier homes through the asthma
                                                         weeds causes allergy symptoms. About 15% of children have
& allergy friendly® Certification Program. For more
                                                         seasonal allergic rhinitis or respiratory allergy.2 Allergic rhinitis
information, visit aafa.org, aafa.org/certified, and
                                                         can be seasonal or year-round. Symptoms of seasonal allergic
kidswithfoodallergies.org.
                                                         rhinitis usually occur in spring, summer, and/or fall. Allergies can
                                                         worsen asthma as well.

                                                                                                                allergycapitals.com          3
                                                                                                 ©2021 Asthma and Allergy Foundation of America
About Seasonal Pollen Allergies
People with allergic rhinitis may have symptoms that get worse during one season over another. Why? Different types of pollen allergens
peak at different times of the year. In the spring, tree pollen is more common. In the fall, weed pollen peaks.
SPRING FALL
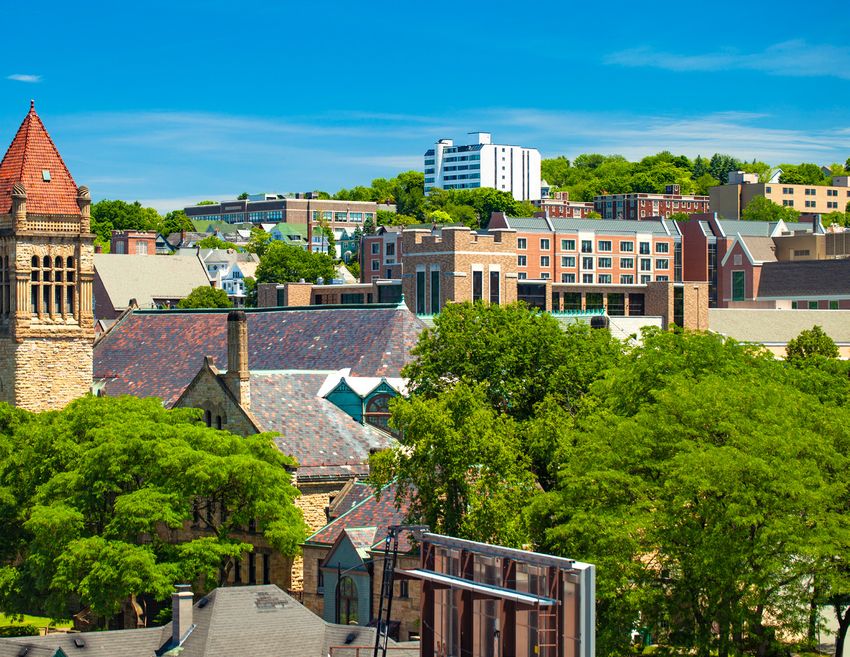
Tree pollen causes most springtime seasonal allergies. Tree pollen When it comes to fall pollen allergies, ragweed pollen is the
season can start as early as January in some states and can last worst offender. Ragweed allergy is the most common weed
through July. Tree pollen is smaller than many other types of pollen allergy. One ragweed plant can produce billions of light,
pollen. This allows the wind to carry it for miles, finding its way dry pollen grains, which can then travel for miles. Other weed
into sinuses, lungs, and eyes, making it hard to avoid. pollens can cause symptoms as well.
The most common tree pollen culprits are: These plants are responsible for causing most pollen allergy
symptoms in the fall:
• Alder • Hickory
• Ash • Mountain elder • Burning bush • Ragweed
• Aspen • Mulberry • Cocklebur • Russian thistle
• Beech • Oak • Lamb’s-quarters • Sagebrush
• Birch • Olive • Mugwort • Tumbleweed
• Box elder • Pecan • Pigweed
• Cedar • Poplar
• Cottonwood • Willow
• Elm
allergycapitals.com 4
©2021 Asthma and Allergy Foundation of America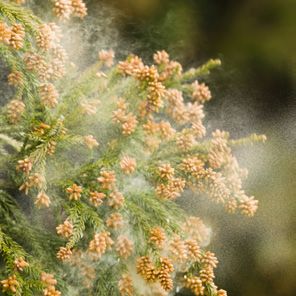
Managing Your Contact With Pollen
Spring allergy season begins with pollen released by trees. Grass pollen
appears later in the spring. Weeds release pollen in the late summer and
through the fall. There are apps that track local pollen counts to help people
manage their exposure. On days when pollen is high, take these actions to
reduce pollen contact:

• Check pollen counts daily and plan outdoor activities on days when pollen
   counts are lower.

• Keep windows closed.
                                                                                  Through the asthma & allergy friendly®
• If possible, use central air conditioning with a CERTIFIED asthma & allergy
                                                                                  Certification Program, we have tested
   friendly® HVAC filter.
                                                                                  and certified products to help you reduce
• Wear sunglasses and a hat or other hair covering when outdoors.                 allergens in your home. When you are
                                                                                  shopping for products for your home,
• Take a shower and wash your hair before going to bed (if your hair             look for the CERTIFIED asthma & allergy
   was uncovered outside).                                                        friendly® mark. Visit aafa.org/certified
• Change and wash clothes after outdoor activities.                               to search for CERTIFIED products and
                                                                                  learn more about our program.
• Dry laundry in a clothes dryer or on an indoor rack, not on an outdoor line.

• Wipe pets off with a towel before they enter your home.

• Remove your shoes before entering your home.

• Wash bedding in hot, soapy water once a week.

• Use a nasal rinse to flush out inhaled pollen.

There are also options available to prevent or treat allergy symptoms.
Some of these treatments work best if taken before allergy season begins:

• Allergy medicines – such as antihistamines

• Nasal corticosteroid sprays

• Immunotherapy – shots or tablets available as a long-term treatment that
   can help prevent or reduce the severity of reactions

Talk with your doctor before allergy season begins about which treatment
is right for you.

                                                                                                                 allergycapitals.com          5
                                                                                                  ©2021 Asthma and Allergy Foundation of America
Spotlight: Climate Change and Allergies
The impact of climate change has become a dangerous cycle.        Rising CO2 levels in the air increase pollen. This can
As global temperatures rise, extreme weather events become        trigger asthma and allergy symptoms. Researchers have
worse. Weather changes – such as heat waves and droughts –        studied the relationship between CO2 and pollen. A 2014
can lead to stagnant air (a lack of air flow). When the air       study looked at the relationship between CO2 levels and
doesn’t move, pollutants react together in the heat and sun.      Timothy grass pollen. They tested CO2 at 400 parts per
This increases ground-level ozone.3                               million (ppm), which is near current levels. Then they
                                                                  tested CO2 at 800 ppm, where levels are expected to be
Ground-level ozone is a major part of urban smog. More air
                                                                  at the end of the century if trends continue. In this study,
pollution and smog cause higher levels of carbon dioxide (CO2).
                                                                  grass pollen tripled when CO2 levels doubled.4
This results in warmer temperatures. And the cycle continues.
                                                                  CO2 IMPACT ON GRASS POLLEN PRODUCTION
                                                                                                25
                         es             Ext
                      tur                  rem
                     a                                                                                                                 CO2 = 800ppm
                    r                         e
                  pe                              W
                                                                                                20

                                                                  Grains of Pollen (millions)
             m

                                                  ea
           Te

                                                    th
         ing

                                                      er
      Ris

                                                                                                15
                                                                                                                    CO2 = 600ppm

                              GLOBAL
                              WARMING                                                           10
  CO2                          CYCLE
                                                                                                     CO2 = 400ppm
                                                   llu vel

                                                                                                 5
                                                           n
                                                      ti o
                                                Po -Le
      Ca

                                              ir und
       In on

                     1         2        3             4+
        rb
         cr

                 a                                                                              0
               D sed
                                               ro
           e

                                               G
                io
                   xi                      sed d A                                                      2014           2060                  2085
                      de                ea     n
                                    Incr n e a                                                                         Year
                                     O z o
                                                                  Source:
                                                                      25 Albertine et al., Projected Carbon Dioxide to Increase Grass Pollen
                              43%                                 and Allergen Exposure Despite Higher Ozone Levels (2014)

                                                                                                20                                     CO2 = 600ppm
                                    25%                                                                                                  allergycapitals.com          6
                   23%
                                                                  ed Plant

                                                                                                                          ©2021 Asthma and Allergy Foundation of America

                                                                                                15
15

     Grains of Pollen (

                                                                                 Grams per
                                                   CO2 = 600ppm                                                                            CO2 = 370ppm
                                                                                                               10

                               10

                                    CO = 400ppm                                          5
          5         2

     Another study showed that rising CO2 levels also lead to                        Rising CO2 CO  2 = 280ppm
                                                                                                 levels  also contribute to rising temperatures,
     increased ragweed pollen. Researchers project if trends                         leading to longer growing seasons. The length of the
4+   continue, the levels of ragweed pollen will double between                      growing season refers to the number of days when plant
          0
     the years 2000-2060.5                                                           growth
                                                                                         0 takes place.
                      2014            2060             2085
                                                                                                      1900             2000             2060
                                      Year
     CO2 IMPACT ON RAGWEED POLLEN PRODUCTION                                         LONGER U.S. GROWING SEASON         Year
                                                                                     (MORE DAYS ABOVE FREEZING)
                               25
                                                                                                               15

                               20                                 CO2 = 600ppm
                                                                                                               10

                                                                                 Deviation From Average Days
     Grams per Ragweed Plant

                               15
                                                                                                                5

                                                   CO2 = 370ppm
                               10                                                                                   Long-Term Average
                                                                                                                0

                                5                                                                              -5
                                    CO2 = 280ppm

                               0                                                                               -10
                                       1900           2000           2060                                        1895    1910   1925    1940     1955   1970     1985 2000 2015
                                                      Year                                                                                     Year

     Source: Ziska & Caulfield, Rising CO2 And Pollen Production of Common           Source: Kunkel, 2016 update to data originally published in: Kunkel, K.E.,
          15 (Ambrosia Artemisiifolia L.), A Known Allergy-Inducing Species:
     Ragweed                                                                         D.R. Easterling, K. Hubbard, and K. Redmond. 2004. Temporal variations in
     Implications For Public Health. (2000)                                          frost-free season in the United States: 1895–2000. (2016)

                               10
     verage Days

                                                                                                                                                                   allergycapitals.com          7
                                                                                                                                                    ©2021 Asthma and Allergy Foundation of America

                               5
Climate change in the top 20 Allergy Capitals of 2021 has The last freeze in many cities is occurring earlier in the year.
increased average temperatures since 1970. This last freeze signals the beginning of spring. An earlier
start to spring gives plants more time to grow. Spring across
Average spring Average fall the U.S. is 2 degrees warmer on average.6 Fall for much of
2021 Metropolitan temperature temperature the U.S. is also getting warmer, making the summer growing
Rank Area (°F) increase (°F) increase
season last longer. Most analyzed U.S. cities have fall seasons
since 1970 since 1970
that are 2.5 degrees warmer on average.7
1 Scranton, PA 2.5 2.6
2 Richmond, VA 2.1 1.9 More than 24 million people already have seasonal allergic
rhinitis, and pollen allergies are a major cause.8 If we don’t
3 Wichita, KS 3.0 2.8 slow down the cycle, pollen production will only get worse.
4 McAllen, TX 3.6 3.7 And with warmer, longer seasons, allergy-causing plants
5 Pittsburgh, PA 2.8 2.0 can move into new areas. This can expose people to new
allergens they have not experienced before.
6 Hartford, CT 0.7 2.3
7 Springfield, MA 0.7 2.3
8 New Haven, CT 1.8 1.9
9 Oklahoma City, OK 1.9 1.6 So how do we fix the issue of climate change and
its impact on people with allergies? Laws created
10 Bridgeport, CT 1.8 1.9
to reduce emissions and air pollution can make a
11 Albany, NY 2.4 3.0 difference. We need policy makers to act now to slow
12 Virginia Beach, VA 2.3 1.1 down climate change and reduce its impact on human
13 Buffalo, NY 1.4 2.3 health. Join AAFA at aafa.org/join and follow our blog
for Advocacy Action Alerts. We offer simple ways to
14 San Antonio, TX 2.4 2.7
contact your representatives to encourage them
15 Dayton, OH 2.0 1.5 to act on issues important to the health of
16 Riverside, CA 3.3 5.4 people with allergies and asthma.
17 Las Vegas, NV 6.5 6.0
18 Memphis, TN 1.6 1.8
19 Dallas, TX 2.9 3.0
20 Louisville, KY 3.7 2.7
Source: Climate Central temperature data, February 2021
allergycapitals.com 8
©2021 Asthma and Allergy Foundation of America2021 Allergy Capitals™ OVERALL RANKING
Total Score
2021 Rank Metropolitan Area Overall
(Avg 64.43)
1 Scranton, PA 100.00 ■
2 Richmond, VA 98.78 ■
3 Wichita, KS* 89.09 ■
4 McAllen, TX 85.76 ■
99
80 5 Pittsburgh, PA 85.63 ■
93 6 Hartford, CT 85.37 ■
65 7 76
66 7 Springfield, MA 84.28
81 13 22 11 1068 32 ■
86
87 94 24 40 1 46 58 8 New Haven, CT 83.61 ■
59 4737 25
78 28
64 5 79 9 Oklahoma City, OK 83.18 ■
90
85 77 63 1535 72
97 68 82
88 95 98 91 2 12 10 Bridgeport, CT 82.90 ■
96 92 84 71 27 20
69 3 42 83
53 100 11 Albany, NY 82.42 ■
17 73 26 52
45 56 16 21 18 54 29 23 12 Virginia Beach, VA 82.22 ■
75 9 44 49 62 36
89 74 57 13 Buffalo, NY 82.19 ■
39 19 67 14 San Antonio, TX 81.00 ■
34 30
48
61 50
41 43 38 55 15 Dayton, OH 79.34 ■
14 70 60
51 16 Riverside, CA 78.67 ■
33 31
17 Las Vegas, NV 77.58 ■
4
18 Memphis, TN 75.38 ■
■ Worse Than Average ▲Average ● Better Than Average 19 Dallas, TX 74.70 ■
20 Louisville, KY 74.52 ■
21 Tulsa, OK 73.49 ■
22 Syracuse, NY 73.32 ■
23 Columbia, SC 72.67 ■
24 Grand Rapids, MI 71.63 ■
25 Allentown, PA 71.29 ■
*New methodology by IRI has allowed for more coverage of OTC sales data in
certain marketplaces, which has impacted the ranking of Wichita, KS
allergycapitals.com 9
©2021 Asthma and Allergy Foundation of America2021 Allergy Capitals™ OVERALL RANKING
Total Score
2021 Rank Metropolitan Area Overall
(Avg 64.43)
26 Knoxville, TN 70.81 ▲
27 St. Louis, MO 70.21 ▲
28 Philadelphia, PA 69.14 ▲
29 Greenville, SC 68.80 ▲
99
80 30 Jacksonville, FL 68.11 ▲
93 31 Miami, FL 68.07 ▲
65 7 76
66 32 Providence, RI 67.57 ▲
86 81 13 22 11 1068 32
87 94 24 40 1 46 58 33 Cape Coral, FL 67.09 ▲
59 4737 25
78 28
85 63 64 5 79 34 El Paso, TX 66.91 ▲
90 77 1535 72
97 68 82
88 95 98 91 2 12 35 Columbus, OH 66.49 ▲
96 92 84 71 27 20
69 3 42 83
53 100 36 Charleston, SC 66.43 ▲
17 73 26 52
45 56 16 21 54 29 23 37 Akron, OH 65.82 ▲
9 18
75 44 49 62 36 38 Orlando, FL 65.79
89 74 57 ▲
39 19 67 39 Tucson, AZ 65.64 ▲
34 30
48 40 Detroit, MI 64.79
61 50
41 43 38 55 ▲
14 70 60 41 Baton Rouge, LA 64.77
51
33 31 ▲
42 Greensboro, NC 64.47 ▲
4
43 New Orleans, LA 64.26 ▲
■ Worse Than Average ▲Average ● Better Than Average 44 Little Rock, AR 64.10 ▲
45 Oxnard, CA 63.93 ▲
46 Poughkeepsie, NY 63.89 ▲
47 Cleveland, OH 63.71 ▲
48 Daytona Beach, FL 63.67 ▲
49 Atlanta, GA 62.80 ▲
50 Houston, TX 62.74 ▲
allergycapitals.com 10
©2021 Asthma and Allergy Foundation of America2021 Allergy Capitals™ OVERALL RANKING
Total Score
2021 Rank Metropolitan Area Overall
(Avg 64.43)
51 Sarasota, FL 62.72 ▲
52 Charlotte, NC 62.70 ▲
53 Winston-Salem, NC 62.54 ▲
54 Chattanooga, TN 62.28 ▲
99
80 55 Palm Bay, FL 62.16 ▲
93 56 Los Angeles, CA 62.06 ▲
65 7 76
66 57 Birmingham, AL 61.91 ▲
86 81 13 22 11 1068 32
87 94 24 40 1 46 58 58 New York, NY 61.87 ▲
59 4737 25
78 28
85 63 64 5 79 59 Toledo, OH 61.68 ▲
90 77 1535 72
97 68 82
88 95 98 91 2 12 60 Lakeland, FL 61.05 ▲
96 92 84 71 27 20
69 3 42 83
53 100 61 Austin, TX 60.95 ▲
17 73 26 52
45 56 16 21 54 29 23 62 Augusta, GA 60.54 ▲
9 18
75 44 49 62 36 63 Des Moines, IA 60.40
89 74 57 ▲
39 19 67 64 Chicago, IL 60.26 ▲
34 30
48 65 Rochester, NY 59.67
61 50
41 43 38 55 ▲
14 70 60 66 Worcester, MA 59.59
51
33 31 ▲
67 Jackson, MS 59.51 ▲
4
68 Indianapolis, IN 59.16 ▲
■ Worse Than Average ▲Average ● Better Than Average 69 Bakersfield, CA 58.56 ▲
70 Tampa, FL 58.45 ▲
71 Kansas City, MO 58.35 ▲
72 Washington, DC 57.79 ▲
73 Nashville, TN 57.61 ▲
74 Phoenix, AZ 57.54 ▲
75 Albuquerque, NM 57.52 ▲
allergycapitals.com 11
©2021 Asthma and Allergy Foundation of America2021 Allergy Capitals™ OVERALL RANKING
Total Score
2021 Rank Metropolitan Area Overall
(Avg 64.43)
76 Boston, MA 57.48 ●
77 Omaha, NE 57.34 ●
78 Harrisburg, PA 57.02 ●
79 Baltimore, MD 56.91 ●
99
80 80 Spokane, WA 55.98 ●
93 81 Minneapolis, MN 55.85 ●
65 7 76
66 82 Cincinnati, OH 54.63 ●
86 81 13 22 11 1068 32
87 94 24 40 1 46 58 83 Raleigh, NC 54.32 ●
59 4737 25
78 28
85 63 64 5 79 84 Colorado Springs, CO 54.14 ●
90 77 1535 72
97 68 82
88 95 98 91 2 12 85 Ogden, UT 52.54 ●
96 92 84 71 27 20
69 3 42 83
53 100 86 Boise, ID 50.94 ●
17 73 26 52
45 56 16 21 54 29 23 87 Madison, WI 50.64 ●
9 18
75 44 49 62 36 88 San Francisco, CA 50.31
89 74 57 ●
39 19 67 89 San Diego, CA 50.02 ●
34 30
48 90 Sacramento, CA 49.82
61 50
41 43 38 55 ●
14 70 60 91 Denver, CO 49.22
51
33 31 ●
92 Fresno, CA 48.29 ●
4
93 Portland, OR 47.81 ●
■ Worse Than Average ▲Average ● Better Than Average 94 Milwaukee, WI 46.91 ●
95 Stockton, CA 45.17 ●
96 San Jose, CA 45.12 ●
97 Salt Lake City, UT 44.95 ●
98 Provo, UT 42.61 ●
99 Seattle, WA 41.95 ●
100 Durham, NC 37.56 ●
allergycapitals.com 12
©2021 Asthma and Allergy Foundation of AmericaSeasonal Ranking of Most Challenging Places to Live With Allergies
SPRING RANKING FALL RANKING
2021 Spring Rank Metropolitan Area 2021 Fall Rank Metropolitan Area
1 Richmond, VA 1 Scranton, PA
2 Scranton, PA 2 Richmond, VA
3 Wichita, KS* 3 Wichita, KS*
4 Virginia Beach, VA 4 McAllen, TX
5 Pittsburgh, PA 5 Pittsburgh, PA
6 Hartford, CT 6 Buffalo, NY
7 Oklahoma City, OK 7 Hartford, CT
8 McAllen, TX 8 Springfield, MA
9 Las Vegas, NV 9 New Haven, CT
10 Springfield, MA 10 Albany, NY
11 New Haven, CT 11 Bridgeport, CT
12 Bridgeport, CT 12 San Antonio, TX
13 Riverside, CA 13 Oklahoma City, OK
14 Albany, NY 14 Dayton, OH
15 Dayton, OH 15 Virginia Beach, VA
16 San Antonio, TX 16 Riverside, CA
17 Buffalo, NY 17 Syracuse, NY
18 Columbia, SC 18 Memphis, TN
19 Dallas, TX 19 Grand Rapids, MI
20 Memphis, TN 20 Louisville, KY
*New methodology
21 Louisville, KY 21 Dallas, TX by IRI has allowed
22 Tulsa, OK 22 Tulsa, OK for more coverage
of OTC sales data in
23 Knoxville, TN 23 Las Vegas, NV certain marketplaces,
24 Allentown, PA 24 St. Louis, MO which has impacted
the ranking of
25 Greenville, SC 25 Miami, FL Wichita, KS
allergycapitals.com 13
©2021 Asthma and Allergy Foundation of AmericaSeasonal Ranking of Most Challenging Places to Live With Allergies
SPRING RANKING FALL RANKING
2021 Spring Rank Metropolitan Area 2021 Fall Rank Metropolitan Area
26 Syracuse, NY 26 Allentown, PA
27 Philadelphia, PA 27 Columbia, SC
28 Jacksonville, FL 28 Knoxville, TN
29 Providence, RI 29 Columbus, OH
30 Tucson, AZ 30 Philadelphia, PA
31 St. Louis, MO 31 Akron, OH
32 Charleston, SC 32 El Paso, TX
33 Cape Coral, FL 33 Jacksonville, FL
34 Grand Rapids, MI 34 Greenville, SC
35 Greensboro, NC 35 Cape Coral, FL
36 El Paso, TX 36 Providence, RI
37 Poughkeepsie, NY 37 Detroit, MI
38 Orlando, FL 38 Orlando, FL
39 Miami, FL 39 Baton Rouge, LA
40 Winston-Salem, NC 40 Cleveland, OH
41 Charlotte, NC 41 New Orleans, LA
42 Atlanta, GA 42 Charleston, SC
43 Oxnard, CA 43 Little Rock, AR
44 Little Rock, AR 44 Daytona Beach, FL
45 New York, NY 45 Des Moines, IA
46 Columbus, OH 46 Toledo, OH
47 Akron, OH 47 Rochester, NY
48 Baton Rouge, LA 48 Oxnard, CA
49 Daytona Beach, FL 49 Tucson, AZ
50 Detroit, MI 50 Austin, TX
allergycapitals.com 14
©2020
©2021 Asthma and Allergy Foundation of AmericaSeasonal Ranking of Most Challenging Places to Live With Allergies
SPRING RANKING FALL RANKING
2021 Spring Rank Metropolitan Area 2021 Fall Rank Metropolitan Area
51 Houston, TX 51 Palm Bay, FL
52 New Orleans, LA 52 Sarasota, FL
53 Sarasota, FL 53 Chattanooga, TN
54 Augusta, GA 54 Chicago, IL
55 Birmingham, AL 55 Houston, TX
56 Los Angeles, CA 56 Greensboro, NC
57 Chattanooga, TN 57 Los Angeles, CA
58 Palm Bay, FL 58 Indianapolis, IN
59 Cleveland, OH 59 Poughkeepsie, NY
60 Lakeland, FL 60 Birmingham, AL
61 Washington, DC 61 Atlanta, GA
62 Worcester, MA 62 Lakeland, FL
63 Jackson, MS 63 Charlotte, NC
64 Toledo, OH 64 Winston-Salem, NC
65 Bakersfield, CA 65 Kansas City, MO
66 Austin, TX 66 New York, NY
67 Albuquerque, NM 67 Jackson, MS
68 Phoenix, AZ 68 Worcester, MA
69 Tampa, FL 69 Augusta, GA
70 Baltimore, MD 70 Omaha, NE
71 Chicago, IL 71 Tampa, FL
72 Boston, MA 72 Bakersfield, CA
73 Nashville, TN 73 Nashville, TN
74 Harrisburg, PA 74 Boston, MA
75 Des Moines, IA 75 Harrisburg, PA
allergycapitals.com 15
©2021 Asthma and Allergy Foundation of AmericaSeasonal Ranking of Most Challenging Places to Live With Allergies
SPRING RANKING FALL RANKING
2021 Spring Rank Metropolitan Area 2021 Fall Rank Metropolitan Area
76 Indianapolis, IN 76 Minneapolis, MN
77 Kansas City, MO 77 Phoenix, AZ
78 Spokane, WA 78 Albuquerque, NM
79 Omaha, NE 79 Cincinnati, OH
80 Raleigh, NC 80 Baltimore, MD
81 Rochester, NY 81 Spokane, WA
82 Colorado Springs, CO 82 Washington, DC
83 Minneapolis, MN 83 Colorado Springs, CO
84 Ogden, UT 84 Raleigh, NC
85 Sacramento, CA 85 Madison, WI
86 San Francisco, CA 86 Ogden, UT
87 Cincinnati, OH 87 San Diego, CA
88 Boise, ID 88 Boise, ID
89 Portland, OR 89 Milwaukee, WI
90 San Diego, CA 90 Denver, CO
91 Denver, CO 91 Fresno, CA
92 Stockton, CA 92 San Francisco, CA
93 Fresno, CA 93 Sacramento, CA
94 Madison, WI 94 Portland, OR
95 San Jose, CA 95 Salt Lake City, UT
96 Salt Lake City, UT 96 San Jose, CA
97 Milwaukee, WI 97 Provo, UT
98 Seattle, WA 98 Stockton, CA
99 Provo, UT 99 Seattle, WA
100 Durham, NC 100 Durham, NC
allergycapitals.com 16
©2021 Asthma and Allergy Foundation of AmericaMETHODOLOGY ACKNOWLEDGEMENTS
The 2021 Allergy Capitals™ research and ranking is reported by the Asthma The 2021 Allergy Capitals™ report is an independent research project
and Allergy Foundation of America (AAFA). The ranking is based on analysis by the Asthma and Allergy Foundation of America. This comprehensive
of data from the 100 most-populated Metropolitan Statistical Areas (MSAs) report would not have been possible without the following contributors:
in the contiguous 48 states. The four (4) individual factors analyzed for the
2021 rankings are: seasonal pollen scores (spring and fall), over-the-counter •M itchell Grayson, MD; Chair of AAFA's Medical Scientific Council;
medication use (allergy), and number of allergy specialists. Division of Allergy and Immunology Director and Professor of Pediatrics
at Nationwide Children's Hospital and The Ohio State University
For each factor, AAFA used the most recently available 12-month data. • Hannah Jaffee, lead researcher • Tanya Bumgardner, editor
Weights are applied to each factor; factors are not weighted equally. Total • Sanaz Eftekhari, reviewer • Nicole Gaghan, designer
scores are calculated as a composite of all four factors, and cities are ranked • Melanie Carver, reviewer • Kimberly Rafferty, project manager
from highest total score (city rank #1) to lowest total score (city rank #100).
Cities are assigned icons for worse than average (top 25), average (middle AAFA would like to thank Climate Central for in-kind support and data.
50), and better than average (lower 25).
REFERENCES
Seasonal (Spring and Fall) Pollen Scores
For each city, AAFA obtained a comprehensive index of the population at 1. Allergy Facts. (2018, January 9). Retrieved from http://acaai.org/news/
risk of being affected by airborne allergenic pollen, derived from actual facts-statistics/allergies
pollen counts, allergy prevalence for each pollen type, and related factors, 2. Table 12. Health conditions among children under age 18, by selected
for the most recent spring and fall allergy seasons (2020). characteristics: United States, average annual, selected years 1997–1999
through 2015–2017. (2019, October 30). Retrieved from https://www.cdc.
Medication Use gov/nchs/data/hus/2018/012.pdf
For each city, AAFA obtained over-the-counter sinus and allergy medication 3. Climate Change is Threatening Air Quality across the Country. (2019,
sales data per patient prevalence for the most recent calendar year (2020). July 30). Retrieved from https://www.climatecentral.org/news/climate-
change-is-threatening-air-quality-across-the-country-2019
Number of Allergy Specialists
4. Albertine, J. M., Manning, W. J., DaCosta, M., Stinson, K. A., Muilenberg, M.
For each city, AAFA obtained the number of board-certified allergists/ L., & Rogers, C. A. (2014). Projected Carbon Dioxide to Increase Grass
immunologists per patient prevalence. The most recent publicly available Pollen and Allergen Exposure Despite Higher Ozone Levels. PLoS ONE,
data are from American Board of Medical Specialties (2019). 9(11), e111712. Retrieved from https://doi.org/10.1371/journal.pone.0111712
Data Sources 5. Ziska, L. H., & Caulfield, F. A. (2000). Rising CO2 and pollen production of
common ragweed (Ambrosia artemisiifolia L.), a known allergy-inducing
• American Board of Medical Specialties, Specialists Database
species: implications for public health. Functional Plant Biology, 27(10),
• IQVIA Allergy Activity Notification (AAN) Program Database 893. Retrieved from https://doi.org/10.1071/pp00032
• IRI Medication Sales Database
6. Spring Warming Across the U.S. (2019, March 6). Retrieved from https://
• U.S. Department of Commerce, Bureau of the Census,
www.climatecentral.org/gallery/graphics/spring-warming-across-the-us
Metropolitan and Micropolitan Statistical Areas
7. Fall is Getting Warmer (2019, September 4). Retrieved from
https://medialibrary.climatecentral.org/resources/fall-is-getting-warmer-1
CONTACT AAFA 8. FastStats: Allergies and Hay Fever. (2021, January 25). Retrieved from
https://www.cdc.gov/nchs/fastats/allergies.htm
Media questions: media@aafa.org
Patient questions: info@aafa.org
allergycapitals.com 17
©2021 Asthma and Allergy Foundation of AmericaYou can also read