Condo Bubble The Myth of - The Toronto
←
→
Page content transcription
If your browser does not render page correctly, please read the page content below
The Myth of
   The Toronto
Condo Bubble by Brad J. Lamb
Brad J. Lamb
President, Broker, Brad J. Lamb Realty Inc.
CEO, Lamb Developments Corp.

Brad J. Lamb has been selling real estate in Toronto since
1988. In 1995 he founded Brad J. Lamb Realty Inc., a boutique
brokerage operation specializing in urban condos, lofts, and
townhomes. Since being licensed, Brad J. Lamb has sold over
21,000 properties for over $7.5 billion.

Currently with a staff of eight administrators and twenty-three
licensed sales representatives, Brad J. Lamb Realty Inc. is the
dominant name in the central Toronto real estate marketplace.

The company consists of two sales divisions, re-sale and new
sale. A few of the over one hundred new projects handled
exclusively by Brad J. Lamb Realty Inc. since 1996 are: Toy
Factory Lofts, Radio City, Spire, 550 Wellington Condominium
and Hotel, 75 Portland, Quad, Gläs, Zen Lofts, Tip Top Lofts,
East, Mozo, Garment Factory, The Printing Factory, Robert
Watson Lofts, The Glasshouse, six50 King West, The Ninety,
Parc, Cube, Flatiron Lofts, The King East, Worklofts, Theatre
Park, The King Charlotte, One Eleven, and The Brant Park.
The company prides itself on excellence. Every sales
representative and employee working at Brad J. Lamb Realty
Inc. is a specialist offering a tremendous level of experience and
knowledge to our widespread client list.

Brad J. Lamb founded Lamb Development Corp. in 2002 as a
response to the city’s demand for ethical modern development.
His development company has developed almost 2,000 units in
Toronto, Ottawa, and Montreal; projects such as Gläs, East,
Zen Lofts, East, 169 John, The King East, Mondrian, McGill
Ouest, The East Market, Worklofts, Flatiron Lofts, Riverside
Towns, Theatre Park, The Brant Park, and the King Charlotte,
Mondrian, Gotham and SoBa (in Ottawa), and 6th and Tenth
(in Calgary) with several more on the drawing board. Lamb
Development Corp’s mandate is to create beautiful and stylish
homes in urban environments for the every man.

THE MYTH OF THE
TORONTO CONDO BUBBLE

There has never been a signifi-    drop occurred in average              worse for Canada than the
cant North American real           prices (1982, 1991, 2008). In         United States. You can see
estate correction without an       Toronto, a bubble bursting            that while the U.S. suffered a
accompanying recession, as         type of real estate correction        mild slowdown through
seen by the following charts       did not occur in 1982 or 2008,        negative GDP, the average real
which show both U.S. and           but it did take place in 1991         estate price dipped only
Canadian GDP against average       where condo prices dropped            slightly in 1992 and recovered
real estate prices. We can see     by 40% and average prices             quickly. GDP bounced back
the last three recessions were     dropped by 25%. This                  quickly to a roaring 4%
the only instances where any       recession was particularly            annually while in Canada it
                                                                         took 3 years for our GDP to
                                                                         match that of the U.S. The
          GDP ANNUAL GROWTH RATE CANADA VS USA                           United States never had a
10                                                                       deck clearing real estate
                                    Canada           USA
 8                                                                       event. The Canadian recession
 6                                                                       of 1991 was devastating to
 4                                                                       Toronto real estate. With
 2                                                                       bank rates at over 12.5% and
 0                                                                       unemployment eventually
-2                                                                       climbing to over 12%, this

                                                                                                          THE MYTH OF THE TORONTO CONDO BUBBLE
-4                                                                       double whammy destroyed
-6                                                                       the real estate economy of
          1980   1985    1990     1995        2000         2005   2010
                                                                         Toronto and devastated the
                                                                         valuations of condominiums.
            AVERAGE SALES PRICE TORONTO VS USA                           Time to sell swelled to a year
 500000
                                                                         in some cases and prices
                                    Toronto          USA
 400000                                                                  plummeted by as much as
 300000
                                                                         50%. It took until 2002, or
                                                                         twelve years, for average
 200000
                                                                         prices to regain what was lost
 100000                                                                  in this recession. The United
     0
                                                                         States took just 3 years until
          1980   1985    1990     1995        2000         2005   2010   1994 to recapture the slight
                                                                         losses earned through their      1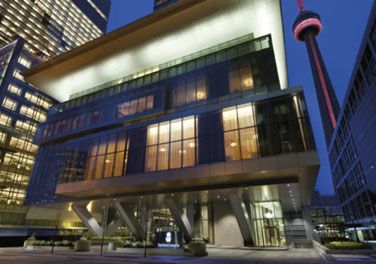
INTRODUCTION

                                       recession. If we look at the                       CANADA UNEMPLOYMENT RATE
                                       Canadian version of the “great      15
                                                                           14
                                       recession” of 2008, we see          13
                                                                           12
                                       that it was shallower and           11
                                       shorter than the U.S. version.      10
                                                                            9
                                       Economic recovery was faster         8
                                                                            7
                                       in Canada as well. The               6
                                       interest rate and unemploy-          5
                                                                            4
                                       ment rate charts show that           3
                                                                            2
                                       we are still slowly recovering             1970   1975    1980   1985   1990   1995   2000   2005   2010
                                       from this recession and are
                                       now most likely in the early
                                       days of a long period of                                 BANK RATES CANADA (AVG)
                                                                          20.0
                                       economic growth. This would
                                                                          17.5
                                       likely indicate upcoming
                                                                          15.0
                                       higher prices and steady to
                                                                          12.5
                                       higher volumes for real estate.
                                                                          10.0
                                       There is no evidence of an          7.5
                                       imminent recession or real          5.0
                                       estate bust. It is worth noting     2.5
                                       that every time the U.S. has         0
                                                                                  1970   1975    1980   1985   1990   1995   2000   2005   2010
                                       led Canada into a recession by
                                       a few months. We have never
                                       suffered a recession alone. So,   growth, high inflation, high           essence, and now it needs to
                                       if you believe that the U.S. is   interest rates, followed by low        build up speed and runaway
THE MYTH OF THE TORONTO CONDO BUBBLE

                                       imminently headed into a          unemployment – essentially, a          to clear the path for the next
                                       new terrible recession then,      runaway train that must be             recession. Based on past data,
                                       “batten down the hatches,”        derailed. This is clearly not          this will likely be at least 9
                                       otherwise Toronto real estate     the case in North America or           years from now and possibly
                                       prices are headed up.             Europe. The above economic             as far away as 20 years. With
                                                                         data indicates that a so-called        the current extremely slow
                                       Based on known economic           real estate bubble is not              recovery, coupled with very
                                       data, to see a significant drop   imminently going to burst. It          low interest rates, and high
                                       in real estate prices we need a   is more likely that the                government debt, it may take
                                       significant recession. The        damage done in 2008-2009 is            a very long time to rebuild
                                       recipe for an imminent            the extent of what will                the economy to “runaway
                                       recession is a combination of     happen this time around. The           train” status. Every recession
                                       the following; high economic      train was derailed in 2008 in          brings different real estate
2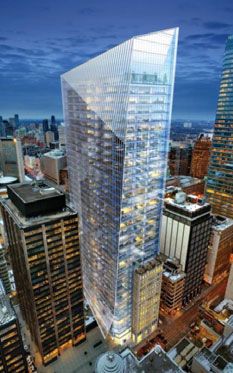
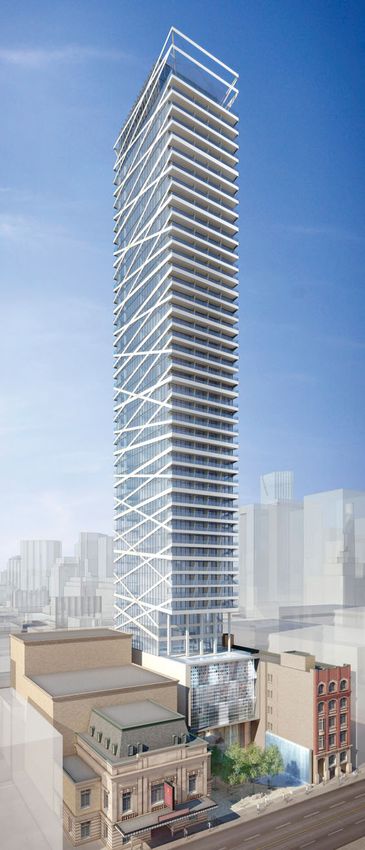
Theatre Park
                    King St. West Theatre Row
                                      Toronto

corrections. 1982 brought
minimal real estate value
changes to both the U.S. and
Canada, 1991 was devastating
for Canada (particularly in
Toronto), but mild for the U.S.
We know that the 2008
recession was a disaster for
the U.S., but relatively mild
for Canada and Toronto. I
would argue that because
1991 was so mild for the U.S.
real estate market it had more
steam to release in the 2008
recession as it ran for 25 years
with minimal disruption.
Canada and Toronto’s 1991
recession was so long and
deep that real estate didn’t
recover until 2002. Toronto
and Canada had less steam to
release in 2008. This could be
why our prices corrected
marginally. The likely
scenario for a real estate
bubble bursting will be
around the start of negative
growth, significantly higher
interest rates, rising inflation,
and significantly rising unem-
ployment. It will likely be
precipitated by explosive
growth of GDP, interest rates,
employment, and inflation.
Fear a real estate bubble when
Canada strings together a few
years of 4+% economic growth
in GDP.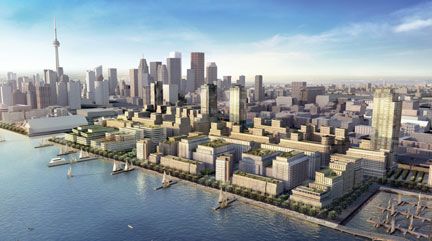
RESALE ANALYSIS
MLS SALES 2012 VS 2011 MLS SALES 2012 VS 2011
Recently, the Toronto MLS has 12000
been recording an approxi- 2012 2011
mate 10% drop in sales
10000
volumes and smaller increases
in average pricing. The condo-
minium MLS data shows a 8000
small decrease in values in
the 1-2% range.
6000
MLS RESALE TOTAL 4000
Overall, 2011 and 2012 will be
very similar in total sales. The 2000
main observation for 2012
ry
ary
rch
ril
y
e
y
st
er
er
r
er
be
Ma
Jul
Jun
Ap
gu
ua
mb
tob
mb
bru
Ma
vem
was a spring surge and an
Jan
Au
pte
ce
Oc
Fe
No
De
Se
autumn fall-off. Why did this
happen? The Federal
government changed the
CMHC high ratio amortization MLS RESALE TOTAL
rate from 30 to 25 years and 100000
raised the down payment
requirement for $1.0 million+
properties from 5% to 20%. 80000
This motivated first-time
THE MYTH OF THE TORONTO CONDO BUBBLE
buyers and $1.0M+ buyers to
60000
beat the legislative change
and buy in the spring. This
excess volume of spring
40000
buyers created a reduction in
autumn buyers. Based on the
MLS data above, 2012 will be
20000
the fourth best year in the
history of Toronto MLS, a
clear sign that prices are not 0
correcting into a bubble-style
19 6
19 7
19 8
19 9
70
19 1
19 2
19 3
19 4
19 5
19 6
19 7
19 8
19 9
19 0
19 1
19 2
19 3
19 4
19 5
19 6
19 7
19 8
19 9
90
19 1
19 2
19 3
19 4
19 5
19 6
19 7
19 8
20 9
20 0
20 1
20 2
20 3
20 4
20 5
06
20 7
20 8
20 9
20 0
20 1
12
6
6
6
6
7
7
7
7
7
7
7
7
7
8
8
8
8
8
8
8
8
8
8
9
9
9
9
9
9
9
9
9
0
0
0
0
0
0
0
0
0
1
1
19
19
19
20
of collapse.
4
RESALE ANALYSIS
DISTRICT C1 C2 C3 C8 C9 C10 C11 SALES DISTRICT C1-3, C8-11
(Eglinton to Waterfront, DVP to Dufferin) SALES
Condo Apartments and Condo Townhomes Sales This graph shows that central
8000
Toronto MLS condominium
7000
sales in 2012 will be the 5th
best ever and better than
6000 virtually every year in the
2000’s. This is not a sign of a
5000
bubble forming or bursting.
4000
3000 DAYS ON MARKET
What this chart shows is a
2000
slight slowdown in time to
1000 sell that took place primarily
in the summer of 2012.
0 Overall, it shows a healthy
2005 2006 2007 2008 2009 2010 2011 2012 resale market, with days on
market currently at 27 days.
DAYS ON MARKET Keep in mind that during the
(days)
50 bursting bubble of the 1991
recession, days on market
extended to over 6 months
(180 days) and in many cases
40 extended to over 1 year (365
THE MYTH OF THE TORONTO CONDO BUBBLE
days). The graph shows 2012
to be one of the healthiest
30 markets ever and in
comparison to the mild
slowdown we experienced
2012
2011
in 2008, significantly better
20 2010 when time to sell rose to
2009
47 days.
2008
2007
10 The roughly 10% reduction in
Toronto resale activity over
ry
ary
rch
ril
y
e
y
st
r
er
r
er
be
be
Ma
Jul
Jun
Ap
gu
ua
tob
mb
bru
Ma
m
vem
the last 6 months of 2012 is
Jan
Au
pte
ce
Oc
Fe
No
De
primarily due to the CMHC’s
Se
5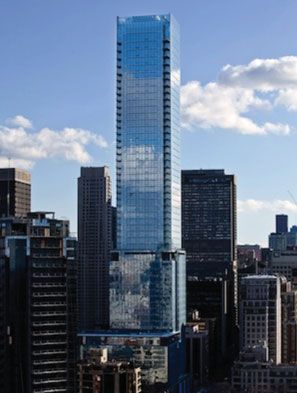
RESALE ANALYSIS
rule changes. It appears this SOUTH CENTRAL LISTING INVENTORY
10% consisted mainly of 1st Cental Districts: C01, C02, C03, C08, C09, C10 & C11.
time fringe buyers and $1.0 Eglinton Ave - Lake Ontario., Dufferin - DVP.
2500
million+ high ratio buyers. Condo For Sale Condo For Lease
They were essentially priced
out of the buying economy. It
2000
is likely that many of these
buyers leased a condominium
in the interim (note the 1500
increase in condo rental
volume through the summer
of 2012 as available investors 1000
plummeted). It is also very
likely that these buyers will
be back in 2013 with a 500
slightly higher income, and a
larger deposit. The good news
is that affordability changed 0
N
B
R
R
Y
N
L
G
P
NO T
DE V
C
N
B
R
R
Y
N
L
G
P
NO T
DE V
C
N
B
R
R
Y
N
L
G
P
NO T
DE V
C
MA
JU
OC
MA
JU
OC
MA
JU
OC
SE
SE
SE
little over the year. So while
MA
AP
MA
AP
MA
AP
FE
FE
FE
JA
JU
JA
JU
JA
JU
AU
AU
AU
the last half of 2012 reflected 2010 2011 2012
a slowdown, 2013 is likely to
see this 10% surge of buyers
re-enter the market. In the SOUTH CENTRAL LISTING inventory. What is most inter-
end, it is probable that INVENTORY esting about this chart is the
Flaherty’s move simply You can see in this chart that sheer lack of condominiums
THE MYTH OF THE TORONTO CONDO BUBBLE
removed a number of buyers when seller’s took their condo for rent in the central core.
for one year only to see them properties off the market, Generally, 480-950 condos are
buy the next year, causing a they put them up for lease. available at any time south of
short-term anomaly and a This is seen by the inverse Eglinton, with several
simple shift of buying volume relationship of dropping sale hundred thousand units built,
from one year to the next. inventory and rising rental the vacancy rate is below
0.5%. This bodes very well for
the condominium investor
who buy for the long term
“It is also very likely that these buyers will and lease their investment
be back in 2013 with a slightly higher properties.
income, and a larger deposit.”
6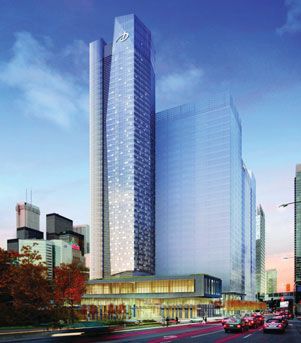
NEW CONDOMINIUM SALES
ANALYSIS

For a strange reason, many                                  majority of home buyers.”                                  second worst in 12 years
individuals in Toronto seem                                 (see chart below)                                          eclipsed only by 2008 during
to long for a biblical-style                                                                                           the great depression. What
condominium meltdown.                                       The reality of the housing                                 this graph shows is that
Condominiums are the                                        industry is clearly shown                                  approximately 40,000 homes
punching bag of housing and                                 here. Condominiums are now                                 sell each year, and going
of the economy; despite being                               60% of new sales because they                              forward over 20,000 of these
single-handedly responsible                                 are what people either want                                every year will likely be
for the resurgence of Toronto,                              or can afford. The number to                               condominiums. No one ever
and its main sponsor as a                                   focus on is total home sales.                              moans about the imminent
great world city. This odd                                  2012 will be the second worst                              collapse of the low rise single
viewpoint is probably mostly                                year in the last 12 years.                                 family home market, but that
due to the condominium’s                                    Condominiums will be the                                   is exactly what has happened.
awesome success as a housing                                biggest component of that,                                 We can see that through to
choice in Toronto. I cannot                                 and to date we have not seen                               2004, it represented over 70%
tell you how many times I                                   any perceived bubble                                       of the 40,000 new homes sold
have been asked, “Who is                                    bursting. 2012 will be the 4th                             every year and now it is less
going to live in all of these                               best year in the history of                                than 50%. So why then, when
condominiums?” The answer                                   Toronto for new condo sales.                               condos have just replaced low
to that question is, “the                                   Overall home sales will be the                             rise single family homes as
                                                                                                                       the major contributor to new
                                                                                                                       homes sales, do people worry
                                                                                                                       constantly about a crash? It is
                   GTA YEARLY NEW HOME SALES                                                                           because condos are visible,
                         with percentage of high-rise vs overall sales
                                                    High-Rise Sales                 Overall Sales
                                                                                                                       tall, disruptive, and change

                                                                                                                                                          THE MYTH OF THE TORONTO CONDO BUBBLE
                                                                                                                       the neighbourhood dramati-
50,000
                                                                                                                       cally. It has nothing to do
40,000
                                                                                                                       with their sustainability. It is
                                                                                                                       purely political.
30,000
                                                                                                 61.5%

20,000                                                           51.1%                   56.8%
                                                 41.7%   44.7%                                             53.8%
                         29.0%                                           53.7%   46.3%
10,000                           27.9%   28.6%
         25.5%   26.2%

    0
         2000 2001 2002 2003 2004 2005 2006 2007 2008 2009 2010 2011 2012
                                                                                                         (Estimated)

         CONDO SALES REPRESENT THE BIGGEST SHARE
                   OF NEW HOME SALES
                                                                                                                                                          7
RESIDENTIAL RENTAL
                                       ANALYSIS

                                       There is a misconception that                      TORONTO REAL ESTATE BOARD RENTALS
                                       too many condos are being         20000
                                                                                                                                          18,421
                                       built. While we can sell as
                                       many new condominiums as                                                                  16,396
                                       we like, the industry’s current                                                 14,854
                                       capacity to build cannot          15000

                                       exceed 13,000 completions                                              12,677
                                       per year. With housing
                                       demand at 20,000 units per                                    9,941
                                                                         10000
                                       year, the industry cannot keep                        8,458
                                                                                    8,035
                                       up with demand. Over the
                                       long term, this will have a
                                       serious impact on supply. The      5000
                                       new condo market must by
                                       necessity now fill two require-
                                       ments;
                                                                               0
                                        1. the majority of new rental
                                                                                    2006     2007    2008     2009     2010      2011     2012
                                           housing,                                                                                       (Est.)
                                        2. the majority of new
                                           residences for home
                                           buyers.                             VACANCY RATES OF APARTMENTS AND CONDOMINIUMS
                                                                                           IN THE CITY OF TORONTO
                                       There is a need in Toronto’s      4.0                                           Purpose-Built Apartments
                                       GTA for 10,000 new purpose
                                                                                                                       Rental Condominiums
                                       built rentals per year. This is   3.5
THE MYTH OF THE TORONTO CONDO BUBBLE

                                       just to satisfy the growth of
                                       new residents that need to        3.0

                                       rent every year. Private
                                                                         2.5
                                       industry is not building a
                                       meaningful amount of              2.0
                                       purpose-built apartment
                                       buildings and neither is the      1.5

                                       government. So who then is
                                                                         1.0
                                       building rental property in
                                       the city? Since 2007, the         0.5
                                       condominium market has
                                       added 27,000 units dedicated      0.0
                                       to the rental economy (as                   2006      2007      2008       2009          2010      2011
8
RESIDENTIAL RENTAL ANALYSIS
GTA POPULATION shown by the graph
8000000 TORONTO REAL ESTATE
BOARD RENTALS). This
7000000 represents 25% of all the
6,054,191 condominiums built since
6000000
5,555,912 2007. The only thing
5,081,826 separating Toronto from
5000000 4,628,883 astronomical increases in the
4,235,756
prices of rental accommoda-
4000000 3,733,085
tions is the condominium
3000000 market. It is however, not
anywhere close to enough.
2000000 With just 5000 new condo
units currently going into the
1000000 rental economy each year,
there is a shortfall of 5000
0
units. This has caused the
1986 1991 1996 2001 2006 2011
vacancy rate for purpose-built
apartments to drop from 3.5%
to 1.4% in a short period of
CANADA IMMIGRATION time. The vacancy rate for
300000 central condominiums is now
below 1%. There has been a
shortfall of new-built
250000
apartments for over 40 years
THE MYTH OF THE TORONTO CONDO BUBBLE
due to rent control legislation
200000 that was brought into the
province in the 1970’s. This is
not fixable in the near or
150000
medium term which is why
rental prices in the free
100000 market have risen 25-30% over
the last four years.
50000
The city grows by 100,000
people every year and Canada
0 adds 250,000 new residents
87
88
89
90
91
92
93
94
95
96
97
98
99
00
01
02
03
04
05
06
07
08
09
10
11
every year. It is likely that
19
19
19
19
19
19
19
19
19
19
19
19
19
20
20
20
20
20
20
20
20
20
20
20
20
9RESIDENTIAL RENTAL ANALYSIS
these numbers will only RENT INCREASE AT GLÄS
increase over time. 410 SQ.FT. JR. 1 BEDROOM
Condo rental prices have YEAR RENT
LIVING | DINING
dramatically increased over 2012 $1,400
the last four years. This 2011 $1,350
example on the right shows a
2010 $1,225
28% increase in rents over 48
months. This example is a 400 2009 $1,100
sq.ft. junior 1 bedroom at gläs
condominium, located at King
D/W
Street West and Spadina W
Avenue. D
This demand for rental
housing will continue to grow BEDROOM
as buyer affordability issues
accelerate. In essence, fewer
and fewer people will qualify
to buy a property in a city
that will continue to get more SOUTH CENTRAL LISTING INVENTORY
expensive. This will continue Cental Districts: C01, C02, C03, C08, C09, C10 & C11.
to be an enormous contribu- Eglinton Ave - Lake Ontario., Dufferin - DVP.
tor to new condo sales, as 2000
condominium investments
THE MYTH OF THE TORONTO CONDO BUBBLE
have proven to be a lucrative, Condo For Lease
easily managed, safe place to 1500
invest funds for the small,
inexperienced, local and inter-
national, investor. 1000
One can see the phenomenal
wealth-building that occurs 500
when buying Toronto condo-
miniums over the long term.
Currently, with massive 0
N
B
R
R
Y
N
L
G
P
NO T
DE V
C
N
B
R
R
Y
N
L
G
P
NO T
DE V
C
N
B
R
R
Y
N
L
G
P
NO T
V
negative media attention
MA
JU
OC
MA
JU
MA
OC
JU
OC
SE
SE
SE
MA
AP
MA
AP
MA
AP
FE
FE
FE
JA
JU
JA
JU
JA
JU
AU
AU
AU
overstating Toronto’s current 2010 2011 2012
10RESIDENTIAL RENTAL ANALYSIS
BUYING A CONDO AS AN INVESTMENT
All examples are based on current opportunities.
JUNIOR 1 BEDROOM
PURCHASE PRICE: $238,900
DEPOSIT (25%) $59,725, MORTGAGE OF $179,175 (MORTGAGE: 3.09%, 25 YEAR AMORTIZATION)
MONTHLY MORTGAGE AMOUNT: $856.23 (monthly payments)
CONDOMINIUM FEES: $202.00
MONTHLY TAXES: $180.00
*capital gains are calculated using an annual appreciation of 4% (Toronto has averaged 6% over the last 10 years)
*rental rates subject to 3% annual increase
YEAR YEAR 1 YEAR 5 YEAR 10
Condo Value: $248,456.00 $290,658.38 $340,029.19
Capital Gain: $9,556.00 $51,758.38 $114,730.36
Total Monthly Cost: $1,238.23 $1,238.23 $1,316.23
Monthly Rent: $1,395.00 $1,570.08 $1,820.16
Annual Rent Profit: $1,881.24 $3,982.20 $6,047.16
Annual Mortgage Principle Paid: $4,842.81 $5,474.46 $6,380.20
Annual Return from Rent: $6,724.05 $9,456.66 $12,427.36
Rent Profit Over Term: $1,881.24 $14,581.13 $38,637.74
Mort. Principle Paid Over Term: $4,842.81 $25,763.88 $55,292.54
Total Profit: $16,280.05 $92,103.39 $208,660.64
Annual rate of return from rent: 11.3% 15.8% 20.8%
ANNUAL RATE OF RETURN
FROM TOTAL PROFIT 27.3% 154.2% 349.4%
THE MYTH OF THE TORONTO CONDO BUBBLE
pause in price growth, and option, the opportunity to which bodes well for condo
unsolved European and U.S. earn vast financial rewards investors. The long term view
government debt issues, many still abound in the Toronto for returns on condo invest-
investors have taken a break. condo market. There is ments is extremely attractive
A break to where? They have however, recent evidence that based on this chart. With so
not taken their money investors are coming back as little inventory, rental prices
somewhere else, rather they seen by some very successful must rise, and they have. The
are sitting on cash, waiting new condo sales programs supply of rental condo-
for a sign to re-enter the late in 2012. The overall avail- minium product is totally
marketplace. As you can see ability of condo rentals in the inadequate. It averages
from the above investment central core is very tight, between 480-900 units.
11THE RESURGENCE OF THE
TORONTO OFFICE TOWER
There are at least 16 office “4.5 million square feet of office space has
towers under development
that will add approximately 4 been completed since 2009 and a second
million square feet over the boom of 4 million square feet will be
next 4 years. Due to the condo
boom, office vacancies are completed in 2014-2016.”
down as retail and office
businesses are looking to be
within reach of the new Recent large transactions in The allure of living downtown
downtown pool of young the central core show a and working downtown is
talent. This symbiotic rela- tremendous level of attractive to many young
tionship is giving long term confidence in the commercial professionals, giving them a
sustainability to new condo- real estate industry. Allied higher standard of living and
minium developments. Property and Riocan just quality of life with increased
bought the Globe and Mail levels of discretionary
Usually 3-4 years after a property for $136 million, and spending just by giving up a
recession, the vacancy rates are negotiating to buy the car. We have seen this time
for office space would be at its balance of that property at after time with the demand
peak, but the explosive the corner of Front and for condominium tower
demand for downtown space Spadina. This group also parking coverage decreasing
has made vacancy rates recently bought the Bianchi in some cases to less than
among the tightest in history. Collision property at King and 30%.
4.5 million square feet of Portland. Both will be large
office space has been scale office, retail and residen- Many billions of dollars from
completed since 2009 and a tial developments and the office sector of the devel-
THE MYTH OF THE TORONTO CONDO BUBBLE
second boom of 4 million combined will greatly exceed opment industry is stimulat-
square feet will be completed $1.0 billion in development. ing the GTA economy,
in 2014-2016. furthering a need for new
Some of the companies to housing. It is unlikely in this
The current vacancy rate in recently expand or relocate to environment of office space
the downtown core is 4.5% downtown Toronto are: SNC expansion that we will see a
compared to an average of Lavalin, PWC, Telus, Coke, protracted, deep reduction in
9.2% over the past 20 years. Google, Corus, Deloitte, RBC, residential prices. Historically
This is contributing to the Salesforce.com, and KPMG, speaking, it has never
boom of new office buildings showing confidence in the happened.
downtown. city’s core despite higher real
estate taxes.
12NEW OFFICE TOWERS
Southcore Financial Centre (18 York/Bremner Tower) RBC Waterpark Place III
Bay Adelaide Centre (West, East, North towers) RBC Centre (Wellington)
Telus Tower Maple Leaf Square 111 Richmond Street
21 Don Roadway (Lever Bros) 388 King Street West QRC West (134 Peter)
FCP rejuvenation 71-95 King Street East Oxford Place
RICHMOND ADELAIDE III RBC CENTRE MAPLE LEAF SQUARE TELUS TOWER
111 RICHMOND FIRST WATERFRONT PLACE
THE MYTH OF THE TORONTO CONDO BUBBLE
18 YORK ST
KING/PETER
– ALLIED PROPERTY
BAY ADELAIDE CENTRE 21 DON ROADWAY MANAGEMENT
13NEW HOTELS AND
PUBLIC BUILDINGS
The last eight years have been built; an incredible 147 in and future changes to
the biggest hotel boom in the Toronto, versus 72 in New Toronto, I have considered all
history of Toronto. With the York City, and 21 for of it and despite the biased,
Standard Group, Morgan’s Vancouver. This is nothing sensationalized, and ignorant
Group, W, Kimpton, less than the complete media coverage to the
Gansevoort, and several more redefining of Toronto. This is contrary, I am very optimistic
hotel companies chomping at similar to the great expansion about the next 10 years and
the bit to get access to of Chicago and New York City beyond for Toronto and the
Toronto. We can expect more in the 1860’s bringing them condo industry. I say, do not
world-class hotels and the into the state of world-class be misled by the naysayers
expected surge in work and cities. This is our time. The and Chicken Little’s. I believe
pleasure related visits to sheer volume and velocity of condominiums are the one
Toronto further stimulating money already invested in and only real future of resi-
our economy. Toronto makes a 1991-style dential development in
correction unlikely, we are a Toronto.
Toronto is now considered much larger and richer city
one of North America’s “fun and have the financial ability
spots” competing for weekend to weather slowdowns as we
visitors with Los Angeles, New did in 2008.
York, Las Vegas, and Miami. A
new world-class casino is now I have spent many hours
in the works. It is no longer a analyzing data and speaking
Canadian back water, rather a to many hundreds of
world class city on the world consumers. Along with
stage. conceptualizing the recent
THE MYTH OF THE TORONTO CONDO BUBBLE
We have also recently expand-
ed our universities, colleges,
and public buildings with new
or expanded facilities. “This is nothing less than the complete
This is not the doings of a redefining of Toronto. This is similar to the
poor city of have not’s. great expansion of Chicago and New York
Toronto ranks as the number
1 city in North America for City in the 1860’s bringing them into the
cities with skyscrapers being state of world-class cities.”
14NEW HOTELS
Four Seasons Trump Tower Shangri-La
The Ritz-Carlton The Hazelton Hotel Hilton
Thompson Hotel Marriott Delta
King Edward Le Germain
THOMPSON RITZ-CARLTON
DELTA
MARRIOTT THE HAZELTON LE GERMAIN
THE MYTH OF THE TORONTO CONDO BUBBLE
FOUR SEASONS TRUMP TOWER SHANGRI-LA
15NEW PUBLIC SPACE
Ripley’s Aquarium of Canada Royal Ontario Museum
Art Gallery of Ontario Gardiner Museum
Four Seasons Centre for the Performing Arts Ontario College of Art & Design
Ted Rogers School of Management George Brown College Waterfront Campus
Li Ka Shing Institute @ St. Michael’s Hospital The Royal Conservatory of Music
National Ballet School MaRS Centre Phase 2
Ryerson’s Mattamy Athletics Centre Nathan Phillips Square re-design
Union Station Revitalization June Callwood Park
Underpass Park St. Lawrence Market North
Puente de Luz Bridge CAMH Queen Street Redevelopment
Sony Centre for the Performing Arts (formerly Hummingbird Centre)
Daniels Spectrum (formerly Regent Park Arts and Cultural Centre)
Waterfront Toronto (Lower Donlands, East Bayfront, West Don Lands, Portlands, Centre Waterfront)
THE ROYAL CONSERVATORY
OF MUSIC
RIPLEY’S AQUARIUM SONY CENTRE
FOUR SEASONS CENTRE
THE MYTH OF THE TORONTO CONDO BUBBLE
ROYAL ONTARIO MUSEUM GEORGE BROWN WATERFRONT NATIONAL BALLET SCHOOL
WATERFRONT TORONTO (EAST BAYFRONT) ART GALLERY OF ONTARIO
16“I have spent many hours analyzing data
and speaking to many hundreds of
consumers. Along with conceptualizing the
recent and future changes to Toronto, I have
considered all of it and despite the biased,
sensationalized, and ignorant media
coverage to the contrary, I am very
optimistic about the next 10 years and
beyond for Toronto and the condo industry.”
— Brad J. Lambcreative: the walsh group 786 KING STREET WEST, TORONTO, ON M5V 1N6 T. 416.368.5262 WWW.TORONTOCONDOS.COM
You can also read