The North American Monsoon
←
→
Page content transcription
If your browser does not render page correctly, please read the page content below
The North
    American
     Monsoon

1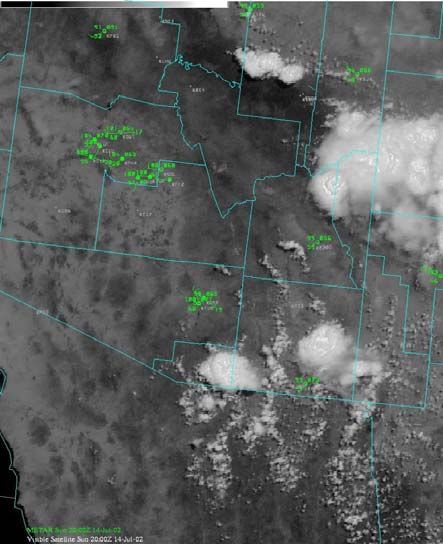
What is a Monsoon?
        Even in the tropics, where the weather is warm year round, the march of the
seasons has a profound influence on the rhythm of life. Rainy seasons, usually referred
to as monsoons, alternate with dry seasons and each has its own distinct pattern of
prevailing winds.
        The term “monsoon” is derived from the Arabic word “mausim” which means
season. Ancient traders sailing the Indian Ocean and Arabian Sea used it to describe a
system of alternating winds that blow persistently from the northeast during the winter
and from the opposite direction, the southwest, during the summer.
        It is now well understood that seasonal reversals of wind direction occur because
of temperature differences between the land and sea across all of the Tropics. There are
many features in common to these summer monsoon circulations, but the most
recognizable are the seasonal changes in rainfall patterns, both increases and decreases.

Why Predict a Monsoon?
        Billions of people in the tropics and subtropics rely on the summer sun to draw
rain clouds off the oceans and onto the continents. For centuries, people have sown and
harvested crops, bred livestock, and planned outdoor activities such as construction
projects or hunting expeditions according to a relatively well-defined set of calendar
dates based on the arrival and departure of the monsoon rains.
        In many countries the arrival of the summer monsoon rainfall is good news since
it replenishes the waterways and provides a critical supply of water for agriculture and
other economic concerns. However, occasionally the rains are excessive and can cause
serious and life-threatening floods. At other times a weak monsoon can cause a drought
to develop, leaving fields and waterways parched and dry. Since extreme weather
conditions associated with monsoons, like floods and drought, occasionally wreak havoc
on a region's economy and people, monsoons throughout the world need to be accurately
understood and predicted by weather and climate models, so that scientists can anticipate
upswings and downswings in the monsoon and help societies plan accordingly.

       Sidebar: A great scientific detective story: what causes monsoon failures and
       droughts??
               Monsoon rains are very important to agricultural cultures and economies,
       and understanding why they occur or fail has prompted scientific observations
       and research for centuries. In particular, the Asian monsoon, which affects the
       Indian subcontinent and southeast Asia, inspired research leading to
       understanding some major features of the world’s atmosphere. In 1876-1879,
       when the monsoon rains failed, droughts and widespread famine occurred across
       the tropics, including India, once a colony of Great Britain. In response, the
       Indian Meteorological Service was created, and collected meteorological data
       from all over the world. India already had some of the oldest meteorological
       observatories in existence, established in the late 1700s by the British East India
       Company. They made correlations of that data with monsoon rainfall to explore

                                            2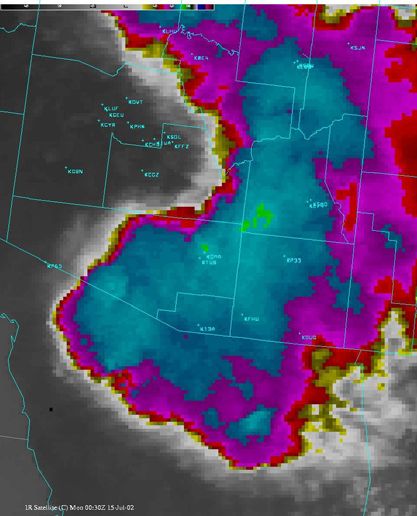
whether it was part of a global phenomenon. Because of the importance of
       predicting monsoon rainfall for the economies of India and Britain, the IMS
       issued long range forecasts of the monsoon, but these were not very accurate.

               After another period of failed monsoons and a huge famine in 1896-1902,
       the British mathematician Sir Gilbert Walker (Fig. 1) was asked to go to India to
       figure out how to predict the vagaries of the Asian monsoon. He studied weather
       records from across the globe and found that climate variations in many areas,
       including the Indian monsoon, were correlated with pressure readings at stations
       on the eastern and western sides of the Pacific (specifically, Tahiti and Darwin,
       Australia). He noticed that when pressure rises in the east, it usually falls in the
       west, and vice versa. He used the term “Southern Oscillation” to describe this
       east-west seesaw effect. He also found that Asian monsoon seasons were often
       linked to drought in Australia, Indonesia, India, and parts of Africa, and mild
       winters in western Canada.

                Later, a Norwegian meteorologist named Jacob Bjerknes put the whole
       detective story together. He deduced that Walker’s Southern Oscillation and the
       El Niño phenomenon off Peru were part of the same phenomenon. We now know
       this as the El Niño- Southern Oscillation, or ENSO, and scientists continue to
       research the affects of this global phenomenon on more regional weather patterns
       – such as the Asian monsoon.

Is there a North American Monsoon?

        The circulation and rainfall patterns over the tropical and subtropical Americas
and the adjacent oceans are dominated by seasonal monsoonal circulations. However,
seasonal reversals of the wind are less pronounced over the Americas than in other parts
of the world like Australia, India and Southeast Asia. The North American monsoonal
circulation is characterized by distinct rainfall maxima over western Mexico and the
Southwestern United States (Fig. 2) and by an accompanying upper-level anticyclone
(indicated by “A”) over the higher terrain of northwestern Mexico. Heating over the
mountains of Mexico and the western United States plays a major role in the
development and evolution of the monsoon, in a manner similar to what is observed over
the Tibetan Plateau and the Bolivian Altiplano. Rivers of air in the lower-troposphere,
referred to as low-level jets, from the Gulf of Mexico and the Gulf of California bring
moisture to the continent and play an important role in the daily cycle of precipitation
(Fig. 3).

        The North American Monsoon System is perhaps the least-understood of all of
large-scale circulations patterns that affect the United States. What’s more, the regions
that are most affected by the monsoon are among the most rapidly growing parts of both
the United States and Mexico. The thunderstorms that are generated by the monsoon
system can bring life-giving and beneficial rains, but can also be life-taking as they

                                             3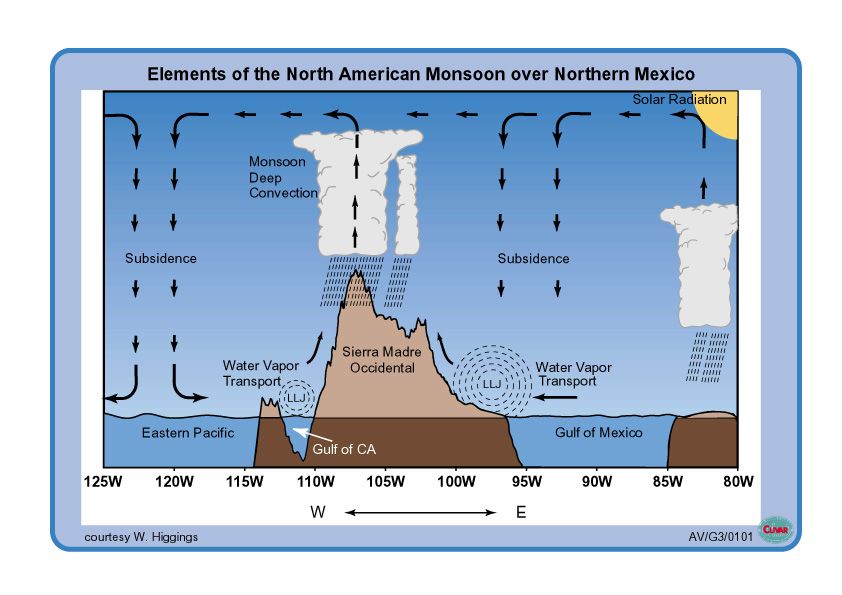
unleash violent flash floods, thousands of lightning strikes, crop-damaging hail, and walls
of damaging winds and blowing dust.

A Case Study
         The day is August 5, 2002. Tropical moisture associated with the North
American Monsoon is in place over Arizona and New Mexico and extends south to the
tropical waters of the Pacific Ocean west of Mexico. For most people this is a welcome
time of year, as the region receives about half its annual rainfall during the monsoon
season (July-September), and the rains help to occasionally cool the deserts which
routinely bake in temperatures over 100° F. Today, though, the more serious and
dangerous side of the monsoon is unfolding. Both NOAA’s National Weather Service
(NWS) and the Servicio Meteorológico Nacional (SMN) of Mexico are tracking a pocket
of relatively cold air at 20000-30000 ft above sea level as it heads west from the Gulf of
Mexico toward the monsoon moisture plume. The disturbance, known as an inverted
trough, is easily identified by satellite data collected from GOES-10 and 12, both
operated by NOAA’s National Environmental Satellite Data and Information Service
(NESDIS). Since this disturbance will move into the monsoon region during the most
active time of day – the sun-baked afternoon hours, a severe thunderstorm and flash flood
outbreak for southern Arizona and Sonora is likely.
         A series of plans and procedures goes into motion. The NCEP Storm Prediction
Center issues an updated forecast to alert the southwest U.S. of the increasing threat for
damaging winds and large hail. Meanwhile, the NCEP Hydrometeorological Prediction
Center issues an outlook for possible flash flooding across southern Arizona. In addition,
the Mexican weather service issues bulletins with similar information for Northwest
Mexico.
         As the thunderstorms erupt over the mountains to the East, forecasts for the
general public, emergency management officials, and aviation are updated to account for
the growing threat. By 3:30 pm, the developing storms take an ominous turn by moving
west off the mountains and forming into organized clusters and lines. The downbursts
become stronger and rush away from their parent storms, only to trigger more numerous
and even stronger storms in the hot deserts. As the storms descend on the Tucson area,
wind gusts exceeding 70 mph and torrential rains falling at the rate of 2 inches per hour
are recorded. Severe thunderstorm and flash flood warnings are issued, sending local
flood control, law enforcement and transportation officials into action so that they can
close roads that cross washes and other low lying areas. Volunteer severe weather
spotters in the Tucson area begin to report a large “shelf cloud” moving across the city
indicating a danger from damaging winds. As the area of high winds grows, a large dust
storm forms just northwest of the city and spreads north and west toward Phoenix and the
tribal lands west of Tucson. Additional warnings are issued downstream to alert more
Arizonans to the threat of damaging winds, flash flooding, and blinding blowing dust.
         To track these monsoon-generated storms, it takes a closely-knit and synergistic
operation of computers, satellites, communication systems, meteorologists, hydrologists,
technicians and volunteers to provide the Public with as much warning as possible. With
the advent of improved understanding of the monsoon, perhaps in the next few years the

                                            4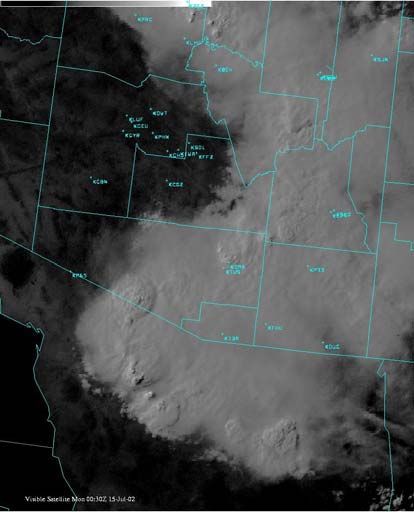
forecasts of these ferocious storms may come days in advance rather than hours or
minutes.
A Typical Monsoon Day
This is what an “active” day looks like during the monsoon in southeast Arizona.
At around 1:00 pm, thunderstorms are building in the mountains northeast, east and
southeast of Tucson (located near the KTUS airport and KDMA airforce base identifiers)
(Fig. 4).
By 5:30 pm, though, the storms have consolidated into a large mass and moved
into the deserts, with the strongest storms punching all the way into the stratosphere
(“bumpy” cloud tops on the visible satellite image (Fig. 5, left), and “green” spots on the
infrared satellite image (Fig. 5, right)).
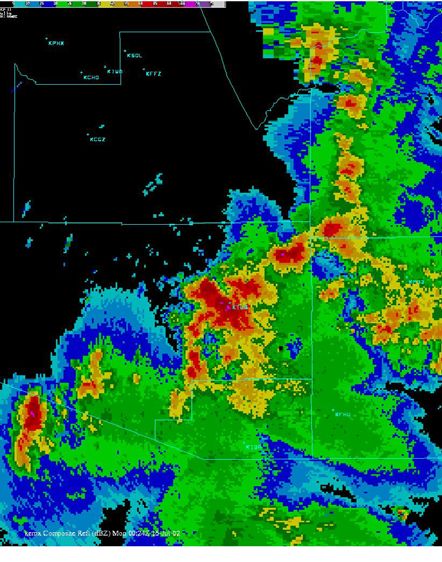
Underneath, a line of severe thunderstorms is detected by radar (Fig. 6) with
trained spotters and automated observing systems reporting 60-80 mph winds in the
Tucson metro area, with a large dust storm forming underneath the clouds.
The Seasonal March
The march of the seasons ensures that the North American monsoon will arrive
each year. During May and June heavy rainfall begins over southern Mexico and
quickly spreads northward along the western slopes of the Sierra Madre Occidental.
Typical onset dates of the monsoon range from early June in Southwest Mexico to early
July in Arizona and New Mexico (Fig. 7). At any particular location the beginning of the
monsoon is usually sudden, with the weather changing abruptly from relatively hot, dry
conditions to relatively cool, rainy ones. Although the onset of the monsoon proceeds
rapidly from south to north, the intensity of the monsoon rainfall decreases towards the
north (Fig. 8).
As the monsoon spreads northward the daily cycle of precipitation grows more
intense and strongly depends on elevation. The heaviest rains generally occur over the
highest elevations during the afternoon and early evening, and at lower elevations later at
night. Circulations linking coastal regions to the sea and mountains to nearby valleys
become more prominent in the Gulf of California region, and are influenced by surges of
moisture from tropical disturbances, such as tropical cyclones, further to the south.
The North American monsoon reaches maturity in July and August. The northern
edge of the monsoon extends into Arizona and New Mexico and coincides with the
development of a “monsoon high” at the jet stream level (roughly 10 km). The reversal
of the surface winds over the northern Gulf of California from northwesterly to
southeasterly is accompanied by an abrupt increase in moisture. The magnitude,
abruptness, and year-to-year regularity of this shift in rainfall are quite remarkable, given
the small changes in solar heating from June to July.
During the mature phase of the monsoon season the heaviest precipitation remains
west of the Sierra Madre Occidental in Mexico and near the southern end of the Gulf of
Mexico (Fig. 9, top). Mean monthly rainfall totals can exceed 30 cm (12 in) along much
of the western slopes of the Sierra Madre Occidental, causing the vegetation to evolve
from near desert conditions to those typical of a tropical rain forest within several weeks.
Surges of tropical moisture move northward along the Gulf of California and are linked
5to active and break periods of the monsoon rains over Arizona, southeastern California
and southern Nevada. On average portions of western Mexico receive in excess of 70%
of their annual precipitation during this period (Fig. 9, bottom). Tropical disturbances in
the form of tropical depressions, tropical storms, and even hurricanes account for
between 20 and 60% of the rainfall along the Pacific coast of Mexico, and can contribute
as much as 25-30% to the seasonal rainfall in the western interior locations. In terms of
fraction of total annual precipitation, New Mexico is the U.S. state most affected by the
monsoon (Fig. 9, bottom).
The monsoon system decays in September and October, but generally at a slower
pace than during development. The monsoon high over the western U.S. weakens, as the
monsoon precipitation retreats southward into the deep tropics. However, as cold fronts
associated with the polar jet stream begin to push into Arizona, the lingering moisture can
trigger severe thunderstorm episodes in Arizona and northern Sonora which resemble
severe weather events commonly seen in the eastern United States. In addition, this time
of year is the peak of tropical storm season in the eastern Pacific. Decaying tropical
systems can become caught in the weakening monsoon flow and lifted into the deserts.
The result can be catastrophic floods, as was seen several times in the 1970s and 1980s.
The seasonal march also contains some surprises. A double peak structure (wet-
dry-wet) in the seasonal march of precipitation is found along the west coasts of Mexico
and Central America (Fig. 10) equatorward of the Tropic of Cancer. The dry period is
called the mid-summer drought. The duration of the midsummer-drought varies from
year-to-year, and thus has a major influence on agricultural and other economic concerns
in the region.
Flavors of the Monsoon
The North American monsoon is affected on seasonal and longer timescales by
complex interactions between the Pacific and Atlantic oceans, the North American
landmass, and the atmosphere. The relative influences of each of these climate players
determines the flavor of the monsoon in any particular year.
The links between winter variations in tropical sea surface temperature patterns
and winter climate variations over North America are pronounced. The El Niño /
Southern Oscillation (ENSO) phenomenon exerts a strong influence on U.S. precipitation
and surface temperature, especially for the major events. Many El Nino events feature
wetter-than-normal conditions in southwestern North America and drier-than-normal
conditions in the Pacific Northwest during the winter. The record El Niño event of 1997-
1998 brought extreme rainfall and flooding to California in February 1998. In contrast,
the links between summer variations in tropical sea surface temperature patterns and
summer climate variations over North America are not as pronounced. The
extraordinarily wet and humid summer of 1983 may have been an aftermath of the major
1982-1983 El Niño. During the summer of 1983 an unusually high number of Pacific
hurricanes tracked northward into the Gulf of California contributing to the rainfall totals.
Relationships between ENSO and summer rainfall in the central U.S. may be related, at
least in part, to the effects of decadal variability in sea surface temperatures and surface
pressure in the North Pacific.
6There is some evidence that local ocean temperatures, unrelated to ENSO, may
help to determine the regional timing, intensity and extent of the monsoon precipitation.
Roughly 80% of the rainfall in Arizona and New Mexico occurs after water temperatures
in the northern Gulf of California exceed 28.5°C. The wettest years in Arizona are
associated with significantly higher temperatures ( >29°C) while the driest years are
associated with lower temperatures.
The land surface has its strongest influence during the warm season when the
continents are warm and evaporation is large. The land surface consists of the soil,
vegetation, surface water, snow and ice, and each of these provides a source of “memory”
that may influence variations in the monsoon. Modeling studies show that the location of
the monsoon anticyclone is very sensitive to soil moisture, so accurate estimates are
needed. In particular, when climatological soil moisture is used in the models, the
simulated monsoon anticyclone tends to be located too far to the east (over northeastern
Mexico or even the western Gulf of Mexico). When observed (i.e. current) soil moisture
is used, the simulated monsoon anticyclone is located in a position that is much closer to
that found in nature.
Observational evidence indicates that heavy (light) springtime snowpack in the
west-central U.S. leads to light (heavy) summer rains over portions of the Southwest, in a
manner analogous to what occurs in the Asian monsoon system. Vegetation affects the
amount of moisture leaving the soil as well as the amount of solar radiation reaching the
surface, thus altering the surface temperature. Seasonal green-up along the Sierra Madre
Occidental, with increases in leaf and vegetation cover, is rapidly initiated by the onset of
the monsoon rainfall. This can have a noticeable impact on surface temperature and
humidity. In addition, people alter the landscape through agriculture and land use
practices. Thus the land surface component of the monsoon system involves not only
geophysics, but also biology, chemistry, and sociology.
The North American monsoon system draws moisture from both the Pacific and
the Gulf of Mexico. The time of onset and intensity of the monsoon may influence major
drought and flood episodes, not only in southwestern North America, but also in the U.S.
Great Plains. The climatological onset of summer rains over northern Mexico and
Arizona around July 1 coincides with a decrease of rainfall over the Great Plains and an
increase on the east coast (Fig. 11). The Midwestern floods in July 1993 coincided with a
delayed onset and weak monsoon in the Southwest U.S. In contrast, the Great Plains
drought in the spring and summer 1988 coincided with an early monsoon that was also
very intense. The unusual persistence of these large-scale, long lasting variations in the
monsoon precipitation patterns suggests that they are strongly influenced by the oceans
and the land surface.
Scientists are trying to unravel what determines the flavor of the monsoon. Many
questions remain. How do interactions between the Pacific and Atlantic Oceans and the
North American landmass influence the monsoon precipitation and temperature patterns?
How does soil moisture, snow cover, and vegetation influence the exchange of moisture
and energy between the land and atmosphere during the monsoon season? Where does
the moisture for monsoon precipitation come from? Representing these oceanic, land
surface and atmospheric “memory” processes in computer climate models is a major
challenge. Continued efforts to build an improved climate observing system over the
7land and adjacent oceans will be essential to increase our ability to predict the behavior of
the monsoon.
Variations within the Monsoon Season
The North American monsoon is strongly influenced by the occurrence of
significant weather events such as hurricanes, floods and droughts over the course of a
season. Rainfall variations within the monsoon season are organized on the smaller
scales of local weather phenomena such as severe storms and sea breeze circulations as
well as on the larger scales of intraseasonal (i.e. within the season) phenomena.
Intraseasonal phenomena are clearly evident in the tropical planetary-scale sea-
level pressure, wind and precipitation fields. Over the Pacific Ocean, the most prominent
intraseasonal fluctuations are associated with the 30-60 day “Madden-Julian Oscillation”
(MJO), a disturbance that modulates the tropical patterns of precipitation and
atmospheric circulation. Though the MJO has a pronounced effect on the wintertime jet
stream, atmospheric circulation features and patterns of storminess over North America,
it also can have a significant impact on regions that experience rainy seasons during the
summer.
The MJO is characterized by an eastward progression of large regions of
enhanced and suppressed tropical rainfall, usually first evident over the western Indian
Ocean, and propagating over the very warm waters of the western and central tropical
Pacific. Quite often the MJO traverses the global tropics, and consequently affects the
NAM. In particular, MJO-related impacts on the NAM are manifested as periods of
enhanced and suppressed precipitation over the monsoon region that occur as the MJO
progresses across the region. A complete cycle from enhanced precipitation to
suppressed precipitation takes place over 30-60 days, on average, when the MJO is
active. Thus, it is important to improve our ability to forecast the MJO, hence our ability
to forecast monsoon precipitation up to a few weeks in advance.
There is also a very strong relationship between the MJO and tropical cyclones.
Tropical storms and hurricanes occur typically from May through November in both the
Pacific and Atlantic basins, and there are periods of enhanced and suppressed activity
within the season. The MJO modulates this activity by providing a large-scale
environment that is either favorable or unfavorable for development (Fig. 12). The
strongest tropical cyclones tend to develop where the MJO favors enhanced precipitation
and vice-versa. As the MJO shifts eastward, the favored region for tropical cyclone
activity shifts eastward from the western Pacific, to the eastern Pacific and finally to the
Atlantic basin. While this relationship appears robust, the MJO is one of many factors
that contribute to the development of tropical cyclones. Additional studies of the
relationships between the MJO and the frequency and intensity of various kinds of
significant weather events (e.g. floods, droughts, heat waves) are needed to obtain
detailed information on the climatic signature of the MJO.
During the North American summer monsoon there are northward surges of
relatively cool, moist maritime air from the eastern tropical Pacific into the southwestern
United States via the Gulf of California. These events, referred to as “gulf surges” or
"moisture surges" in the literature, are related to the amount of convective activity in
8northwestern Mexico and portions of the southwestern United States, including Arizona
and New Mexico. Common characteristics of surges at any particular location include
changes in surface weather (e.g. a rise in dewpoint temperature, warmer nighttime
temperatures, cooler daytime temperatures, a windshift to the south or southeast, and
increased cloudiness and precipitation). Recent studies have shown that surges of moist
maritime tropical air in the Gulf of California region also undergo variations within the
season, motivating studies of relationships to the MJO. Some surges are associated with
prolonged periods of wetter-than-normal conditions over the southwestern U.S. while
others are associated with drier-than-normal conditions. This is determined by the relative
location of the upper-level monsoon anticyclone in midlatitudes at the time of the surge
(Fig. 13). When the anticyclone is located to the east of the region, wetter-than-normal
conditions occur in the Southwest. Conversely, when the anticyclone is to the west of the
region, drier-than-normal conditions occur.
Learning from the Past
In contrast to the march of the seasons, which is regular, no two monsoon seasons
are exactly alike. For example, the relatively wet and early 1988 monsoon season in the
Southwest U.S. caught scientists by surprise because it coincided with a period of relative
drought conditions in the Great Plains of the U.S. To further confuse scientists, the
relatively dry and late 1993 monsoon season followed a period of unusual flooding
episodes in the central Great Plains and Midwest. Today we know that these
relationships are controlled, in part, by the large-scale circulation features such as the
monsoon anticyclone, but the factors that determine why some extreme events in the
Great Plains precede those during the monsoon and vice-versa remains a mystery.
In order to sort out these relationships, and guard against the possibility of being
surprised, scientists continue to document as many past monsoon seasons as possible by
piecing together bits of historical evidence from many different sources, including:
• Daily observations of atmospheric pressure, rainfall, surface temperature and
wind speed and direction. Many stations in southwestern North America have
records extending back 50 years, and some more than 100 years.
• Sea-surface temperature records. Many millions of reports from merchant ships
crossing the equator, in the eastern tropical Pacific, to the Southwest of Mexico,
and in the Gulf of California have helped us to piece together relationships
between water temperature and the North American monsoon rainfall.
• Proxy records. Scientists are reconstructing the decadal-to-century variability of
the North American monsoon using proxy records from tree rings and oceanic
sediments. The rationale for this lies in the relationship between the Pacific
Ocean currents (which are related to sedimentation) and the climate regime of
Western North America, which in turn is reflected by annual tree growth at
climatically sensitive sites.
9How does the North American Monsoon Affect Society?
The North American monsoon sweeps across a large region that includes large
urban complexes and vast areas of arid to semi-arid open space. The region includes the
binational border region, with a current population of about 12 million people, including
a number of distinct political, cultural, economic and institutional contexts. The
monsoon also encounters a relatively continuous physical landscape, in terms of biology
and climate, including a number of protected wildlife refuges, biosphere reserves, and
national parks. The monsoon provides flows to several large, managed river systems,
such as the Rio Grande/Rio Bravo which forms the border between the U.S. and Mexico.
Thus, variations in the monsoon directly affect the availability of water for agriculture in
this large and important agricultural region of Mexico.
Sidebar: Five areas that are particularly sensitive to the monsoon:
* Wildland and Prescribed Fire: affects the start and end of the fire season
* Ecosystem Management: affects flora and fauna dependent on water, and the
ability to manage and maintain natural ecosystems under stress from human
activities;
* Dryland/Rainfed Systems: affects the conditions faced by ranchers and farmers
* Integrated Water Management: affects the supply to many rivers which are
mainly fed by summer rains, and affects the demand for water
* Human Health: the incidence of many diseases is related to monsoon variability,
including valley fever, hantavirus, etc.
Monsoon Prediction
In the preceding pages we have considered how the North American monsoon
develops, how it influences weather patterns over much of the continent, how it affects
agriculture and waterways in southwestern North America, and how an abnormal
monsoon affects human beings. Scientists are now taking our understanding of the
monsoons a step further by incorporating the descriptions of these events into computer
models (i.e. computer programs designed to represent, in terms of equations, processes
that occur in nature). Such models are fed information, mostly in the form of sets of
numbers describing the present state of the coupled atmosphere-ocean-land system (for
example, observations of wind speed, ocean currents, sea-surface temperatures). Updated
numbers which the models produce, indicate how the monsoon might evolve over the
next few hours, days or months. Scientists routinely test these models, for example to
make sure that they are able to capture the conditions observed during previous
monsoons.
Monsoon prediction spans time scales ranging from a few hours to seasons.
Producing skillful forecasts at all of these time scales requires thorough understanding of
the subtle interplay of all of the features of the monsoon system. For example, it is
important to recognize that changes in the monsoon circulation two weeks ago can affect
what kind of thunderstorm activity will occur today.
Thanks to advances in our understanding of weather systems and in the numerical
models used to represent them, todays short range forecasts are relatively good. These
forecasts are routinely used by weather forecasters to provide the Public with up-to-the-
minute information on specific regional impacts of the monsoon. This requires
10continuous monitoring of the large-scale monsoon circulation and moisture plume, as
well as the disturbances embedded within the monsoon that evolve across the eastern
North Pacific, Gulf of Mexico, Caribbean and United States. Thunderstorms that develop
within the monsoon circulation can also impact the large-scale flow pattern by sending
additional moisture to the north and west, perhaps into areas far away from the core
monsoon region. On occasion, tropical storms and hurricanes are caught up in the
monsoon circulation, bringing tremendous rains to normally dry areas. Understanding
these interactions is critical to improving advanced warning of thunderstorm-related
hazards.
Better understanding of the sources of variability in the North American monsoon
gained through focused research over the past two decades has led to the development of
routine seasonal climate forecasts. Though useful, the skill of these forecasts is rather
limited when compared to weather forecasts, especially for precipitation during the warm
season. Future research to improve the skill of these forecasts is required. This will
include empirical and modeling studies, as well as the development and analysis of
historical datasets that contribute to a better understanding and more realistic simulation
of the phenomena that control the annual march of the seasonal rainfall patterns over
North America. Major improvements to the climate observing system in the oceans and
seas adjacent to the Americas, and over North America itself are needed to improve the
quality and coverage of atmospheric climate observations. Field programs will improve
the understanding of key climate processes operating within the North American
monsoon that are presently hindering advances in climate prediction over North America.
How Predictions are Used
Because the availability of water is such a critical issue in southwestern North
America, and because the monsoon has both beneficial and dangerous aspects,
information provided by NOAA’s National Weather Service is used by a variety of
customers and partners to make informed decisions about water and wildfire
management, public safety, and disaster response.
Timing the arrival of the monsoon and assessing its potential intensity is of great
interest to the general public, who in many cases welcome the rainfall and cooler
temperatures it brings in an otherwise blistering time of year. Wildfire managers in the
Desert Southwest need to know when increased humidity and rainfall will arrive in order
to redeploy firefighters and air tankers to other dry parts of the Western United States.
This information is critical, because a late or weak monsoon can actually make matters
worse as the building thunderstorms produce plenty of lightning and high winds, but
relatively little rain. These dry lightning storms can start dozens of fires at once and
stretch fire fighting resources to their limit.
As monsoon related thunderstorms roll across a region, local officials must cope
with their associated and sometimes dangerous consequences. Electric utilities must
ready themselves to respond to downed power lines and snapped power poles. County
flood control districts and Departments of Transportation begin to monitor stream gauges
and 911 reports, and if flooding develops, respond by barricading roads. Fire and rescue
crews deploy in order to conduct swift water rescues and respond to inevitable lightning-
caused fires. In particularly severe storms, county emergency management officials and
11the Red Cross are dispatched to flood- and wind-stricken areas in order to provide
immediate aid.
Monsoon Safety
Our ability to forecast the monsoon in the short term is critical to public safety in
the desert Southwest. Thus, anyone who lives in the monsoon region also needs to know
how to keep safe. Flash floods are the number two weather-related killer in the United
States (behind excessive heat), and the Southwest is certainly not an exception to this
deadly trend. Compared to other parts of the nation, though, floods in the desert
Southwest occur with great speed and severity. Monsoon-generated rains regularly
exceed rates of one inch per hour. These rains fall on the surrounding mountain ranges
first, beginning the rapid runoff process. The thunderstorms then drift into desert valleys
where soils are only an inch or two deep with either solid rock or a layer of impermeable
limestone underneath. This causes even more runoff and very rapid flooding of normally
dry washes, ephemeral streams, and other low lying areas. It is not uncommon for some
washes in Arizona to rise as much as 4 feet in a matter of minutes, catching motorists and
those on foot unprepared. In addition, people who are called upon to rescue these
individuals also put their own lives at great risk. These flash floods can be made even
worse where forest fires from previous years have denuded the mountain slopes and
cause walls of both water and mud to rush downstream.
There are a few simple rules that can be followed to protect life and reduce
property damage when flooding occurs, whether it is in the monsoon region or anywhere
in North America. First, monitor weather conditions through the NOAA Weather Radio
or another news source. Second, when flooding is expected or occurring get to higher
ground. And third, avoid areas already flooded, especially if the water is flowing fast.
Do not attempt to cross flowing streams – Turn Around Don’t DrownTM.
Flash floods are not the only monsoon-related weather danger. During the
months of July and August, the North American Monsoon region becomes the most-
active area for lightning in the Western Hemisphere. In thunderstorm outbreaks over
southern Arizona, tens of thousands of cloud-to-ground lightning strikes have been
recorded in a single evening, causing fires, power disruptions, life-threatening injuries,
and death. Anytime thunderstorms are around precautions must be taken in order to
avoid injury, death and property damage. For your safety, an easy rule to remember
when thunderstorms are in the vicinity is the 30/30 rule. It states that when one sees
lightning and can not count to thirty seconds before thunder is heard, quickly seek shelter.
Then, remain inside for at least 30 minutes after hearing the last clap of thunder. The
best shelter is a house or substantial building. If you cannot reach a building, then a
metal-topped vehicle is the next best choice as long as the windows are closed and you
are not in contact with the metal frame of the car. Avoid trees and open fields for these
are the most common locations for one to be struck by lightning.
Because thunderstorms in the North American Monsoon System develop in an
environment that is hot and relatively dry, downburst winds tend to be stronger and cover
larger areas compared to other parts of the United States. It is not uncommon for these
downburst winds to exceed 80 mph over a large area. These walls of wind then generate
huge clouds of blowing dust that can extend thousands of feet into the air and lowering
visibility to just a few feet. These dust storms are a tremendous hazard to motorists and
12aviation. Another hazard strong winds bring is downed power lines. Even though power
lines are on the ground and appear harmless they must be treated as energized. Do not
come in contact with the wires or surrounding area. Contact the proper authorities and
keep others away from the danger. If a power line happens to come in contact with a
vehicle, have the occupants remain inside until help arrives. Attempting to exit the
vehicle will create a pathway for electricity to reach the ground causing severe bodily
harm and possibly death.
Finally, even though tornadoes are not nearly as common as they are in other
parts of the United States, an average of four tornadoes touch down in Arizona each year.
These are most likely to occur in September when the jet stream begins to shift south and
interacts with lingering monsoon moisture.
Looking Ahead
Scientists are focused on improving our understanding of the processes that
control the distribution of monsoon rainfall over the North American monsoon region in
order to apply that knowledge to improve computer models used for weather and climate
prediction. More accurate and detailed information concerning the statistical
probabilities of rainfall scenarios are required for planning such activities as agriculture
and providing water resources. This research is strongly linked to that attempting to
assess the effects of anthropogenic climate change. The North American monsoon is
strongly tied to natural climate variations, such as those associated with ENSO and the
MJO. Understanding and including the effects of significant natural climate variations in
models is an important prerequisite to addressing anthropogenic changes.
NOAA’s National Weather Service’s primary mission is to protect lives and
property. Better tracking and forecasting of monsoon-related thunderstorm activity will
obviously aid the NWS in its core mission, particularly in the southwest U.S. This is
where the research community can help, particularly if the research is conducted with
extensive international partnerships. As we gain a better understanding of how the
monsoon affects the daily weather patterns, both in the lower and upper levels of the
atmosphere, our skill in forecasting anything from beneficial rains to dangerous severe
thunderstorms and flash floods will increase.
13Fig. 1. Sir Gilbert Walker
14Figure 2. Schematic Illustrating the key features of the North American Monsoon
system The schematic shows mean (July-September 1979-1995) precipitation (shading)
in millimeters, lower-tropospheric (925-hPa) vector wind (m s-1) and upper-tropospheric (200-
hPa) circulation pattern (contours). The position of the upper-tropospheric monsoon
anticyclone is indicated by “A”. The mean direction of the circulation is indicated by the large
arrows on the contours. The lower-tropospheric Bermuda and North Pacific
subtropical high pressure centers are indicated by “H”. The approximate location of the
Great Plains low-level jet is indicated by the heavy solid arrow.
15Figure 3. Schematic vertical (longitude-pressure) cross section through the North
American Monsoon System at 27.5°N. Topography data was used to establish the
horizontal scale and observed wind fields were used to establish the vertical circulations.
16Figure 4. Typical visible satellite image taken in early afternoon (around 1:00 pm local
time) showing thunderstorms building in the mountains northeast, east and southeast of
Tucson, AZ.
Figure 5. Visible (left) and infrared (right) satellite images taken later that afternoon
(around 5:30 pm local time) showing that the storms have consolidated into a large mass
and moved into the deserts
17Figure 6. A line of severe thunderstorms detected by radar at 5:30 pm under the large
cloud mass shown in Figure 5.
18July 14 July 13 July 9
July 13 July 8 July 7
July 11 July 6 July 3
June 29 June 25 June 27
June 21 June 22 June 23
June 16 June 17
June 14 June 14
June 11 June 10
June 7 June 8
June 6 June 6
June 5
H
Figure 7. Mean calendar data of onset for the summer monsoon at various locations
along the west coast of Mexico and in Arizona and western New Mexico. Onset dates
were computed using observed daily precipitation and a threshold crossing procedure that
accounted for local characteristics of the monsoon rainfall. In general, mean precipitation
during the monsoon season decreases from south to north (see Fig. 1).
19Figure 8. Histograms of the mean daily and 5-day running mean precipitation (units in
mm day-1) during May-August at locations in the southwestern United States and
Mexico. The topography of the region is also included.
20Figure 9. (Top) Mean seasonal precipitation (units in mm) for July-September.
(Bottom) Contributions of the precipitation during July-September to the annual total
precipitation, expressed in percent.
21Figure 10. Time-latitude section of the mean (1961-1990) annual cycle of
precipitation (units in mm day-1). Data are averaged zonally over west coast land
points at each latitude.
22Figure 11. Map of observed precipitation represented as the mean (1963-94) difference
between July and June. The contour interval is 0.25 mm day-1, the zero contour is
omitted for clarity, and values greater than 0.25 mm day-1 (less than -0.25 mm day-1) are
shaded green (brown).
23Figure 12. Evolution of MJO events during the summer months together with
points of origin of tropical cyclones that developed into hurricanes / typhoons (red
dots). The green (brown) shading roughly corresponds to regions where
precipitation is enhanced (suppressed). Results are based on 21 MJO events over
a 19 summer period (July-September 1979-1997). Points of origin of hurricanes /
typhoons in each panel are for different storms. Tropical cyclone data for the
Indian Ocean are not included.
24Wet
Wet
Dry
Figure 13. Schematic of the typical lower-tropospheric (700-hPa) circulation features
(heights and winds) that accompany (a) wet and (b) dry Gulf of California moisture
surges.
25You can also read