The Performance of Service, System, and Technology of E-filing Product on the Enthusiasm of People at Police Science College in Jakarta
←
→
Page content transcription
If your browser does not render page correctly, please read the page content below
Review of Integrative Business and Economics Research, Vol. 10, Supplementary Issue 2 141
The Performance of Service, System, and
Technology of E-filing Product on the
Enthusiasm of People at Police Science College
in Jakarta
Sang Ayu Putu Piastini Gunaasih
Faculty of Business and Economics, Universitas Atma Jaya Yogyakarta
ABSTRACT
Directorate General of Taxes (DGT) is one of Indonesia’s financial institutions,
collecting its primary source of tax revenues from individuals, companies and
institutions. The DGT must provide an excellent performance indicated by the tax
revenue improvement. One of the phenomenal products provided by DGT is E-Filing
(electronic filing). In this study, the influence of E-Filing was investigated to figure
out its performance in servicing and providing a good system and information. The
primary data was obtained by distributing questionnaires to Police Science College in
Jakarta, Indonesia. The significant effects of the quality of service, system, and
information of E-Filing were analysed by the DeLone and McLean model. The result
was used as a reference for DGT to determine the level of enthusiasm of people in
Police Science College regarding the E-Filing product.
Keywords: Directorate General of Taxes; E-Filing; Police Science College Jakarta;
DeLone and McLean Model.
1. INTRODUCTION
Recently, the quality of service becomes one of the successful performance
indicators for most companies and institutions. Such indicators of performance also
include the quality of the system and information. During the current pandemic of
Covid-19, companies and institutions must be ready to compete to improve their
performance in many uncommon ways. Their stakeholders will leave the companies
that can not provide excellent service, system, and information. The Directorate
General of Taxes (DGT) is one of public institutions in Indonesia assigned for
servicing the citizen in the financial sector. The DGT has an essential role in
contributing its revenue to Indonesia from taxes. More than 80% revenue of the
Indonesian State Budget (APBN) comes from tax (www.kemenkeu.go.id).
The tax collecting system conducted by DGT in Indonesia looks more
conventional comparing to the neighbour countries such as in Singapore and Malaysia.
Almost every year, the tax offices in Indonesia are always overcrowded filled by the
Copyright 2021 GMP Press and PrintingReview of Integrative Business and Economics Research, Vol. 10, Supplementary Issue 2 142
human sea. The taxpayers must come to the tax office for reporting the tax and
manually fulfil the form in the hard file. Compared to the neighbour countries, the
hard file form had not been used since a long time ago. They have developed a system
for reporting the tax electronically and can be accessed anywhere. The DGT has
begun the electronic system, namely E-Filing, for reporting the tax since 2010.
However, it was not implemented optimally. Many taxpayers do not fully understand
for reporting the tax electronically, and they are still comfortable to conventionally
report the tax by filling in the form in the hard file.
In 2015, the DGT attempted to push all government agencies, including
government colleges, to employ the E-Filing. It has been regulated by the circular
letter of the Minister of Administrative Reform and Bureaucratic Reform (Menpan RB)
number 8 the year of 2015 which stated that all of the state civil apparatus must report
the tax electronically by utilising the E-Filing no later than March 31st. In contrast,
the E-Filing was still optional for the other taxpayers. They could still report the tax
by coming to the tax office and writing the form in the hard file. The E-Filing was still
not implemented fully for all people in Indonesia until 2020 due to pandemic of
Covid-19. Following the health protocol, social distancing must be applied
everywhere, including in the tax office. The DGT has appealed to all taxpayer to
employ the E-Filing for reporting the tax. The E-Filing can be accessed anywhere and
anytime using the internet access through the DJP online website. In order to measure
the E-Filing product use maximally, several indicators must be considered by DGT.
Information technology gives many advantages to businesses, particularly for
managing data and process (Chaveesuk and Hongsuwan, 2017). It has been reported
by Arista (2016), Chen (2014), Hidayat (2017), and Widyadinanta & Toly (2014) that
E-Filing has been implemented widely in many countries, and several indicators such
as quality of service, system, and information are used as indicators to measure its
performance (Azmi & Kamarulzaman, 2010). An excellent service, system, and
information of E-Filing would encourage the taxpayers and make them get
accustomed to reporting tax in detail. The effects of these indicators are not only for
the taxpayers but also for the related institutions. According to DeLone and McLean
(2003), the overall benefits are summarised into a benefit called net benefit.
In this investigation, the quality of the service, system and information of
E-Filing was investigated to figure out the enthusiasm of taxpayers who fulfilled the
tax return (SPT) form of 1770 S at Police Science College in Jakarta, Indonesia. The
Delone and Mclean model was applied to evaluate the performance of those
indicators.
2. LITERATURE REVIEW
Copyright 2021 GMP Press and PrintingReview of Integrative Business and Economics Research, Vol. 10, Supplementary Issue 2 143
2.1 Tax Return and E-Filing
According to the Constitution of general provisions and taxation article 1 point
11, tax return (SPT) is a letter that taxpayers use to report the calculation and payment
of taxes, tax objects and non-tax objects, and assets and liabilities. For the individual
taxpayer, the individual SPT is classified into two types based on income. The
individual income up to 60 million uses SPT Form 1770 SS (revenue up to 60 million)
and the individual income more than 60 million uses SPT Form 1770 S.
The definition of E-Filing following the Director-General of Taxes Regulation
Number PER-1 / PJ / 2014 is a method of submitting SPT electronically in real-time
via the website of the Directorate General of Taxes (www.pajak.go.id) or the
application services or Application Service Provider (ASP). Real-time means
taxpayers can report SPT via the internet anywhere and anytime, and at the same time,
the DGT can check and validate the SPT data (Nurhayati & Hidayat, 2019).
Arista has previously conducted the related investigation of the E-filing system
(2016). Arista found that user satisfaction of E-filling was influenced positively and
significantly by system quality and quality of information. The positive and
significant effect on user satisfaction resulted in an impact on the taxpayer
individually. Chen (2014) presents the research results that system quality,
information quality and service quality have a positive and significant effect on users
and satisfaction. Hidayati et al., (2017) with the research title of “Analysis of the
Effect of Quality and System Quality on User Satisfaction of the E-Filing System”,
shows that the quality of information systems has a positive and significant effect on
user satisfaction of the E-Filing system, information quality has a positive and
significant effect on satisfaction. Research conducted by Saputro (2017) with the title
of “Analysis of the Success of Tax E-Filing Using the Updated Delone & Mclean
Information System Success Model”, shows the results that system quality has a
positive and significant effect on both usage and user satisfaction, information quality
has a positive and significant impact. The use of the E-Filing system has a positive
and significant effect on net benefits, and user satisfaction positively affects net
benefits. Another research conducted by Widyadinata and Toly (2014) entitled “The
Effect of System Quality, Information Quality, Timeliness, and Confidentiality on
Taxpayer Satisfaction of E-Filing Users”, shows that system quality, information
quality, and confidentiality have a positive and significant effect on the satisfaction of
taxpayers of E-Filing users who were registered at KPP Pratama Surabaya Rungkut.
However, punctuality did not have a positive and significant effect on taxpayers’
satisfaction who were E-Filing users registered at KPP Pratama Surabaya Rungkut.
2.2 DeLone & McLean Model
Copyright 2021 GMP Press and PrintingReview of Integrative Business and Economics Research, Vol. 10, Supplementary Issue 2 144
There are four theories commonly used to evaluate information system
performance, namely The Technology Acceptance Model (TAM), The DeLone and
McLean IS success model (D&M IS Success Model), The End User Computing
Satisfaction Model (EUCS), and The Task-Technology Fit Model (TTF). For the
DeLone and McLean model or known as D&M IS Success (1992), the dimensions of
success are interrelated. System quality and information quality are significant
predictors of user satisfaction. User satisfaction is a significant predictor for the
intended use and personal impact. The individual impact affects organizational
impact.
D&M IS Success (2003) has several indicators to measure its success; (1) service
quality dimension, net benefits, and the intention to use dimension. Net Benefits are
used to show the impact on performance, whether positive or negative. According to
Petter & McLean (2009), measurement performance can be the organizational
performance, work practices, and perceived usefulness. Also, Petter et al., (2013) state
that net benefits can be defined as improving decision-making, market efficiency,
consumer welfare, productivity, sales, profit, cost reduction, job creation, and
economic development.
2.3 Hypothesis Development
2.3.1 The Influence of Quality Service, System, and Information to Use
According to Hartono (2005), information quality is defined as the quality
measurement of the information system output. The quality of E-Filing information is
related to the output values, benefits, and relevance of the information generated by
the system users. This definition follows the success theory of the information system
model from DeLone and McLean used in this study. DeLone and McLean state that an
information system’s success can be represented by the qualitative characteristics of
the system quality and the quality of the output in the form of information produced
by information quality. Furthermore, information quality can give a significant impact
on individuals (Hartono, 2005). System quality is used to measure information
technology systems (DeLone and McLean, 2003). DGT E-Filing also provides
features, system performance, good user interface. The excellent quality of
information from the E-Filing system and the satisfied users will influence users’
attitudes. Service quality carried out by DGT is very important in the effort to
optimize the country’s revenue from taxes. Service quality such as quick
responsiveness, assurance, empathy, and following up will affect E-Filing. The
taxpayers will obey to report the SPT in every year. Based on the description above,
the research hypothesis can be formulated as follows.
Copyright 2021 GMP Press and PrintingReview of Integrative Business and Economics Research, Vol. 10, Supplementary Issue 2 145
H1: The use is influenced positively and significantly by information quality
H2: The use is influenced positively and significantly by system quality
H3: The use is influenced positively and significantly by service quality
2.3.2 The Influence of Quality Service, System, and Information on the User
Satisfaction
The dimension of information quality has been reported as a key to the end-user
satisfaction instrument (Maulidi, 2016). Information quality is only measured as a
user satisfaction component since it is not used as a unique idea. DeLone and McLane
(2003) show that if an information system can provide quality information, users will
feel satisfied with the obtained information. If the users perceive a good quality
system, they will feel satisfied and employ the system annually. In this study, the
research hypothesis based on the previous investigation is formulated as follows.
H4: User satisfaction is influenced positively and significantly by information quality
H5: User satisfaction is influenced positively and significantly by system quality
H6: User satisfaction is influenced positively and significantly by service quality
2.3.3 The Influence of Use and User Satisfaction on the Net Benefits
According to the DGT, information use is defined as the responsibility of all
taxpayers to report SPT annually through the E-Filing. DeLone and McLean (2003)
state that user satisfaction is considered as a function of perceived usefulness,
information quality, service quality, and system quality. User satisfaction is essential
for the acceptance and success of information systems. If someone is satisfied with
the information system, they will feel safe and comfortable using it. The higher the
user satisfaction level with the information system, the higher the net benefits for
users. In this study, the research hypothesis based on the previous investigation is
formulated as follows.
H7: Net benefit is influenced positively and significantly by use
H8: Net benefits is influenced positively and significantly by user satisfaction
3. RESEARCH METHOD
In this study, the sample used is individual taxpayers who work in Police Science
Colleges and report SPT 1770 S using E-Filing. This study adopts the modified
DeLone and McLean success model which has six latent variables as follows.
1. IQ = information quality
Copyright 2021 GMP Press and PrintingReview of Integrative Business and Economics Research, Vol. 10, Supplementary Issue 2 146
2. SQ = system quality
3. SVQ = service quality
4. U = use
5. US = user satisfaction
6. NB = net benefits
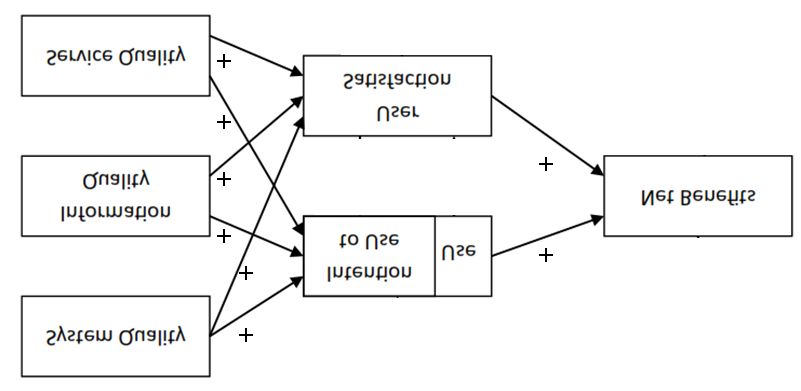
This study uses Smart Partial Least Square (PLS) software to analyse the data. The
research model based on the hypothesis development is shown in figure 1.
Figure 1. Research model using DeLone & McLean model
4. DATA ANALYSIS
4.1 Outer Model Test
The outer model test was conducted to determine the relationship between latent
variables and their indicators. This test was to determine the relation between each
indicator relates and its latent variable. The outer model test was divided into four,
namely convergent validity test, reliability test, average variance extracted (ave) test
value, and discriminant validity test.
4.1.1 Convergent Validity test
The convergent validity test was calculated by SmartPLS listed in table 1. The
test shows that all of the latent variables perform a valid loading factor value. All of
the latent variables are above 0,50.
4.1.2 Reliability Test
Table 2 shows the reliability test result for all of the latent variables. It has been
reported by Hartono & Abdillah (2017) that the Chronbach’s Alpha dan Composite
Reliability values must be more than 0,70 for the confirmatory study, and the value
between 0,60 and 0,70 is still be allowed for the exploratory study. The values for
Copyright 2021 GMP Press and PrintingReview of Integrative Business and Economics Research, Vol. 10, Supplementary Issue 2 147
latent variables in table 2 are above 0,70 both for Chronbach’s Alpha dan Composite
Reliability. These values indicate a high consistency and stability of applied
instruments. All of the determined latent variables are suitable as a measurement
instrument, and all of the questions are relevant and have excellent reliability.
Table 1. The convergent validity result for all latent variables
4.1.3 Average Variance Extracted (AVE) Test
The AVE tests were conducted to determine the variance value of all of the
latent variables. It has been reported by Haryono (2017) that the AVE value must be
above 0,50 to become valid. Table 2 shows the AVE value obtained by SmartPLS all
are more than 0,50. It can be concluded that the convergent validity for all of the
latent variables is valid. All of the latent variables can explain an average of more
than half the variance of the indicators.
Copyright 2021 GMP Press and PrintingReview of Integrative Business and Economics Research, Vol. 10, Supplementary Issue 2 148
Table 2. The reliability and AVE results for all latent variables
4.1.4 Discriminant Validity Test
Discriminant validity test shows that the latent construct predicts whether the
value of the construct is better than the value of other constructs by looking at the
construct correlation value on the cross-loadings. From the output, it can be seen that
all indicators have a correlation coefficient that is greater with each of its variables
compared to the correlation coefficient value of the indicator with other variables.
Thus, it can be concluded that each indicator in the block is the compiler of the
variable or construct in the column. Based on the results obtained, it can be seen that
the AVE root value of each variable is higher and some are lower than the correlation
value between these variables and other variables in the model. With this, it can be
said that according to the test with AVE roots, this model does not have good
discriminant validity.
4.2. Inner Model Test
The inner model test was conducted by doing several tests such as R-Square,
Effect Size (f2), Predictive Relevance (Q2), and Goodness of Fit Index (GoF).
The R-Square result shows that the value for net benefits, use, and user satisfaction
are more than 0,50. This value indicates that there is a good correlation between the
variables. Table 5 shows the f2 test result. The high value of f2 is shown to correlate
IQ to Use, IQ to User Satisfaction, and NB to US. The Predictive relevance test is
conducted to examine the capability of the model prediction. Based on the calculation,
the value of Q2 value in this investigation is 0,987. This model has good predictive
relevance since the Q2 value is more than 0. According to Ghozali dan Latan (2015),
the value GoF is classified into 0,10 (GoF small), 0,25 (GoF medium), and 0,36 (GoF
large). The value of GoF for the current model is 0,709, and this value is classified as
GoF large.
Copyright 2021 GMP Press and PrintingReview of Integrative Business and Economics Research, Vol. 10, Supplementary Issue 2 149
Table 3. Discriminant validity result
Copyright 2021 GMP Press and PrintingReview of Integrative Business and Economics Research, Vol. 10, Supplementary Issue 2 150
Table 4. R-square test result
Table 5. Effect Size (f2) test result
4.3 Hypothesis Test Result
The significant influence between the independent and the dependent variables
was determined by evaluating the path coefficients. The path coefficients show the
parameter coefficient and t-statistical significance value. The significance of the
estimated parameters can provide information about the relationship among the latent
variables. The limit for rejecting and accepting the proposed hypothesis based on the
probability value of 0.05. The estimated output for testing the structural model is
listed in table 6.
Table 6. Estimated output for testing the structural model
Copyright 2021 GMP Press and PrintingReview of Integrative Business and Economics Research, Vol. 10, Supplementary Issue 2 151 According to the table 6, the correlation among the latent variables is explained as follows. 1. Information Quality has a positive and significant effect on Use. This can be seen from the path coefficient output obtained by the value of tcount > ttable (6.661> 1.96). 2. System Quality does no effect on Use. This can be seen from the Path Coefficient output obtained by the value of tcoun < ttable (1.697 ttable (2.108> 1.96). 4. Information Quality has a positive and significant effect on User Satisfaction. This can be seen from the Path Coefficient output, which shows the value of tcount > ttable (18.683> 1.96) or P values
Review of Integrative Business and Economics Research, Vol. 10, Supplementary Issue 2 152
The third hypothesis (H3) shows positive and significant results. Thus, it can be
concluded that the Directorate General of Taxes has an IT team that is adept at solving
problems in E-Filing services. It can be seen how Directorate General of Taxes has a
good response in overcoming problems in E-Filing services. The Directorate General
of Taxes provides focused and sincere services. Hence, the interests of users of
E-Filing services influence the level of success of the intensity of E-Filing service
sites for taxpayers.
The fourth hypothesis (H4), information quality presents positive and significant
results on user satisfaction. Indicators of the quality of E-Filing information presented
in a comprehensive and easy-to-understand manner are declared successful in
influencing user satisfaction as represented by E-Filing satisfaction indicators, the
desire to use E-Filing in the future, the information presented by E-Filing uses a
suitable format.
The fifth hypothesis (H5) shows that system quality has a negative and
insignificant effect on user satisfaction. This research concludes that it is necessary to
improve the level of response, the level of difficulty in using and the level of
reliability of E-Filing services so that taxpayers will benefit from satisfaction in using
E-Filing at a later date.
The sixth hypothesis (H6), service quality has a positive but not significant effect
on user satisfaction. The results of this study explain that the Directorate General of
Taxes has an IT team that is adept at solving problems in E-Filing services and has a
good response in overcoming problems that occur in E-Filing services. It also
provides services that focus and sincerity on users’ interests of E-Filing services
which affect the level of success of user satisfaction as represented by indicators of
E-Filing satisfaction. Moreover, the desire to use E-Filing in the future and the
information presented by E-Filing is presented in a suitable format.
The seventh hypothesis (H7), use has a positive but not significant effect on net
benefits. Taxpayers’ assumptions about the use indicator that says E-Filing accelerates
taxpayers’ work in reporting SPT using E-Filing still needs to be refined again with
complaints from taxpayers who think they are still not motivated to use E-Filing
services. It might be due to the intensity factor of using E-Filing, which is only once a
year. Thus, it becomes an obstacle in assessing the significant level of E-Filing service
usage.
The eighth hypothesis (H8), user satisfaction has a positive and significant
effect on net benefits. User satisfaction indicators, namely the level of success of user
satisfaction as represented by indicators of E-Filing satisfaction, the desire to use
E-Filing in the future, and the information presented by E-Filing are presented in an
excellent format accelerating the work in completing obligations as taxpayers. In this
Copyright 2021 GMP Press and PrintingReview of Integrative Business and Economics Research, Vol. 10, Supplementary Issue 2 153
case, E-Filing assessments are more effective in annual SPT reporting, and E-Filing
services are considered to save annual SPT reporting costs. Therefore, it can be
concluded that user satisfaction is considered successful on the net benefits.
5. CONCULUSION
Four hypotheses show positive and significant results seen from the T statistic
results on the inner model test. Therefore, taxpayers are enthusiastic in using E-Filing,
and all hypotheses show a positive direction.
ACKNOWLEDGEMENT
This research has been carried out by the funding from Lembaga Penelitian dan
Pengabdian pada Masyarakat Universitas Atma Jaya Yogyakarta.
REFERENCES
[1] Arista, D. (2016). Kualitas Sistem dan Kualitas Informasi Berpengaruh terhadap
Kepuasan Pengguna E-Filing dengan Implikasinya pada Kinerja Individu. Jurnal
Akuntansi, Universitas Komputer Indonesia.
[2] Azmi, A. A. C., & Kamarulzaman, Y. (2010). Adoption of tax E-Filing: A
conceptual paper. African Journal of Business Management
[3] Chaveesuk, S. and Hongsuwan, S. (2017). A Structural Equation Model of ERP
Implementation Success in Thailand. Review of Integrative Business and
Economics Research, Vol. 6, Issue 3,page: 194-204
[4] Chen, J. V. (2014). Factors Affecting Online Tax Filing – An Application of the IS
Success Model and Trust Theory. Accounting Jurnal, Institute of International
Management Taiwan.
[5] DeLone, W. H & McLean, E. R. (2003). The DeLone and McLean Model of
Information System Success: A Ten Year Update. Journal of MIS.
[6] Hartono, J. (2005). Model Kesuksesan Sistem Teknologi Informasi, Yogyakarta:
Andi.
[7] Hartono J., & Abdillah .(2015). Konsep dan Aplikasi PLS (Partial Least Square)
untuk Penelitian Empiris. Yogyakarta: BPFE UGM
[8] Haryono, Siswoyo. (2017). “Metode SEM Untuk Penelitian Manajemen dengan
AMOS Lisrel PLS”. Cetakan I. Penerbit Luxima Metro Media, Jakarta.
[9] Hidayati N., Harimurti D., & Dewi. (2017). Analisi Pengaruh Kualitas dan
Kualitas Sistem terhadap Kepuasan Pengguna Sistem E-Filing. Jurnal Akuntansi
di Universitas Muhammadiyah Surakarta.
[10] Maulidi, R. (2016). Analisis Kesuksesan Penerapan Sistem Informasi pada Sistem
Informasi Terpadu Tamziz (ICS 1RO1) Real time Online. Universitas Islam
Indonesia
Copyright 2021 GMP Press and PrintingReview of Integrative Business and Economics Research, Vol. 10, Supplementary Issue 2 154
[11] Nurhayati, E & Hidayati, E. (2019). Analisis Perbandingan Prediksi
Keberterimaan E-Filing dengan E-Form dalam Penyampaian Surat
Pemberitahuan Tahunan 1770/1770S. Jurnal Akuntansi & Ekonomi FE. UN PGRI
Kediri. Vol 4. No. 2.
[12] Petter, S., DeLone, W. H., & McLean E.R. (2013). Information systems success:
The quest for the independent variables. Journal of Management Information
Systems.
[13] Petter, S., & McLean, E. R. (2009). A meta-analytic assessment of the DeLone
and McLean IS success model: An examination of IS success at the individual
level. Information and Management, 46(3), page:159–166
[14] Saputro, S. B. (2017). Analisis Kesuksesan Penerapan E-Filing Pajak
Menggunakan Model Kesuksesan Sistem Informasi Delone & Mclean Diperbarui.
Skripsi Akuntansi, Universitas Gajah Mada.
[15] Widyadinata, Y. dan Toly, A. A. (2014). Pengaruh Kualitas Sistem, Kualitas
Informasi, Ketepatan Waktu, dan Kerahasiaan terhadap Kepuasan Wajib Pajak
Pengguna E-Filing. Jurnal Akuntansi, Universitas Kristen Petra. Vol 4, No 1.
[16] Circular letter of the Minister of Administrative Reform and Bureaucratic Reform
(Menpan RB) number 8 the year of 2015
[17] Taxes Regulation PER 1-PJ-2014
[18] www.kemenkeu.go.id
[19] www. Pajak.go.id
Copyright 2021 GMP Press and PrintingYou can also read