The planning and implementation of Learning Analytics at James Cook University - Val Ruffle: Learning Analytics Specialist Learning, Teaching and ...
←
→
Page content transcription
If your browser does not render page correctly, please read the page content below
The planning and implementation of
Learning Analytics at James Cook University

Val Ruffle: Learning Analytics Specialist

Learning, Teaching and Student Engagement
James Cook University at a glance
    Main campuses in Cairns, Singapore and Townsville

•    Approx. 20 000 students
•    72% undergraduate students
•    65% of students are first in family
•    24% are low SES
•    5% of students are Aboriginal and or Torres Strait Islander Students
•    4.5% of students have a disability
•    24% of students come from rural or remote areas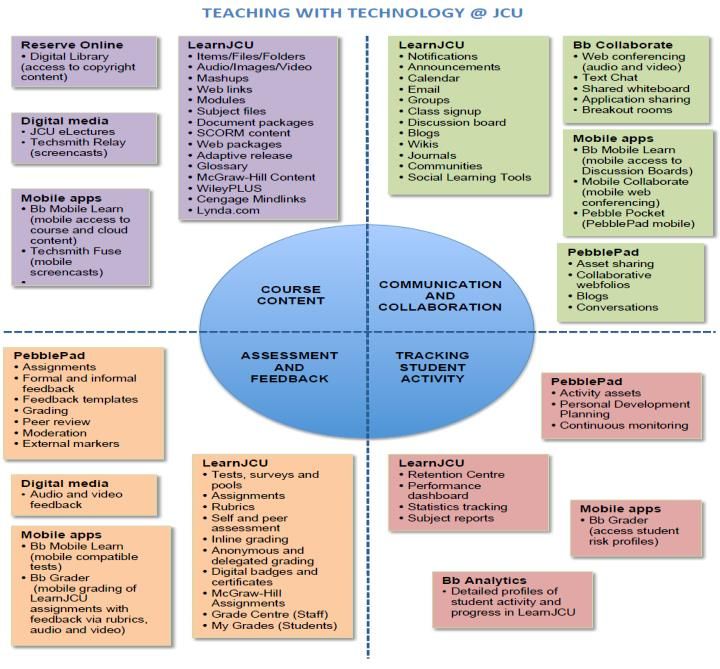
A sample of the initiatives
Enhancing learning and teaching               Enhancing the student experience
Embed English Language and Numeracy           Transition programs eg UniStart, Orientation

Improve intentional Blended Learning          Employ College Student Support Officers
design
Develop engaging and scaffolded assessment Build a coordinated pathways program

Utilise data to target and improve subjects   Deploy scholarships to support participation
Embed Career Development opportunities        Promote Peer Assisted Study Sessions (PASS)

Engage learning leaders around the            Expand Career Development Learning and
University eg: ADTL’s, FYEC                   Student Mentor program

JCU: Data driven reform….

                     Data access = role + security level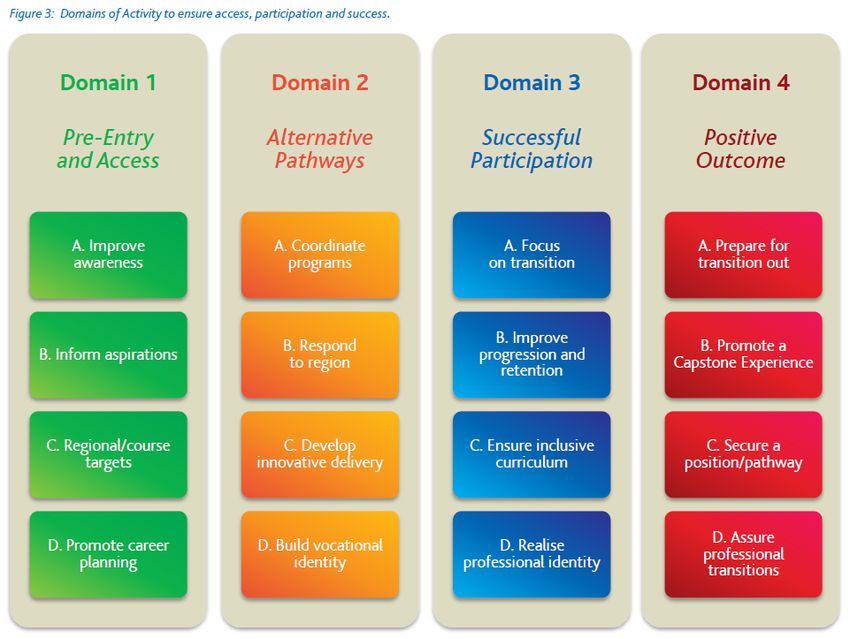
How does Learning Analytics fit in?
Kift’s (2008) “harness the curriculum as the academic and social ‘organising
device’ to do serious transition and retention work”

 We have taken a dual pronged approach:

 1/ Whole of Institution Student Support Strategy

 2/ Interrogate data to enable the redesign of
 curriculum to meet the needs of today’s Learner
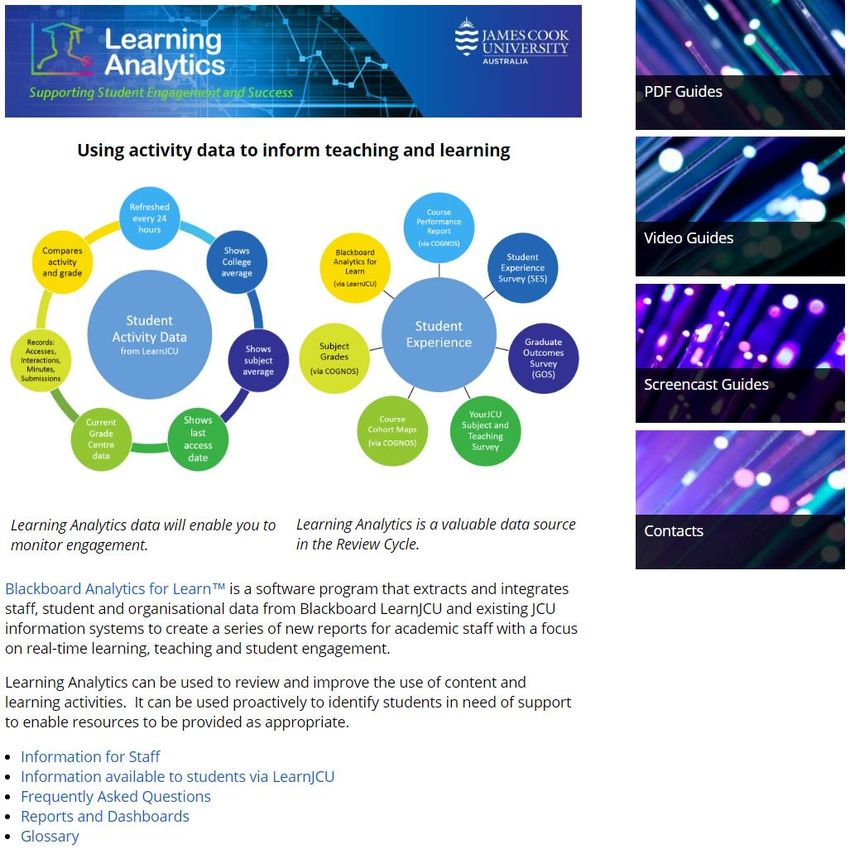
Why Learning Analytics?
                          PLAN - Start with the data
Reflection using
synthesis of data               COGNOS, SIS &
                                previous year’s LA data
                                informs planning

Adapt teaching
and
assessment to
match student
progress

                    Use Assessment data to analyse
                    student and subject progress
Timeline

                                         2014 - Data integration and preparation
           2013 Project Planning
                                                Collaboration with Stakeholders

                                       2015 - Customisations, testing, staged
 2016 - Framework for a Whole of
                                              release to defined role groups
        Institution Student Support
                                              Level 1 and 2 Reports and
          Strategy
                                                Dashboards
        Introduction of Push Reports
                                              Security Matrix finalized
        Ad-hoc Data requests
                                              Staff access and training
        Curriculum redesign
                                              Self serve help resources prepared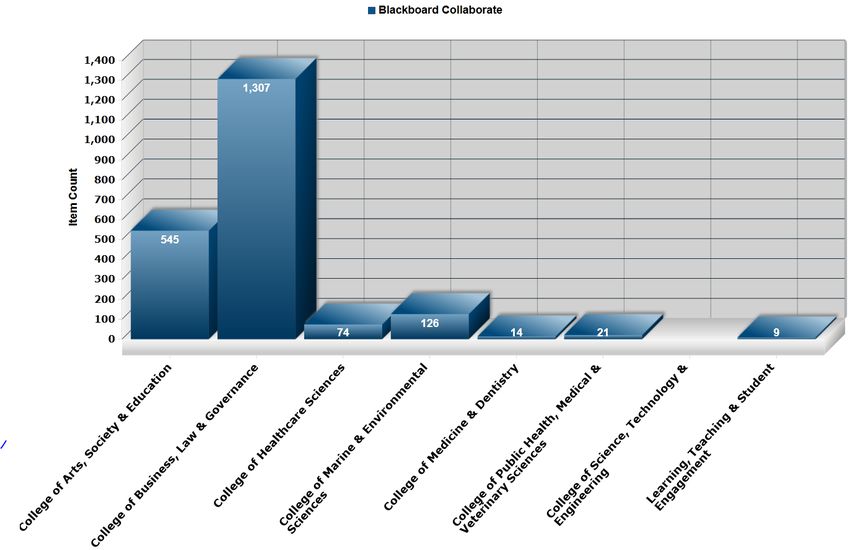
Teaching with Technology

Levels of report access

LEVEL 1   Subject Coordinators & Teaching Staff

LEVEL 2   Student Support Staff

Dashboards     Student Support Staff
College Support Officers use case for Learning Analytics
– based on the ‘Student Life Cycle’
Level 1 reports
accessible in all LearnJCU Subject sites
Level 2 report
accessible via a portal in Staff Resources

                                             All users
                                             require a
                                             separate
                                             login and
                                             password
                                             from
                                             Blackboard

                                             Login:
                                             bbpr\jblogs
Level 2 reports
Role groups as
per the
Security MatrixDashboards built using Pyramid BI
2015 Purpose built Dashboards
– to inform? to support?
assumed users would
embrace the new
too early in the First Year Experience
implementation phase Coordinators Dashboard
buy in was not evident
Time overwhelmed by the
poor data volume
College Support Officer
Dashboard
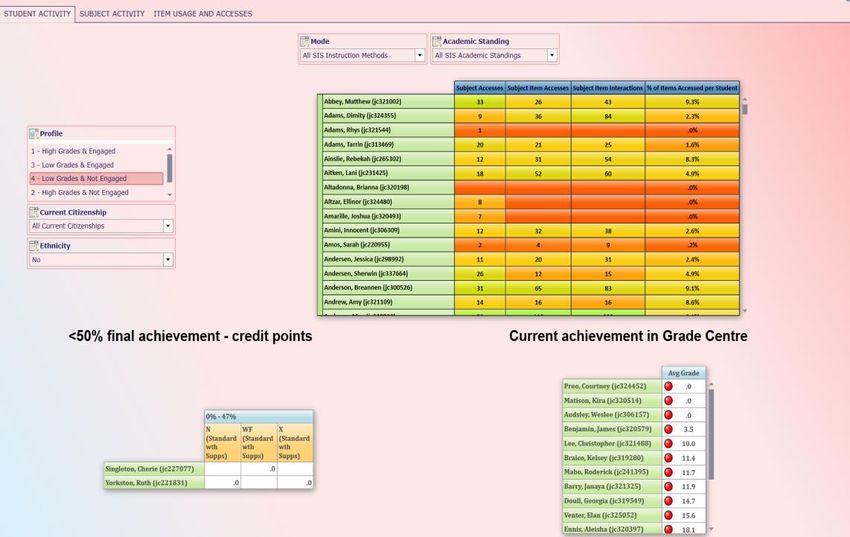
Extra login and password!2015 - Intentional Blended Learning design • How are academics using the array of learning technologies? • How do students make use of these resources/tools? • How does activity correlate with student success and engagement?
Security Matrix and Role groups
Self-serve HELP

                  Resources
                  to suit all
                  Learners
2015 - How? informing subject planning and monitoring Diploma of Higher Education (new course 2015) • Identify Support needs – Weekly monitoring – Early identification – Case management • Curriculum reflection – Consideration of access – Online resources – review and tracking – feedback for site design – Data for planning and Professional development
2015 - Proof?
Data to learning design
2015 - What?
Data to support curriculum redesign
2015 - Why?
To initiate change
Reflection …
•   No one likes change
•   More structure around Student Support at JCU
•   More support and training on how to interrogate data
•   Dashboards were not widely used – only 15% take up
•   Blackboard unprepared
•   The journey is beginning for Educational Designers in
    colleges
        Changes will be needed in 2016….
2016 – The Plan? – Student Support & Learning Analytics Triage Plan ver1. – Recording Student Support as an organising tool – Weekly Push Reports for Student Support stakeholders – Training sessions for Educators – Partnerships with Educational Designers – Communication for future directions
Where to from here?
– Maintain and expand role groups to:
Remote Study Centres
Course Coordinators
Deans of Colleges
– Build and test Curriculum review and use reports:
Nominated Courses in Colleges working with Ed Designers
Provide data at a Discipline, College and Whole of Institution
–Wish list - plan and build an integrated Subject Dashboard :
Sitting inside JCU Staff Online section
Linked to a CRM – single point of truth / Student ProfileAnd finally the goal is to
Engage staff to ‘harness the data’!
– Demographic data
– Student learning data
– Learning analytics
– Student evaluation data
– Predictive analytics
IMPROVE THE STUDENT EXPERIENCE,
ENGAGEMENT AND RETENTION!References JCU Access Participation & Success Plan 2015-2017, available at: https://www.jcu.edu.au/__data/assets/pdf_file/0012/121503/jcu_145875.pdf Kift, Sally. 21st Century Climate for Change: Curriculum Design for Quality Learning Engagement in Law [online]. Legal Education Review, Vol. 18, No. 1/2, 2008: 1-30. Availability: ISSN: 1033-2839. [cited 24 May 16]. JCU Blended Learning Guide, available at: https://www.jcu.edu.au/__data/assets/pdf_file/0004/227866/JCU-Blended-Learning-Guide-2015.pdf Pyramid Analytics website: http://www.pyramidanalytics.com/ Learning Analytics at JCU webpage: https://www.jcu.edu.au/learning-and-teaching/designing-for- learning/blended-learning/learning-analytics
You can also read