The Seven Top Airport Trends, 2018-2027 - Preview To The 2018 - Aviation Forecast Summit
←
→
Page content transcription
If your browser does not render page correctly, please read the page content below
1

Forecast Highlights

 The Seven Top Airport
   Trends, 2018-2027

                             &
                    Preview To The 2018

                                    Prepared & Researched By

                                 78 Beaver Brook Canyon Road, Evergreen, Colorado USA 80439
                                            (303) 674-2000 www.AviationPlanning.com
    ________________________________________________________________________________________________________
                                                             © 2018 Boyd Group International, Inc. All rights reserved.
2

                                                   Background
Airports:USA® was established in 1992, as an alternative to error-prone FAA forecasts, which
themselves were not immune from political intervention.

A total of 146 airports were chosen for the forecast, including the 100 largest enplanement facilities and
the remainder selected to represent regional sectors. These airports comprise over 95% of all US
passenger traffic.

Unlike obsolete FAA forecast methodologies, Airports:USA® understands that air traffic is no longer
simply a function of airlines adding capacity where raw economic metrics dictate. Today, it is largely
airline revenue and market strategies that drive where enplanements will grow or decline.

As examples, no FAA methodology predicted the massive decline in enplanements at St. Louis, which
was the result of a corporate decision on the part of American Airlines to eliminate its connecting hub
operations there. And no FAA econometric forecast could predict that Southwest, years after the AA
decision, would transform that airport back in to a connecting hub.

This is what sets Airports:USA® apart. We focus not only on econometric trends, but more on known
and expected airline strategy, fleet, and competitive shifts. It’s the reason our forecasts are more
focused on reality.

Categories

The FAA still classifies airports as “non-hub” and then small, medium and large “hub.” Unfortunately
their use of the term “hub” has nothing whatsoever to do with the industry definition. Today, a hub
airport is understood to be one where an airline has made the decision to apply aircraft and resources to
inter-connect passenger over its route system. Why the FAA still uses these terms inappropriately is
unknown. It does, however, consistently mislead the public and the media. Furthermore, no airport is a
“hub” – it is an airline that puts a hub operation at a given airport. This is the reason we use the term
“hubsite”

Airports:USA® puts airports in three categories.

Hubsites – airports where an airline applies resources to interconnect passengers, and where the total
enplanements are 22% or more comprised as connecting traffic.

Large Non-Hubsite Airports. Airports with over 2 million annual enplanements and no significant airline
connecting operation. These are airports such as Tampa, Tucson, Reno, etc.

Regional Airports. Those in the forecast that have less than 2 million annual enplanements.

Subscriptions to Airports:USA® are available in several levels. Furthermore, this expertise is also applied
to specific forecast channels, including master plan projections. Please give us a call or e-mail.

             ________________________________________________________________________________________________________
                                                                      © 2018 Boyd Group International, Inc. All rights reserved.
3
The Seven Top Airport Trends
There are a number of forecast threads in the Airports:USA® forecast that we’ll be discussing in
several aspects during the International Aviation Forecast Summit.
Traffic Overview
US airports will experience 1.1 billion enplanements in 2027, up from 825 million in 2017.
Hubsite Airports: +25.7%
Large Non-Hubsite Airports: +32.0%
Regional Airports +34.9%
The 1 billion enplanement level is expected to be reached in year 2023. For years, FAA forecasts
consistently mis-projected this figure. In the early 1990s, they indicated it would be reached in
early 2000s, and that projection kept sliding, due to forecast methodologies that simply had
little to do airline industry realities.
The Trends To Watch
These affect all areas of aviation, from airports to aircraft manufacturers to financial institution
to suppliers.
1. More US International Service From Coastal US Airports. It was at the 2010 IAFS™ that
the prediction was made that airports such as Memphis, Nashville, Indianapolis, etc.
would be prime targets for trans-Atlantic service. Now that this factor is in full swing,
other consulting firms are now “predicting” it.
Moving forward, Airports:USA® forecasts that new-generation airliners will engender a
new expansion of EU/UK flying. In particular, there will be more trans-Atlantic potential
from airports such as Providence, Albany, Manchester, Charleston (SC) and Jacksonville,
as examples.
2. Shift In Passenger/Enplanement Ratio. Because of the connecting itineraries generated
by the hub-and-spoke system, on average, one passenger itinerary generates an average
of 1.3 enplanements. The terms are often confused, but they are important to
understand.
In the course of the next ten years, the percentage of passenger itineraries involving a
connecting flight will drop slightly. While the number of passengers traveling is forecast
to increase by 29.5%, enplanements will increase only 25.5%. This is the result of several
emerging airline strategy and route system shifts. More itineraries will be nonstop,
which will be also increased by the expected expansion of ultra low-cost carriers.
________________________________________________________________________________________________________
© 2018 Boyd Group International, Inc. All rights reserved.4
3. Hub-Choke. The net increase in enplanements though 2027 – almost 224 million –
equates to the total 2017 traffic at the nation’s six largest airports – Atlanta, Los
Angeles, Chicago/O’Hare, Dallas-Ft. Worth, Denver, and New York JFK – combined.
This growth will be concurrent with fleets that will have approximately 12% more seats
per aircraft. Not only highest and best use of airline hubsite resources will be the order
of the day (read: feed markets with the highest revenue return), but due to larger
aircraft, the bar for service to smaller airports will be going up considerably.
4. Regionalization of Air Access. Related to trend #3, a key foundational concept of the
IAFS™ is that all communication channels have fundamentally changed in the past 30
years, and the relative utility of each channel has changed as well. Air transportation as
a communication channel has not been immune to these shifts.
Economic changes, consumer patterns, and alternative communication channels have
permanently changed the value and the potential of scheduled flights at small
community local airports. Often, these facilities are simply off the table for such service.
One reality is that for small airports, the one, two or three daily flights it might be able
to support on paper to a major airline connecting hub often represent higher total travel
time than driving to alternative airports even as much as 90 minutes away to get a
nonstop flight to the final destination. This has been experienced at a number of small
airports, such as Topeka, Laughlin-Bullhead City, and Youngstown. It is the consumer,
not civic hubris, that makes the decision.
For such communities, new air access approaches must be pursued, because as will be
outlined at the IAFS™, regardless of the number of market studies and other schemes,
many small communities simply cannot support scheduled service at the local airport.
Embracing the larger airport, 45-50 or even 90 minutes away may be the only option for
the future.
5. China Access Increasingly Important – But Challenging. As will be also outlined during
the IAFS™ Airports:China™ forecast session, access from China will be an important
factor in every US region’s economic development planning.
But the very nature of the Chinese air transportation system demands carefully-crafted
outreach, and the acceptance of the fact that China-US air traffic is mostly from the
Chinese city, and aggregation and distribution of traffic is only to and from US points.
There are no large US-style connecting hub operations at any Chinese airport – yet.
At the Summit, we’ll be outlining the unique nature of this emerging traffic. We will be
identifying and ranking the US airports with the highest value and potential for China
access.
________________________________________________________________________________________________________
© 2018 Boyd Group International, Inc. All rights reserved.5
Because of the fact that China-US traffic will need strong aggregation of passengers to
and from US growth points, the next phase of route expansion is forecast to focus on
hubsites.
Within this, it will be specific hubsites that will see the growth. Among new-route
airports, Charlotte is forecast to have the strongest near-term potential for increased
access from points other than “Jing-Hu” – Beijing and Shanghai.
6. The Wildcatter Airline Segment. Ultra Low Cost Carriers – ULCCs – now represent a new
dimension in the use of airliners. Instead of flying to fill or meet demonstrated air
service needs, these carriers are strongly focused on offering air travel as a discretionary
spend item. This can result in huge traffic spikes at small and mid-size airports. But
those spikes can rapidly deflate if the ULCC finds the traffic to be unsatisfactory. This we
define as the “Islip Dynamic.”
,
We’ll be looking at this dynamic, and talking with ULCC CEOs and senior executives at
the Summit.
7. International Component To Strengthen. International traffic will grow as an important
segment for all US airports.
As we’ve pointed out in the past, almost all of the rhetoric about travel bans hurting US
image has come from the political views of some leaders in US travel industry itself,
almost telling the world they shouldn’t come to the US. It has probably caused some
damage to the reputation of the USA... self-inflicted.
But the fact is that the international component of US airport traffic is now over 30%,
and will be over 36% by 2027. This includes direct international traffic, and that which is
indirectly delivered via foreign visitors making trips within the US subsequent to their
arrival.
These are the key trends – but we’ll be exploring a lot more at the IAFS™ If you have not
registered for the 23rd Boyd Group International Aviation Forecast Summit, we’d suggest you do
so now, at www.AviationForecastSummit.com
________________________________________________________________________________________________________
© 2018 Boyd Group International, Inc. All rights reserved.6
More Insight & Business Intelligence – The IAFS™
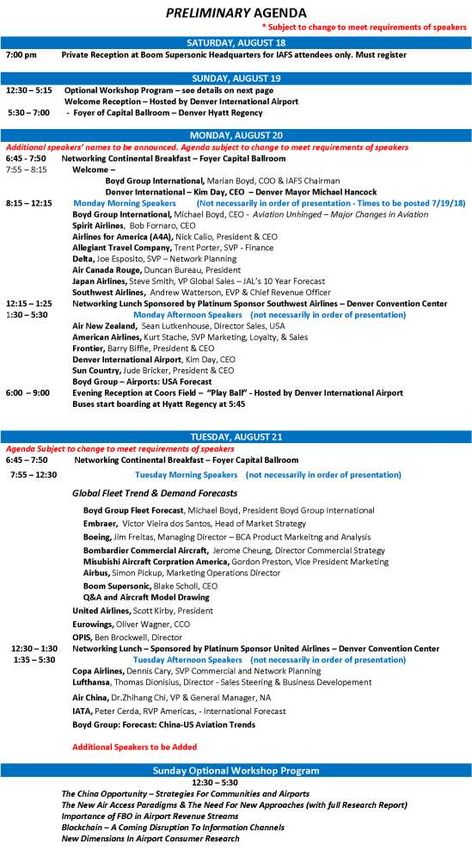
One August 18-21, the 23rd International Aviation Forecast Summit in Denver will be exploring
the future directly with the industry executives who will be driving it.
With over 70 airline staff attending – from CEOs
through to market planners – there will be
enormous opportunities to network.
Plus, there are outstanding forecasts of areas
such as the fleets airlines will be operating in
the future, the new technology that will change
how airports will service customers, and the new strategies that will continue to alter air
transportation within the channels of business communication.
Data & Insight Not At Any Other Event!
Plus, exclusive forecasts, including the Airports:USA® projections covering 146 airports
that handle over 95% of all passenger traffic.
Another exclusive it the Airports:China™ forecast that is the premier source for US
communities planning to increase traffic and air service with China.
Insights from the CEOs and executives driving the future!
Networking? Over 70 airline executives and staff from across the industry are attending.
Bring business cards – at the sessions and at the networking receptions, you’ll have the
opportunity to meet the decision-makers in the industry.
The Supersonic Future. And don’t forget the Saturday evening reception to be hosted by
Boom Supersonic. Their 2.2 Mach aircraft will change how international travel is
delivered – and it’s not much more than five years away.
Optional Pre-Summit Workshops. Join us on Sunday afternoon, August 19, for an
exciting series of Workshops covering areas that represent more data than other
conferences in their entirety.
So, take a look at the attached agenda, and then log on to www.AviationForecastSummit.com
and be sure to reserve your space now at the #1 aviation event of the year!
________________________________________________________________________________________________________
© 2018 Boyd Group International, Inc. All rights reserved.7
________________________________________________________________________________________________________
© 2018 Boyd Group International, Inc. All rights reserved.You can also read