The State of Britain's Larger Moths 2021 - Butterfly Conservation
←
→
Page content transcription
If your browser does not render page correctly, please read the page content below
STAT E O F B R I TA I N ’ S L A R G E R M OT H S 2 0 2 1 | B U T T E R F LY - C O N S E R VAT I O N . O R G | 1

The State of Britain’s
Larger Moths 2021

2 | B U T T E R F LY - C O N S E R VAT I O N . O R G | STAT E O F B R I TA I N ’ S L A R G E R M OT H S 20 21
Executive summary
• Long-running data on insect populations are more regular additional generations. Research
scarce globally, hampering attempts to assess indicates that early emergence benefits moths
how these extremely diverse and ecologically that have more than one generation each year in
Keith Tailby
vital creatures are faring in the current Britain, but not those with a single annual brood.
biodiversity crisis. Larger (macro-) moths in
Great Britain are an exception, providing insights • Extinctions are still occurring but the
Scarce Silver Y into the trends of a species-rich group of rediscovery of some moth species and natural
Syngrapha invertebrates during a time of unprecedented recolonisation by others has reduced the
interrogationis is a human pressure on the natural world. number believed to have become extinct in
moorland moth of Britain since 1900.The total now stands at 51
northern and western • This report summarises current knowledge of species (including micro-moths).
Britain. Its abundance the state of Britain’s c.900 species of larger moths,
has decreased by presenting analyses of long-term change based • Many more moth species have colonised
69% (1968–2017) and on millions of records gathered through the Britain. Since 1900, 137 moth species (including
its distribution by 71% Rothamsted Insect Survey (RIS) and National micro-moths) have become (and remain)
(1990–2016). Moth Recording Scheme (NMRS). established, including 53 this century. Some have
arrived naturally, expanding their European range
• The total abundance of larger moths caught in response to climate change, while others have
in the RIS light-trap network in Britain decreased been unwittingly imported through the global
by 33% over 50 years (1968–2017). Losses trade in plants.
were greater in the southern half of Britain
(39% decrease) than in the northern half (22%). • The precise causes of all these changes
remain unclear. Habitat destruction and
• Long-term abundance trends were calculated deterioration remain pressing concerns, driven
for 427 species of which 41% (175 species) had by land-use change and chemical pollution.
decreased and only 10% (42 species) increased, Artificial light at night has negative effects on
with the remaining 49% (210 species) having moth development and behaviour, but links to
trends that did not show statistically significant population-level decline are yet to be proved.
change. Thus, four times as many moth species Climate change is the principal driver of range
decreased in abundance than increased. expansion, but there is also growing evidence of
negative impacts, particularly on moths that are
• Distribution trends revealed a different adapted to cooler conditions in northern,
picture. Of 511 larger moth species for which western and upland Britain.
long-term trends could be calculated from NMRS
data, 32% (165 species) decreased in distribution • Despite the enormous challenge of halting
and 37% (187 species) increased, while 31% (159 moth declines, there are some signs of hope.
species) had non-significant trends. More moth Given the necessary resources and the
species increased in distribution than declined. determination and skill of conservationists,
landowners and volunteers, moths can be saved
• A multi-species distribution indicator from the brink of extinction. Fine-tuned
increased in extent by 9% over a 47-year period management of individual sites, bold landscape-
(1970–2016) and the northern range margins of scale conservation projects and the long-term
moths have, on average, shifted northwards by commitment required to recreate biodiverse
5km per year (1995–2016). habitats are forging a brighter future for some of
our rarest moths.
• Moths that breed in woodland and open
grasslands increased in distribution, by an • The decline of moths and other insects, both
average of 12% and 8% respectively (1970–2016). in Britain and elsewhere, is clear and demands
Species that breed on moorland decreased an urgent response.We do not need to wait for
significantly in distribution, by an average of 13%. robust global trends or scientific proof of causes
of change.The existing evidence is compelling
• The pattern of change is complex.The and clear policy pathways have already been
decline in abundance of larger moths is clear, yet identified; we can and should act now. In Britain,
the distributions of many species are increasing. expanding, restoring, connecting and creating
It must also be remembered that we do not have habitats that support rich arrays of moths and
trends for most scarce and rare species. other wildlife, that improve human wellbeing and
that deliver ecosystem services such as carbon
• The warming climate is causing many moth storage, flood prevention and cleaner air, is the
species to emerge earlier in the year compared key to reversing moth declines and confronting
Cover image: Small Elephant
Hawk-moth Deilephila porcellus.
with the 1970s and some are having larger and the biodiversity and climate crises.
The distribution of this moth has
increased by 147% in Britain
(1970–2016). (Bob Eade)
STAT E O F B R I TA I N ’ S L A R G E R M OT H S 2 0 2 1 | B U T T E R F LY - C O N S E R VAT I O N . O R G | 3

                                                         Introduction
                                                         The world is facing a biodiversity crisis. An                           different measures of change (such as
                                                         estimated one million species are threatened                            abundance and distribution). This complexity
                                                         with extinction¹, vertebrate populations                                in insect trends is shown in analyses of moths
Iain H Leach

                                                         decreased by 68% on average between 1970                                from around the world¹¹. Overall declines in
                                                         and 2016² and globally agreed targets to reduce                         abundance or diversity, or both, have been
                                                         the pressures on biodiversity have not been met³.                       reported at national, regional or site scales in
                Canary-shouldered                        The trends of insects, which make up at least                           several European countries including Finland¹²,
                Thorn Ennomos                            60% of all species on Earth4 and contribute                             Germany¹³, Hungary¹4, the Netherlands¹5,
                alniaria has                             vital and valuable ecosystem services, such as                          Sweden¹6 and the United Kingdom (UK)¹7.
                decreased in                             decomposition, pest control and pollination,
                abundance by                             remain poorly understood.                                               The previous State of Britain’s Larger Moths
                72% (1968–2017)                                                                                                  reports in 2006 and 2013 showed that total moth
                but increased in                         Recently, there has been great public concern                           abundance had decreased, but that around
                distribution by                          about impending ‘insect Armageddon’, that is the                        one-third of widespread species had increased,
                15% (1970–2016).                         catastrophic loss of insects across the whole                           and there was no overall change in the northern
                                                         world.This concern was ignited by the mass                              half of Britain¹8. In addition, more recent
                                                         media reporting of recent studies such as those                         assessments of British moths over the same
                                                         at sites in Germany5 and Puerto Rico6. Global and                       decades found that species had, on average,
                                                         continental assessments for insects (and other                          increased in distribution¹9. Similar findings have
                                                         invertebrates) have generally shown overall                             come from Finland, where moth species’
                                                         declines in abundance of terrestrial species7,                          richness has increased but abundance has
                                                         but the available evidence is heavily biased                            declined²0, and Hungary, where moth diversity
                                                         towards Europe and North America. Long-term,                            has decreased but total abundance has not¹4.
                                                         continuous records of insect abundance and
                                                         distribution are very rare elsewhere in the world,                      The few studies of moth populations outside
                                                         particularly in the tropics. Even where data exist,                     Europe also reflect this heterogeneity, with
                                                         analyses are fraught with difficulty8.Thus, while                       decreases in caterpillar abundance and
                                                         there is considerable evidence for insect                               diversity at a site in Costa Rica²¹, but no overall
                                                         declines9, the data are insufficient to support                         decline at monitored sites in Ecuador, Arizona
                                                         extrapolated conclusions about the scale of the                         (USA) or Missouri (USA)²².
                                                         worldwide decreases across all insect groups¹0.
                                                                                                                                 Given this complex picture and the paucity of
                                                         However, insect biodiversity trends are also                            long-term data on moths in many parts of the
                                                         complex. Headline figures of decline hide a                             world, The State of Britain’s Larger Moths 2021
                                                         multitude of winners and losers, as well as                             report offers a new opportunity to assess patterns
                                                         variation in trends between different                                   of biodiversity change for this ecologically
                                                         geographical areas and time periods.                                    important group using the most comprehensive
                                                         Sometimes there are conflicting signals from                            moth datasets in the world.

                                                              DEDICATION
                                                              This third assessment of The State of Britain’s Larger Moths is dedicated to Dr Kelvin Conrad
                                                              who passed away in 2018 at the age of 56. His work on moth population trends at Rothamsted
                                                              Research was the key driver for the first such report in 2006, which he co-authored. It is also
                                                              dedicated to all of the RIS light-trap operators/identifiers and NMRS County Moth Recorders,
                                                              without whose dedication, expertise and hard work such assessments would not be possible.

               1 Díaz et al. 2019                                                 8 Didham et al. 2020                                         ¹6 Franzén & Johannesson 2007
               2 WWF 2020                                                         9 Sánchez-Bayo & Wyckhuys 2019, Wagner 2020                  ¹7 Conrad et al. 2006, Fox et al. 2014, Dennis et al. 2019
               3 Secretariat of the Convention on Biological Diversity 2020       ¹0 Montgomery et al. 2020, Saunders et al. 2020              18 Fox et al. 2006, Fox et al. 2013
               4 Eggleton 2020                                                    ¹¹ Wagner et al. 2021                                        19 Outhwaite et al. 2020
               5 Hallmann et al. 2017                                             ¹² Mattila et al. 2006, Antão et al. 2020                    20 Antão et al. 2020
               6 Lister & Garcia 2018                                             ¹³ Habel et al. 2019a                                        21 Salcido et al. 2020
               7 Dirzo et al. 2014, Pilotto et al. 2020, van Klink et al. 2020,   ¹4 Valtonen et al. 2017                                      22 Marquis et al. 2019, Wagner et al. 2021
               but see Crossley et al. 2020                                       ¹5 Groenendijk & Ellis 2011
4 | B U T T E R F LY - C O N S E R VAT I O N . O R G | STAT E O F B R I TA I N ’ S L A R G E R M OT H S 20 21

                                                       The evidence base
                                                       The UK is fortunate in having a long history of                                enable more realistic estimates of missing counts
                                                       moth recording undertaken by skilled amateur                                   where there are gaps in sampling27, trends to be
Paul Kirkland

                                                       naturalists as well as the most comprehensive                                  based on the full site-level data28 and estimates of
                                                       data on moth abundance in the world from the                                   uncertainty provided for each trend29.
                                                       Rothamsted Insect Survey (RIS).The latter has
                                                       been the focus of previous assessments of the                                  For the analysis of total abundance of all
                                                       state of Britain’s larger moths, which showed                                  larger moths caught in the RIS network30, two
                                                       abundance trends from RIS data for 35-year                                     different trend assessments were carried out,
                                                       (1968–2002)23 and 40-year (1968–2007)24                                        one to estimate the long-term change over the
                                                       periods. In this new report, we reanalyse the                                  whole 50-year time period and the other using
                                                       RIS data, extending the time period to 50 years                                non-linear trends to identify significant year-to-
                                                       (1968–2017), but also present distribution                                     year changes31.
                                                       (occupancy) trends based on sightings collated
                                                       through the National Moth Recording Scheme.
                                                       In both cases, the trends presented are for Great
                                                                                                                                          RIS light-traps used for
                                                       Britain (i.e. England, Scotland and Wales) plus                                    analysis of total moth
                                                                                                                                                                  Location of RIS Sites
                                                       the Isle of Man. Utilising these two different data                                abundance and individual
                                                                                                                                          species trends
                                                       sources provides separate but complementary
                                                       insights into how species of larger moths                                          Additional RIS light-traps
                                                                                                                                          only used in the analysis of
                                                       have fared.                                                                        individual species trends

                                                       ROTHAMSTED INSECT SURVEY
                                                       ABUNDANCE TRENDS
                                                       This network of standardised, automated
                                                       light-traps is the longest-running, large-scale time
                                                       series of data on insect populations in the world.
                                                       The first RIS light-trap was operated at
                                                       Rothamsted Research in Hertfordshire in the
                                                       1930s, where analysis has revealed a 71%
                                                       reduction in average numbers of larger moths
                                                       at that site between pre-1950 catches and
                                                       1960–197925. Since the 1960s, nightly sampling has
                                                       taken place at sites across the UK to monitor the
                                                       relative abundance of nocturnal larger moths26.

                                                       Long-term abundance trends for Britain were
                                                       calculated from the RIS dataset for 427 larger
                                                       moth species (90 species more than in the
                                                       previous State of Britain’s Larger Moths reports)
                                                       and also for the total abundance of all larger
                                                       moths. In most cases these trends cover 50 years
                                                       (1968–2017), but shorter time periods were
                                                       used for 30 species (mainly pugs Eupithecia spp.)
                                                       due to identification or taxonomic problems
                                                       early in the series.The shortest trends are for
                                                       1986–2017 and cover 32 years.

                                                       The analysis techniques used here to calculate
                                                       trends differ from those used in previous reports,                             The locations of 527 RIS traps that contributed to the
                                                       due to statistical advances in recent years.                                   50-year assessment (1968–2017) of moth abundance
                                                       For individual species, new techniques                                         trends in Britain.

                23 Fox et al. 2006     27 The Generalised Abundance Index (GAI) approach (Dennis et al. 2016) was used           trends resulting from insufficient RIS data were excluded.
                24 Fox et al. 2013     to model annual species flight curves, which were then used to estimate missing           30 Only 386 RIS sites with one or more years of ‘complete’ data (few or no substantial
                25 Woiwod &            count values. All 527 sites in the RIS were included in the species trend analysis.       gaps in counts during the year, following Conrad et al. 2004) were used for the total
                Gould 2008             28 A Poisson generalised linear model was fitted to the imputed annual site totals        abundance analyses. Including sites with larger within-year gaps in recording or only
                26 Conrad et al.       from the GAI, with site identity as a categorical effect but year as a continuous         using sites with at least five years of data made no major differences to the results.
                2007                   variable, allowing the species trend to be estimated from the full site-level data        31 Following the approach of Bell et al. 2020, the long-term trend was estimated by
                                       (thereby incorporating as much of the original variability as possible), rather than by   fitting a log-linear model with a quasipoisson distribution using restricted maximum
                                       simply fitting a standard linear model to the final yearly indices.                       likelihood. Non-linear trends to assess year-to-year change were calculated from a
                                       29 Bootstrapping was used to evaluate the uncertainty associated with each trend          generalised additive mixed model using generalised cross validation. Bootstrapping
                                       and thereby determine statistical significance of the abundance trends. Unreliable        was used to estimate uncertainty around trends.
STAT E O F B R I TA I N ’ S L A R G E R M OT H S 2 0 2 1 | B U T T E R F LY - C O N S E R VAT I O N . O R G | 5

NATIONAL MOTH RECORDING SCHEME                                            recording varies considerably from place to
DISTRIBUTION TRENDS                                                       place and over time, a simple analysis of species
The National Moth Recording Scheme (NMRS)                                 distributions (e.g. the number of grid squares in
was launched by Butterfly Conservation in 2007                            which a species has been recorded in two
to create a UK database of moth records to                                different time periods) will be biased by changes
support conservation32.The database has grown                             in recording effort34. A statistical approach called
rapidly and was recently used, in collaboration                           occupancy modelling was used to account for
with MothsIreland, to publish the first complete                          variation in recording and, therefore, estimate the
set of distribution maps for all larger moth                              underlying real changes in species distribution35.
species across Britain and Ireland33. Sampling
for the NMRS is not standardised – participants                           This is the first time that distribution trends have
can record wherever and whenever they choose                              contributed to the State of Britain’s Larger Moths
using a variety of techniques. Most records are of                        assessment. NMRS records for 1970–2016 were
nocturnal adult moths attracted to light-traps, but                       used to calculate species distribution trends                                   Published in late
sightings of any life cycle stage at any time of day                      at 1km × 1km grid square resolution. After                                      2019, the Atlas of
can be contributed.Thus, in contrast to the RIS,                          excluding species with insufficient data to                                     Britain & Ireland’s
the NMRS gathers data on all moths, not just                              generate reliable trends36, change was calculated                               Larger Moths33 is
nocturnal species that are attracted to light.                            for 390 larger moths since 1970, a further 58                                   the first-ever atlas
NMRS records are collated and verified locally                            species since 1980 and an additional 63 since                                   covering all larger
by County Moth Recorders.                                                 1990, giving a total of 511 species with long-term                              moths in Britain,
                                                                          distribution trends. Each species trend was then                                Ireland, the Isle
Over 24 million NMRS records for Britain and                              converted to an average change over                                             of Man and the
the Isle of Man have been used to calculate the                           10 years, so that species could be directly                                     Channel Islands.
fine-scale, long-term distribution (occupancy)                            compared despite change being measured
trends presented in this report. Because                                  over different time periods.

                                                                 No. of species per 10km square 2000 onwards 9-band (1-reversed) SOBM

                                            1-25 (359)
                                            26-50 (218)
Species richness of larger moths in the UK and
                                            51-100 (325)
                                            101-200 (588)
 Isle of Man 2000–2016 based on NMRS data.  201-300 (614)
                                            301-400 (553)
The number of 10km x 10km grid squares in each
                                            401-450 (191)
                                            451-500 (68)
species richness category is given in the key.
                                            501-548 (16)

There are more species in southern Britain than
further north, principally because of climatic
differences but also due to the proximity of
continental Europe for immigration and colonisation.

   1–25 (359)            301–400 (553)
   26–50 (218)           401–450 (191)
   51–100 (325)          451–500 (68)
   101–200 (588)         501–548 (16)
   201–300 (614)

32 Fox et al. 2011               35 The occupancy modelling approach followed Dennis et al. 2019 and the trends
33 Randle et al. 2019            presented are those published in Randle et al. 2019. For a given species and year,
34 Isaac & Pocock 2015           occupancy probability was estimated for each 1km x 1km grid square, using records
                                 for all species to account for recording effort and phenology to estimate detection
                                 probability. The average of these values formed an annual occupancy index for
                                 each species, from which linear trends over time were calculated to assess
                                 changes in distribution.
                                 36 See Randle et al. 2019 for more details.
6 | B U T T E R F LY - C O N S E R VAT I O N . O R G | STAT E O F B R I TA I N ’ S L A R G E R M OT H S 20 21

                                                     Colonisations
                                                     and extinctions
Dan Lombard

                                                     The moth fauna of Britain is not static. Many                            (recorded after a gap of 23 years since the last
                                                     native species are under pressure, with their                            British sighting) and Hypercallia citrinalis
                                                     habitats destroyed or altered by human activity37,                       (after a 40-year gap). Furthermore, some species
              Over the course of                     and some have sadly been lost as resident                                previously lost from Britain have recolonised
              less than 100 years,                   species. On the other hand, drivers such as                              (e.g. Clifden Nonpareil Catocala fraxini and
              Clifden Nonpareil                      climate change, cultivation of non-native plants                         Flame Brocade Trigonophora flammea).
              Catocala fraxini has                   and the global horticultural trade have provided
              colonised Britain,                     opportunities for moth species from continental                          Extinctions have continued though. In the last
              become extinct                         Europe and much further afield to colonise.                              10 years, there have been no further records of
              and recolonised.                       Most of these are innocuous additions to our                             Brighton Wainscot Oria musculosa, Bordered
                                                     biodiversity, but a few present potential                                Gothic Sideridis reticulata or Stout Dart
                                                     problems, such as Oak Processionary                                      Spaelotis ravida, which are now considered
                                                     Thaumetopoea processionea and Box-tree                                   extinct in Britain.Three additional species
                                                     Moth Cydalima perspectalis.                                              have now been highlighted as potentially extinct:
                                                                                                                              Aproaerema albipalpella, Scythris siccella and
                                                     The number of moth species (including                                    Pale Shining Brown Polia bombycina38. Grave
                                                     micro-moths) considered extinct in Britain since                         concerns for the continued resident status of
                                                     1900 now stands at 5138, which is considerably                           Speckled Footman Coscinia cribraria, which
                                                     lower than reported in the previous assessment                           had not been seen at any of its remaining
                                                     (63 species)39.This reduction is due to the                              Dorset sites since 2014 despite extensive
                                                     rediscovery of some species thought to be                                searches, were tempered when a single adult
                                                     extinct in Britain, including Aproaerema vinella                         was recorded in June 2020.

              PALE SHINING BROWN
              Polia bombycina
                  Pre-1970
                  1970–1999
                  2000–2016
                                                                                                               Keith Tailby

                                                                                                              A very severe distribution decline, especially since the 1970s, reduced the
                                                                                                              Pale Shining Brown to small areas of Hertfordshire, Norfolk, Oxfordshire
                                                                                                              and Wiltshire. A lack of sightings from any of these areas since 2017,
                                                                                                              despite targeted surveys, has raised concerns that the moth may have
                                                                                                              been lost from Britain as a resident species.

              37 Hayhow et al. 2019
              38 Parsons 2020
              39 Parsons 2010
STAT E O F B R I TA I N ’ S L A R G E R M OT H S 2 0 2 1 | B U T T E R F LY - C O N S E R VAT I O N . O R G | 7

While the number of moths considered extinct in
Britain has decreased, the number of new
colonists continues to rise and the rate seems to
                                                                                                                                         Dusky Hook-tip
be increasing. Since 1900, 137 moth species have
colonised Britain and are still extant here, 53
(39%) of which have become established this
century (31 in 2000–2009 and 22 in 2010–2019)40.
The total from the last decade is expected to rise
as there are several other species that require
more data to either determine when they first
colonised (e.g. Cryptic Fern Horisme radicaria41)
or whether they are, as yet, established as a
breeding species (e.g. Golden Twin-spot
Chrysodeixis chalcites and Radford’s Flame

                                                                                                                                                                   Nigel Jarman
Shoulder Ochropleura leucogaster).

Among those recent colonists that appear
to have arrived naturally, some, such as
Black-spotted Chestnut Conistra rubiginosa,
had never been recorded in Britain before                                                                                               Rosy Underwing
while others are long-standing migrants or
vagrants that have now also become established
in certain parts of the country (e.g. Catoptria
verellus and Dusky Hook-tip Drepana curvatula).
Climate change, which is causing the
distributions of many taxa to expand polewards42,
is the likely driver of such colonisations.

The other major factor responsible for the
establishment of non-native insect species is the
global plant trade43.The importation of plants

                                                                                                                                                                   Keith Tailby
(both native species and exotics) into Britain
provides a direct pathway for the increasing
arrival of new insect species44. Oak Processionary,
for example, had occurred as a scarce immigrant
to these shores but all records had been of male
                                                                                                                                           Ringed Border
moths so the chance of establishment was
considered low. However, in the mid-2000s, it was
accidentally introduced into London, probably
as eggs, with imported oak trees.The species,
which can cause allergic reactions in humans
and animals, has spread rapidly in spite of a
substantial control programme, and climate
change modelling suggests that much of Britain
will become suitable for the moth by 205045.
Butterfly Conservation has objected to the
Forestry Commission over the widespread use
                                                                                                                                                                   Neil Sherman

of pesticides that are toxic to many moth and
butterfly caterpillars for control of Oak
Processionary, including in Sites of Special
Scientific Interest. Less damaging methods of
control (removal of larval nests) should be used                     Three recent colonists: Dusky Hook-tip Drepana curvatula became
where necessary. In addition, Butterfly                              established in Kent c.2012, Rosy Underwing Catocala electa in Dorset in
                                                                     2013 and Ringed Border Stegania cararia also in Kent in 2017. All three have
Conservation is working with Defra to highlight                      reached Britain naturally (having previously occurred as immigrants or
the occurrence of scarce species and rich                            vagrants) and use native larval hostplants. Time will tell whether they expand
communities of moths (based on NMRS data) in                         from these small footholds and become a widespread and long-term part of
affected areas to support informed decisions                         the resident moth fauna.
about control measures.

40 Parsons 2020                           43 Liebhold et al. 2016
41 Smith & Clancy 2019                    44 Smith et al. 2018
42 Chen et al. 2011                       45 Godefroid et al. 2020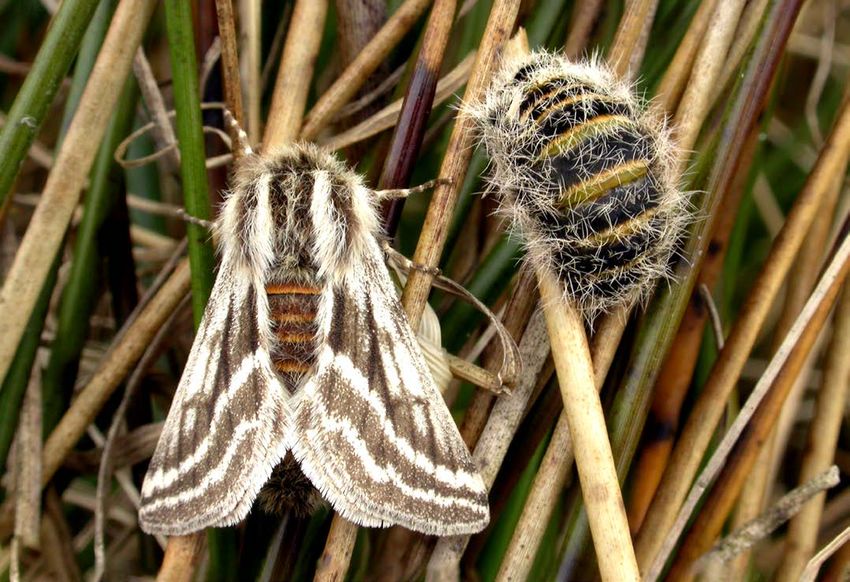
8 | B U T T E R F LY - C O N S E R VAT I O N . O R G | STAT E O F B R I TA I N ’ S L A R G E R M OT H S 20 21
Overall trends in moth
abundance and distribution
Bob Eade
Over the past five decades the abundance of and 40 years, and other studies47.The use of a
nocturnal larger moths decreased by 33%, with non-linear trend analysis (Fig. 2) shows that large
a greater decline in southern Britain (39%) than short-term increases and decreases in moth
Scorched Wing in the north (22%). In contrast, larger moths abundance are common events. Particularly
Plagodis dolabraria increased in distribution, by an average of 9%, large increases occurred between 1975–1976 and
shows no long-term likely driven mainly by climate change. 1994–1996, and these were followed by major
change in abundance, decreases between 1976–1978 and 1996–1998.
but a 71% increase ABUNDANCE Trends in the total abundance of all larger moths
in distribution The total abundance of all larger moths recorded in the RIS were also calculated
(1970–2016). caught in the RIS light-trap network in Britain separately for the northern and southern halves
over a 50-year period (1968–2017) decreased of Britain, defined by the 450km N line of the
significantly by 33% (Fig.1).This rate of decline is Ordnance Survey National Grid (which runs
consistent with previous State of Britain’s Larger from Fleetwood on the west coast of Lancashire,
Moths reports46, which measured change over 35 through York to Hornsea on the east coast
BRITAIN
1.6 Figure 1 Change in the total
abundance of all larger moths
caught in the RIS light-trap network
1.4
in Great Britain and the Isle of Man
1968–2017. The plots show the
mean annual population index and
95% confidence interval (grey), the
1.2
linear trend (red) and 95%
ABUNDANCE INDEX
confidence interval (blue). The
long-term linear trend (with 95%
1.0 confidence intervals) was -33%
(-44%, -21%) for Britain, -22%
(-36%, .-3%) for northern Britain
0.8 and -39% (-50%, -27%) for
southern Britain. All three trends
are statistically significant.
0.6
0.4
1970 1980 1990 2000 2010
YEAR
NORTH SOUTH
1.6 1.6
1.4 1.4
ABUNDANCE INDEX
ABUNDANCE INDEX
1.2 1.2
1.0 1.0
0.8 0.8
0.6 0.6
0.4 0.4
1970 1980 1990 2000 2010 1970 1980 1990 2000 2010
YEAR YEAR
46 Fox et al. 2006, Fox et al. 2013
47 Bell et al. 2020
STAT E O F B R I TA I N ’ S L A R G E R M OT H S 2 0 2 1 | B U T T E R F LY - C O N S E R VAT I O N . O R G | 9

                     1.6
                                                                                                                             130

                     1.4

                                                                                                                             120
                     1.2

                                                                                                    DISTRIBUTION INDICATOR
   ABUNDANCE INDEX

                                                                                                                             110
                     1.0

                     0.8                                                                                                     100

                     0.6                                                                                                     90

                     0.4
                                                                                                                             80
                           1970   1980   1990          2000         2010                                                           1970       1980         1990          2000         2010
                                             YEAR                                                                                                                 YEAR

Figure 2 Change in the total abundance of all larger moths caught in the                                                     Figure 3 Multi-species indicator of change in distribution of larger
RIS light-trap network in Great Britain and the Isle of Man 1968–2017                                                        moths in Great Britain and the Isle of Man 1970–2016, with
assessed using a flexible non-linear model. Statistically significant short-term                                             smoothed indicator (red) and its 95% confidence interval (blue). The
increases (dark blue) or decreases (orange) in abundance are superimposed                                                    long-term trend (with 95% confidence intervals) was 9% (7%, 13%).
on the long-term trend (black) with 95% confidence intervals (light blue).

of Yorkshire). Moths decreased over the 50-year                                 NMRS data, using a different occupancy
period, by 22% in northern Britain (113 RIS sites)                              modelling approach, also concluded that
and by 39% the south (273 sites) (Fig. 1).The                                   the larger moth distribution indicator had
finding that moth numbers have decreased in                                     increased by 9%51.
northern Britain is particularly important
because previous analyses over 35 and 40 years                                  COMPLEX PATTERNS OF CHANGE
showed no overall decline for this region.                                      The total abundance trends and moth
                                                                                distribution indicator provide different summary
DISTRIBUTION                                                                    measures of how larger moths have fared in
A multi-species indicator based on NMRS data                                    Britain.They suggest that moths have declined in
provides an overall picture of the changing                                     abundance while simultaneously expanding
distribution of larger moth species in Britain.                                 their distributions.
The occupancy models for each of the 511 moth
species for which individual long-term trends                                   This seemingly paradoxical pattern has also
were produced (see p.5) were combined to                                        been noted in Finland, where a significant
produce a single averaged index for each year.                                  decrease in moth abundance over 20 years
A smoothed indicator with confidence intervals                                  occurred in parallel with a significant rise
was then generated from these annual indices                                    in species richness52. It might arise simply
and the distribution trend over time calculated48.                              from variation in trends between species,
                                                                                from dissimilar responses of particular species
This distribution indicator shows that larger moth                              in different parts of their range (e.g. declines
species in Britain increased in extent by an                                    in one area but increases in another, perhaps
average of 9% over the 47-year period (1970–                                    due to spatially variable impacts of drivers
2016) (Fig. 3).This mirrors the pattern of                                      such as intensive land-use and climate
northward shift in range margin and consequent                                  change) or from the scale at which trends
increase in distribution seen among many insect                                 are measured (populations can decrease
and other arthropod groups in response to                                       hugely in abundance while still appearing as
climate change49.The moth indicator shows that                                  ‘present’ in a distribution model).
there was a large increase in distribution from
the mid-1970s to mid-1990s, but little overall                                  Whatever the causes, the complex overall
change in the last 20 years.The trend was similar                               patterns of change for Britain’s larger
when calculated only from the subset of 390                                     moths make the development of effective
species with distribution trends for the full time                              policies to address the biodiversity crisis
period50. In addition, a separate analysis of the                               even more challenging.

48 Following the approach of Dennis et al. 2019, the multi-species indicator of moth             50 The distribution indicator trend (with 95% confidence intervals) based on only those 390
distribution change was constructed from the geometric mean of annual occupancy                  species with robust occupancy indices over the full period (1970–2016) was an increase of 6%
indices for 511 individual species. A smoothed indicator was produced posthoc by fitting         (5%, 7%). Thus we retained the extra species (58 with trends 1980–2016 and a further 63 with
a generalised additive model to these annual indices. The trend over time was then               trends 1990–2016) in the indicator to make it as representative as possible of GB larger moths.
calculated as a linear regression through the smoothed indicator, with 95% confidence            51 Outhwaite et al. 2020
intervals estimated using a parametric bootstrap.                                                52 Antão et al. 2020
49 Hickling et al. 2006, Mason et al. 2015
10 | B U T T E R F LY - C O N S E R VAT I O N . O R G | STAT E O F B R I TA I N ’ S L A R G E R M OT H S 20 21

Moth species trends
LONG-TERM ABUNDANCE TRENDS
Using standardised counts from the RIS light-trap
network, long-term population trends were
calculated for 427 species.These tend to be
relatively common and widespread species,
                                                                                                       75
because scarcer moths are not caught in
sufficient numbers across the network to enable

                                                                                   NUMBER OF SPECIES
robust assessment of population change.
Overall, 296 (69%) larger moths had negative                                                           50
trends and 131 (31%) positive trends (Fig. 4).
However, because sampling is incomplete and
because moth populations vary greatly from
year to year, it is prudent to focus on those                                                          25
species trends that are statistically significant.
In such cases, we can have high confidence
that these species have genuinely changed in
abundance over time.                                                                                    0
                                                                                                             -90 -80 -70 -60 -50 -40 -30 -20 -10   0   10 20 30 40 50 60 70 80 90 100 >110
Four times as many moth species declined                                                                                       ABUNDANCE TREND (10 YEAR % CHANGE)
significantly in abundance than increased
significantly in Britain over 50 years. In all, 175
                                                                                    Figure 4 Long-term abundance trends of 427 species of larger moth.
species (41% of the total) had statistically                                        For each species, the size of the abundance change is given as the average
significant decreases compared with only 42                                         10-year rate of change across the time period assessed, which varies from
species (10% of the total) with significant                                         32–50 years depending on the species. Statistically significant trends are
population increases (Fig. 4).The remaining                                         shown in darker shades and non-significant trends in paler shades.
210 species (49%) had non-significant trends.

LONG-TERM DISTRIBUTION TRENDS
Occupancy modelling was used to produce
long-term distribution trends for 511 larger                                                      150
moth species. In total, 227 species (44%) had
decreased and 284 (56%) had increased (Fig. 5).
                                                                                   NUMBER OF SPECIES

Those species trends that were statistically
significant showed a similar pattern with                                                              100
165 species (32% of the total) having significant
long-term declines in distribution and 187
(37% of the total) significant increases (Fig. 5).
Thus, slightly more species had increased in                                                           50
distribution than decreased, while 159 species
(31%) had non-significant trends. More moth
species have increased in distribution in Britain
than have declined since 1970.                                                                          0

                                                                                                             -90 -80 -70 -60 -50 -40 -30 -20 -10   0   10 20 30 40 50 60 70 80 90 100 >110
Again, this highlights the complexity of                                                                                      DISTRIBUTION TREND (10 YEAR % CHANGE)
biodiversity change over recent decades. While
larger moth abundance in Britain has decreased
significantly, raising grave concerns for the                                       Figure 5 Long-term distribution trends of 511 species of larger moth.
                                                                                    For each species, the size of the distribution change is given as the average
species themselves and for knock-on impacts on                                      10-year rate of change across the time period assessed, which varies from
other wildlife, a substantial proportion of moths                                   27–47 years depending on the species. Statistically significant trends are
are bucking that trend, becoming more                                               shown in darker shades and non-significant trends in paler shades.
widespread and, in some cases, also increasing
dramatically in numbers.
STAT E O F B R I TA I N ’ S L A R G E R M OT H S 2 0 2 1 | B U T T E R F LY - C O N S E R VAT I O N . O R G | 11
MONITORING BRITAIN’S
RAREST MOTHS Sussex Emerald
In addition to trends derived from the long-
running data of the RIS and NMRS, population
monitoring has been carried out on a small
number of rare moths in Britain, mainly since the
year 2000. Data for some of these species
contribute to a UK government indicator of
priority species53 and can be used to calculate
individual species trends. Currently, annual
monitoring takes place for at least some
populations of 14 rare moth species, using a
variety of methods including transects and timed
counts of adults (e.g. for Bright Wave Idaea
ochrata and Dark Bordered Beauty Epione
vespertaria), counts of larvae or larval cases
(e.g. Eudarcia richardsoni and Marsh Moth Athetis
Keith Tailby
pallustris), and egg counts (Fiery Clearwing
Pyropteron chrysidiformis).
Butterfly Conservation aims to increase the SUSSEX EMERALD
coverage and quality of rare moth monitoring
and has recently identified 40 additional species 1.00
that could be included54. For some of these, little
extra effort is required on top of existing work,
but for others monitoring methods will have to
be designed and trialled, volunteers recruited 0.75
ABUNDANCE INDEX
and trained, and sufficient resources made
available. It is likely to take several years for good
coverage to be achieved for many of the species.
0.50
Despite the difficulties of carrying out fieldwork
in 2020, as a result of the Covid-19 pandemic,
monitoring work started on a few species
(e.g. Mountain Burnet Zygaena exulans) and 0.25
trials were conducted on several others
(e.g. Kentish Glory Endromis versicolora and
Four-spotted Tyta luctuosa).
2000 2005 2010 2015
YEAR
NETTED CARPET
50
40
ABUNDANCE INDEX
30
20
10
Figure 6 Abundance trends from larval monitoring of
Sussex Emerald Thalera fimbrialis at Dungeness, Kent 0
(significant decrease of 66% in abundance 2000–
2019) and Netted Carpet Eustroma reticulata across its
Lake District and north Lancashire colonies (significant 2000 2005 2010 2015
increase of 906% in abundance 2000–2018). YEAR
53 Eaton et al. 2015
54 Tordoff 20201 2 | B U T T E R F LY - C O N S E R VAT I O N . O R G | STAT E O F B R I TA I N ’ S L A R G E R M OT H S 20 21
Moths in decline
Many species of larger moths have declined in Plusia Polychrysia moneta, Garden Dart Euxoa
Britain over the past five decades. Long-term nigricans and Lappet Gastropacha quercifolia, but
Patrick Clement
trends show that 41% of species decreased others show large decreases in only one of the
significantly in abundance and 32% suffered two measures. This is in part because not all
significant reductions in distribution. species have trends for both abundance and
distribution – Stout Dart Spaelotis ravida, for
Rosy Minor Litoligia Tables 1 and 2 show the 30 species with the most example, has the highest rate of abundance
literosa: 92% severe rates of abundance and distribution decline but, while it has clearly suffered a
decrease in decrease.These are expressed as rates of change catastrophic distribution decrease (and may be
abundance over an average 10-year period, so that valid extinct in Britain, p.6), there are insufficient data
(1968–2017) and comparisons can be made between species with to calculate a long-term trend. Alternatively, a
21% decrease trends measured over different durations.The full species’ abundance and distribution trends may
in distribution percentage change over the whole time period differ substantially for reasons including time
(1970–2016). assessed is given, for example species, elsewhere lags between population-level decline and
in the text but with the full date period shown. reduction in distribution or different responses
around Britain (e.g. abundance decline in the
Some species have high rates of decline in both core part of the species’ distribution, but range
abundance and distribution, such as Golden expansion at the northern edge).
TABLE 1
Thirty species of larger moths with the highest (statistically significant) rates of decrease in abundance measured over an average 10-year period.
Species Abundance trend
Average 10-year
% change
Stout Dart Spaelotis ravida -81 Large Nutmeg Apamea anceps -44
Golden Plusia Polychrysia moneta -58 Small Autumnal Moth Epirrita filigrammaria -44
Garden Dart Euxoa nigricans -54 Maple Pug Eupithecia inturbata -44
V-Moth Macaria wauaria -54 Brindled Ochre Dasypolia templi -42
Large Thorn Ennomos autumnaria -53 Anomalous Stilbia anomala -41
Lappet Gastropacha quercifolia -53
Beaded Chestnut Agrochola lychnidis -41
Oak Lutestring Cymatophorina diluta
-52 Dot Moth Melanchra persicariae -40
Figure of Eight Diloba caeruleocephala
-48 Dark-barred Twin-spot Carpet Xanthorhoe ferrugata -40
Lead Belle Scotopteryx mucronata -48 Broad-barred White Hecatera bicolorata -40
Dusky-lemon Sallow Cirrhia gilvago -47 White-line Dart Euxoa tritici -39
Spinach Eulithis mellinata -47 Satyr Pug Eupithecia satyrata -38
Dusky Thorn Ennomos fuscantaria -47 Lackey Malacosoma neustria -38
Double Dart Graphiphora augur -45 Red Carpet Xanthorhoe decoloraria -38
Hedge Rustic Tholera cespitis -44 Larch Pug Eupithecia lariciata -38
Juniper Pug Eupithecia pusillata -44 Broom-tip Chesias rufata -38STAT E O F B R I TA I N ’ S L A R G E R M OT H S 2 0 2 1 | B U T T E R F LY - C O N S E R VAT I O N . O R G | 13
TABLE 2
Thirty species of larger moths with the highest (statistically significant) rates of decrease in distribution measured over an average 10-year period.
Species Distribution trend
Average 10-year
% change
Netted Pug Eupithecia venosata -64 Crinan Ear Amphipoea crinanensis -30
Ruddy Carpet Catarhoe rubidata -57 Grass Wave Perconia strigillaria -30
Plain Pug Eupithecia simpliciata -54 Sand Dart Agrotis ripae -29
Brown-veined Wainscot Archanara dissoluta -50 Shore Wainscot Mythimna litoralis -29
White Colon Sideridis turbida -42 Larch Pug Eupithecia lariciata -29
Northern Deep-brown Dart -41 Angle-barred / Ash / Tamarisk Pug -29
Aporophyla lueneburgensis Eupithecia innotata
Orange Moth Angerona prunaria -40 Gold Swift Phymatopus hecta -29
Ruddy Highflyer Hydriomena ruberata -38 Blossom Underwing Orthosia miniosa -29
Bilberry Pug Pasiphila debiliata -36 Cloaked Carpet Euphyia biangulata -29
Mocha Cyclophora annularia -35 Crescent Striped Apamea oblonga -28
Scarce Silver Y Syngrapha interrogationis -35 Ochreous Pug Eupithecia indigata -28
Lead-coloured Drab Orthosia populeti -31 Grey Mountain Carpet Entephria caesiata -28
Garden Dart Euxoa nigricans -31 Golden Plusia Polychrysia moneta -28
Juniper Carpet Thera juniperata -30 Barred Hook-tip Watsonalla cultraria -28
Clouded Buff Diacrisia sannio -30 Double Dart Graphiphora augur -26
Peter Maton
Keith Tailby
Lappet Gastropacha quercifolia: 98% decrease in abundance Dark Spinach Pelurga comitata: 90% decrease in abundance (1968–2017)
(1968–2017) and 61% decrease in distribution (1980–2016). and 52% decrease in distribution (1970–2016).1 4 | B U T T E R F LY - C O N S E R VAT I O N . O R G | STAT E O F B R I TA I N ’ S L A R G E R M OT H S 20 21
DOUBLE DART Pre-1970
Graphiphora augur 1970–1999
-96% abundance (1968–2017) 2000–2016
-79% distribution (1970–2016)
Double Dart has decreased
severely over the past 50 years,
Keith Tailby
particularly in southern Britain.
Its abundance declined sharply
until the late 1990s, by which time
it was very scarce in the RIS 1000
network, and has remained so. 500
ABUNDANCE INDEX
It is a moth of broadleaved 200
100
woodland and scrubby habitats, 50
where its caterpillars feed on 20
common trees such as willows, 10
Blackthorn and birches, as well as 5
2
herbaceous plants.The causes of 1
its decline are unknown. 0
1970 1980 1990 2000 2010
YEAR
RED CARPET Pre-1970
Xanthorhoe decoloraria 1970–1999
-92% abundance (1968–2017) 2000–2016
-62% distribution (1970–2016)
Red Carpet is a northern species,
restricted to higher altitudes in
Keith Tailby
Britain, except in Orkney and
Shetland where it occurs at lower
elevations. It typically occurs on
grassy hillsides with rocky outcrops 1000
and the larvae feed on lady’s- 500
ABUNDANCE INDEX
mantles.The steep declines of this
moth are most pronounced in the 200
southern half of its range, which is 100
consistent with a negative response 50
to climate change. 20
10
5
1970 1980 1990 2000 2010
YEAR
FLOUNCED CHESTNUT Pre-1970
Agrochola helvola 1970–1999
-87% abundance (1968–2017) 2000–2016
-55% distribution (1970–2016)
Although it does not feature in the
Neil Sherman
30 most rapidly decreasing species
for abundance or distribution,
Flounced Chestnut has undergone
severe declines. Its numbers at RIS
sites decreased steeply until the 500
turn of the century, but have since
shown little overall change. Recent 200
ABUNDANCE INDEX
100
distribution declines seem to be
50
concentrated in south-east England
and the Midlands. It is associated 20
with woody plants and is found in 10
broadleaved woodland and scrub, 5
as well as on heaths and moors. 2
1
1970 1980 1990 2000 2010
YEAR
These plots show the annual abundance indices (blue points and line) and their 95% confidence intervals
(blue shading) and the trend (bold red line) and its 95% confidence intervals (pale red lines). The grey horizontal
line shows the average annual abundance index across the entire time period. The vertical axis is on a log scale.STAT E O F B R I TA I N ’ S L A R G E R M OT H S 2 0 2 1 | B U T T E R F LY - C O N S E R VAT I O N . O R G | 15
STAYING COOL
Many larger moths that have a northern and western 1970–2016), Grey Chi Antitype chi (57% decrease
distribution in Britain, and are associated with cool, damp 1970–2016) and Brindled Ochre Dasypolia templi
climates, appear to be retreating. Examples include Grey (76% decrease 1970–2016). Most of these species also
Mountain Carpet Entephria caesiata (81% decrease in appeared to be shifting to higher altitude in a study in
distribution 1970–2016) and Glaucous Shears Papestra Yorkshire55. While the causes are not known with
biren (38% decrease 1970–2016) (both shown below), complete certainty, these distribution declines are in
Autumn Green Carpet Chloroclysta miata (38% decrease keeping with expected responses to climate change.
GREY MOUNTAIN CARPET GLAUCOUS SHEARS
Pre-1970 Pre-1970
1970–1999 1970–1999
2000–2016 2000–2016
All of the species with long-term RIS and NMRS familiar with moths that used to be common.
trends are relatively common and widespread, Writing more than a century ago, Richard South
or at least were for a substantial part of the time observed that the Garden Tiger Arctia caja was a
period assessed. In general, reliable trends cannot moth that “few persons living in the country, and
be calculated for scarcer species, unless specific at all interested in the natural objects around
population monitoring has been carried out them, will fail to recognize”58. Sadly, after a 90%
(e.g. for rare, conservation-priority species p.11). decline in abundance since the late 1960s, as
However, the decrease of widespread larger well as a significant reduction in distribution
moths is perhaps more worrying than declines of (24% decrease since 1970), many people are
scarce species, and certainly presents a greater no longer familiar with this spectacular moth
conservation challenge, as it suggests a pervasive, or its “woolly bear” caterpillars.
insidious deterioration of the environment.
This disconnect is linked with another
Abundant and widespread species contribute phenomenon called ‘shifting baseline syndrome’,
disproportionately to both biomass (i.e. food for whereby people who did not experience higher
other organisms) and ecosystem functioning levels of wildlife abundance in the past accept
(e.g. pollination), so their declines may have the current depleted populations as the norm59.
severe impacts on other species56. In addition, Together, these have negative implications
because most interactions between people and for conservation; people who are detached
moths occur with widespread species, these from nature or unaware of the scale of change
declines are a factor in the ‘extinction of are unlikely to support ambitious efforts to
experience’57, whereby people are no longer restore it.
55 Fletcher 2018 58 South 1907
56 Kleijn et al. 2015, Winfree et al. 2015 59 Soga & Gaston 2018
57 Soga & Gaston 20161 6 | B U T T E R F LY - C O N S E R VAT I O N . O R G | STAT E O F B R I TA I N ’ S L A R G E R M OT H S 20 21
Moths on the increase
While there is clear evidence of decline among Particularly interesting are species that were
Britain’s larger moths over the past 50 years, a formerly highly restricted in their British
substantial number of species have bucked the distribution, but have expanded into many new
Keith Tailby
trend; a modest 10% of species had statistically areas. Devon Carpet Lampropteryx otregiata and
significant increases in abundance, but 37% had Jersey Tiger Euplagia quadripunctaria, for
significant, positive distribution trends. example, were historically restricted to south-west
Coronet Craniophora Britain, while Webb’s Wainscot Globia sparganii
ligustri: 220% Some of the most rapidly increasing species are was principally a coastal species.
increase in recent colonists, such as Cypress Carpet Thera
abundance cupressata, which was first recorded in Sussex Tables 3 and 4 show the 30 species with the
(1968–2017) and in 1984, and White-point Mythimna albipuncta, greatest rates of abundance and distribution
54% increase which became established in the 1980s, or increase (measured as rates of change over an
in distribution immigrant moths (e.g. Gem Nycterosea obstipata). average 10-year period so that species with
(1980–2016). Most, however, are long-term resident species trends of different durations can be compared).
that have undergone dramatic increases Total rates of change over the whole time period
in abundance and/or distribution over assessed are given elsewhere in the text but
recent decades. always with the full date period shown.
TABLE 3
Thirty species of larger moths with the highest (statistically significant) rates of increase in abundance measured over an average 10-year period.
Species Abundance trend
Average 10-year
% change
Buff Footman Eilema depressa 237 Green Carpet Colostygia pectinataria 31
Least Carpet Idaea rusticata 131 Double-striped Pug Gymnoscelis rufifasciata
31
Orange Footman Eilema sororcula 115 Peacock Moth Macaria notata 30
Dingy Footman Eilema griseola 110 Satin Beauty Deileptenia ribeata 30
Spruce Carpet Thera britannica 92 Blair’s Shoulder-knot Lithophane leautieri
28
Straw Dot Rivula sericealis 64 Rosy Footman Miltochrista miniata 28
Small Rufous Coenobia rufa 49 Juniper Carpet Thera juniperata 28
Red-green Carpet Chloroclysta siterata
45 Copper Underwing Amphipyra pyramidea 27
Treble Brown Spot Idaea trigeminata 44 Vapourer Orgyia antiqua 27
Broad-bordered Yellow Underwing 43 Grey Shoulder-knot 26
Noctua fimbriata Lithophane ornitopus
Devon Carpet Lampropteryx otregiata 40 Lesser Cream Wave Scopula immutata 25
Scarce Footman Eilema complana 38 Dwarf Cream Wave Idaea fuscovenosa 25
Dotted Chestnut Conistra rubiginea 36 Coronet Craniophora ligustri 24
Oak Nycteoline Nycteola revayana 32 Clay Triple-lines Cyclophora linearia 20
Dingy Shell Euchoeca nebulata 32 Black Arches Lymantria monacha 19STAT E O F B R I TA I N ’ S L A R G E R M OT H S 2 0 2 1 | B U T T E R F LY - C O N S E R VAT I O N . O R G | 17
TABLE 4
Thirty species of larger moths with the highest (statistically significant) rates of increase in distribution measured over an average 10-year period.
Species Distribution trend
Average 10-year
% change
Cypress Carpet Thera cupressata 273 Humming-bird Hawk-moth 35
Macroglossum stellatarum
Marsh Oblique-barred 137
Hypenodes humidalis Old Lady Mormo maura 33
Jersey Tiger Euplagia quadripunctaria 119 Edinburgh / Freyer’s / Mere’s Pug 33
Eupithecia intricata
Orange Footman Eilema sororcula 66
Blair’s Shoulder-knot Lithophane leautieri
32
Buff Footman Eilema depressa 58
Dotted Chestnut Conistra rubiginea 32
Webb’s Wainscot Globia sparganii 52
Black Arches Lymantria monacha 32
Red-green Carpet Chloroclysta siterata 49
Golden-rod Pug Eupithecia virgaureata 32
Cream-bordered Green Pea 45
Earias clorana Gem Nycterosea obstipata 31
Spruce Carpet Thera britannica 45 Maiden’s Blush Cyclophora punctaria 30
Scarlet Tiger Callimorpha dominula 44 Straw Dot Rivula sericealis 27
Pinion-streaked Snout 42 Burnet Companion Euclidia glyphica 27
Schrankia costaestrigalis
Vine’s Rustic Hoplodrina ambigua 26
Festoon Apoda limacodes 39
Treble Brown Spot Idaea trigeminata 25
White-point Mythimna albipuncta 39
Scarce Footman Eilema complana 24
Six-spot Burnet Zygaena filipendulae 37
Varied Coronet Hadena compta 24
Dingy Footman Eilema griseola 37
Patrick Clement
Iain H Leach
Black Arches Lymantria monacha: 161% increase in Dotted Chestnut Conistra rubiginea: 439% increase in abundance
abundance (1968–2017) and 307% increase in distribution (1968–2017) and 124% increase in distribution (1990–2016).
(1970–2016).1 8 | B U T T E R F LY - C O N S E R VAT I O N . O R G | STAT E O F B R I TA I N ’ S L A R G E R M OT H S 20 21
RED-GREEN CARPET Pre-2000
Chloroclysta siterata New squares
653% abundance (1968–2017) 2000–2016
667% distribution (1970–2016)
Red-green Carpet has fared
extremely well in Britain over
Peter Maton
recent decades. Its abundance
started to increase rapidly at RIS
sites from the early 1980s and
the moth has been recorded
much more widely across 2000
Britain, particularly this century. 1000
This is predominantly a
ABUNDANCE INDEX
500
woodland species, using a wide
range of broadleaved trees as
200
larval foodplants, but it also
occurs in more open places 100
including gardens. 50
1970 1980 1990 2000 2010
YEAR
DOUBLE-STRIPED PUG Pre-2000
Gymnoscelis rufifasciata New squares
151% abundance (1986–2017) 2000–2016
165% distribution (1970–2016)
Pug species were not assessed in
the previous State of Britain’s
Patrick Clement
Larger Moths reports, but some,
such as Double-striped Pug, have
undergone major changes over
recent decades.This species,
which occurs in a wide range of 2000
habitats from gardens to upland
moors, has increased in 1000
ABUNDANCE INDEX
distribution, particularly in
Scotland and northern England. 500
It has also become regularly
double-brooded in the north 200
and partially triple-brooded in
the south, which will have 100
contributed to the large increase
1985 1990 1995 2000 2005 2010 2015
in abundance. YEAR
These plots show the annual abundance indices (blue points
and line) and their 95% confidence intervals (blue shading)
and the trend (bold red line) and its 95% confidence intervals
(pale red lines). The grey horizontal line shows the average
annual abundance index across the entire time period.
The vertical axis is on a log scale.STAT E O F B R I TA I N ’ S L A R G E R M OT H S 2 0 2 1 | B U T T E R F LY - C O N S E R VAT I O N . O R G | 19
SPREADING NORTH
The distributions of larger moth species that
reach a northern limit to their range within
Britain have, on average, expanded northwards at
an increasing rate since the 1960s60. Using NMRS
data, we re-examined range margin shifts over
recent years, using only heavily recorded 10km
squares to minimise bias caused by variation in
recording effort61. Of 487 larger moth species
with sufficient data and the potential to spread
northwards, the mean range margin change was
a northward shift of 5.1km per year over the
Patrick Clement
period 1995–2016 (Fig. 7). In all, 346 species
(71% of the total) had statistically significant
rates of northward expansion.
Devon Carpet Lampropteryx otregiata has undergone a rapid range expansion from
south-west Britain northwards to reach southern Scotland. Its northern range margin
has shifted northwards at 16km per year (1995–2016). The distribution of this moth
has more than doubled (118% increase 1980–2016) and its abundance increased
greatly (526% increase 1968–2017).
Figure 7 Annual rates of
latitudinal shifts in the
northern range margins of
487 larger moth species
in Britain and the Isle
of Man (1995–2016).
Statistically significant
150 trends are shown as a
darker shade and
non-significant trends
as a lighter shade.
NUMBER OF SPECIES
Positive values equate
to northwards shifts,
negative values to
100
southward shifts.
The mean response was a
northward shift of 5.1km
per year (red line).
50
0
-70 0 10 20 30
RANGE MARGIN CHANGE (KM/YR)
60 Mason et al. 2015
61 Our methodology followed Macgregor et al. 2019a. Only data from 501 heavily recorded 10km squares were included in the analysis and species
were excluded if they had been recorded in 200m (as upland species might shift uphill rather than north).
The northern range margin of each species was calculated each year as the mean latitude of the 10 most northerly occupied squares.2 0 | B U T T E R F LY - C O N S E R VAT I O N . O R G | STAT E O F B R I TA I N ’ S L A R G E R M OT H S 20 21
FOOTMEN MARCH ON
Previous State of Britain’s Larger Moths reports have the historical distributions of four footman species up to
highlighted the large increases in abundance of many of 1999 and the new 10km squares where the species has
the footman species, which have larvae that feed on been recorded for the first time from the year 2000
lichens and algae.These trends have continued and the onwards. The total increases in distribution are:
assessment of distribution change shows that they have Red-necked Footman Atolmis rubricollis 66% increase
also expanded their ranges greatly in recent decades, (1990–2016), Buff Footman Eilema depressa 524%
probably in response to reduced air pollution and (1980–2016), Dingy Footman E. griseola 391% (1970–2016)
climate change (see p.26).The maps below show and Orange Footman E. sororcula 330% (1990–2016).
RED-NECKED FOOTMAN BUFF FOOTMAN
Pre-2000 Pre-2000
New squares New squares
2000−2016 2000−2016
DINGY FOOTMAN ORANGE FOOTMAN
Pre-2000 Pre-2000
New squares New squares
2000−2016 2000−2016You can also read