THE SUCCESSFUL STRESS TEST OF EUROPE'S POWER GRID - MORE AHEAD - DMS
←
→
Page content transcription
If your browser does not render page correctly, please read the page content below

Solar Eclipse March 2015:
The successful
stress test of Europe’s
power grid –
more ahead
Policy Brief • 15 July 2015
On 20 March the European electricity grid passed with flying colours an unprec-
edented stress test. No one had experienced the effects on the grid of a near to
total solar eclipse taking place on a mostly sunny weekday morning with about
90 g
igawatts of solar power installed and highly concentrated in some regions.
This was not just a Europe’s first. It was a world’s first.
~~ Solar Power
Europe
European Network of
Transmission System Operators
for Electricity entso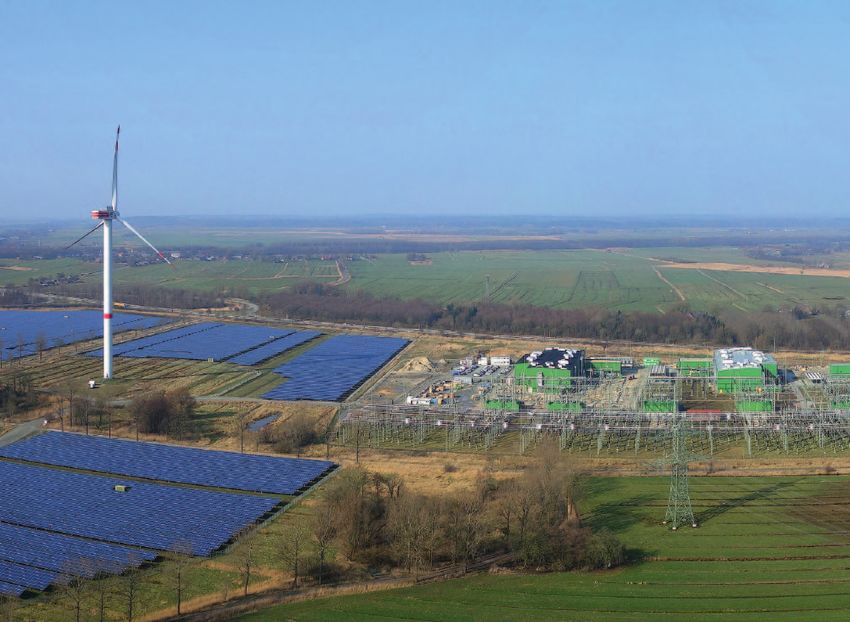
Contents
Executive summary                                                                                                 3
Part 1: The 2015 power stress test passed                                                                         5
		     Executive Summary                                                                                          5
		     1. Forecast analysis                                                                                       6
			1.1 Continental Europe                                                                                         6
			1.2 Nordic                                                                                                     8
			1.3 Great Britain                                                                                              9
		     2.	Preparations and Coordination of TSOs ahead and during the solar eclipse                             10
		     3. PV Generation on 20 March 2015	                                                                       13
		     4. Frequency Quality during the eclipse	                                                                 15
		     5. Summary and Conclusion                                                                                17

Part 2:	Connecting more sun – ready for 2021 and 2026                                                           19
		 Introduction	                                                                                                19
		     1. The key ingredients of an eclipse-proof power grid	                                                   21
			       1.1 Network codes are the first part of the answer	                                                   21
			       1.2 Regional security coordination provides the second	                                               22
			       1.3 Customers hold the keys	                                                                          22
			       1.4 Empowered PV can contribute to the solution                                                       23
			       1.5 Europe’s electricity New Frontier	                                                                24
		     2. The way forward	                                                                                      25

Annex:	Role of network codes for renewable integration                                                          27

                                                     ENTSO-E / SolarPower Europe – Solar Eclipse March 2015 Policy Brief   |   2
Executive summary
Solar eclipses occur all the time, all over the globe. In the traditional generation
mix with fossil fuels, they were not a big deal for power system operators. This
changed with the increasing share of solar generation. An eclipse is thus a
button ‘off’ for solar, taking huge amounts out of the system, within seconds.
For power systems where every second needs to be in perfect balance as power
moves at the speed of light, very high variations in solar generation that take
place during an eclipse are indeed a challenge. The 20 March 2015 solar eclipse
was thus first of its kind event; a true stress test, passed successfully.
For the first time, a near-total solar eclipse was going problematic regions, as a result of their huge share of
to take place on a sunny week day morning over a PV in the mix.
territory with 90 gigawatts of installed solar panels
which were highly concentrated in some regions. No This stocktaking exercise, looking at the variety of
power grid had previously experienced this combina- options and measures taken in the various countries,
tion of a large-scale solar eclipse and large quantities is thus very useful as it allows us to identify the in-
of PV. gredients of success. It helps us to both learn and to
prepare better for the next event, at which the share
Despite the unprecedented risk, Europe kept switched of solar power is projected to be three times higher
on throughout the three hours the eclipse lasted. than today!
In the first part of the this report, which has been
elaborated by ENTSO-E, you will learn in detail
what happened on this very special morning for
the power sector, as if you had been in the control Photovoltaics ( PV ) is today, after hydro
room yourself. You will read how a first-of-its kind and wind power, the third most important
pan-European teleconference, with updates on the renewable energy source in terms of glob-
state of the grid every 15 minutes, kept the double- ally installed capacity. Germany, Italy and Spain
sized control rooms in constant communication. You represent 78 % of the total ENTSO-E solar gen-
will learn how, with regional security coordination eration ( 91 TWh ).
centres where one could monitor on screen the effects
of the eclipse on the system, grid operators were able
to complement their data with essential information In the second part, which has been elaborated
from their neighbours. The integration of renew- jointly by ENTSO-E and SolarPower Europe, the
able and often decentralised generation requires the report deep dives into the future: 2021 and 2026
teaming up of regional and pan-European TSOs and are the next large-scale European eclipses. This fu-
their stakeholders. And you will also understand that ture must include European and regional cooperation
not all regions in Europe are exposed the same way: so as to diminish costs to customers and to ensure
Southern Germany and Northern Italy were the most reliable power supplies all across our continent. We
ENTSO-E / SolarPower Europe – Solar Eclipse March 2015 Policy Brief | 3
single out that major efforts have to be undertaken in   This joint report sheds light on the fact that stronger
five areas: adoption and implementation of network       cooperation between grid operators, distribution
codes, regional cooperation, empowerment of cus-         and transmission services, and PV generators is es-
tomers, smartening of grids to accommodate system        sential to secure power supplies. This way we ensure
services provided by PV and the link up of retail and    system safety but also serve active customers, who
wholesale, of distribution and transmission.             should participate in all markets and start to use PV
                                                         massively all across Europe. For empowering the cus-
                                                         tomer we need smarter grids, proper data handling
                                                         and an enhanced interface between distribution and
                                                         transmission.

                                                                                                                   s
                                                                                                          ∆ T = +67.6
     C   HM Nautical Almanac Office                                                                   o
                                                                               Globe centred on E 8.9 and N 55.2
                                                                                                                        o

                                                          ENTSO-E / SolarPower Europe – Solar Eclipse March 2015 Policy Brief   |   4
part 1:
The power Stress test
passed
Introduction
On 20 March, a solar eclipse took place affecting Continental Europe.
The eclipse started at 08:01, in the western part of Portugal and ended at
11:58 in the eastern part of Romania.
The ENTSO-E community launched several actions were asked to analyse the impact and make a solid
internally to be prepared for this phenomenon. plan to handle the eclipse. For Continental Europe
A study was performed by the ENTSO-E Subgroup the subgroup Coordinated System Operations formed
System Protection and Dynamics ( SG SPD ). Its task a taskforce ( TF ) that looked at the countermeasures
was to analyse the effects this eclipse could have on that could be useful during the eclipse.
the grid in Continental Europe. Other regional groups
This report addresses the following issues related
to the solar eclipse:
• Summary of the forecast analysis
• Preparations and Coordination of TSOs in advance
and during the solar eclipse
• PV feed-in on 20 March 2015
• Frequency behaviour that was observed during the
eclipse timeframe.
s
∆ T = +67.6
C HM Nautical Almanac Office o
Globe centred on E 8.9 and N 55.2
o
Figure 1: Solar Eclipse trajectory 20 March 2015
ENTSO-E / SolarPower Europe – Solar Eclipse March 2015 Policy Brief | 58%
0
4%
0
84 GW
0
2000 1. Forecast analysis
2005 2010 2015 2020 2025 2030
Historical data High scenario Accelerated 2020 (8 %) - “Connecting the Sun” Accelerated 2030 (15 %) - “Connecting the Sun”
Low scenario Baseline 2020 (4 %) - “Connecting the Sun” Baseline 2030 (10 %) - “Connecting the Sun”
National targets (NREAPs) 2020 (2.4%)
1.1 Continental Europe
In 2015 the installed capacity of PV in the synchro- the eclipse, the most important expected challenge
nous region of Continental Europe was estimated at was the decrease of generation by 20 GW within 1
approximately 89 GW. The analysis in advance of the hour, and the increase of generation by almost 40
solar eclipse showed that the influence of the eclipse GW after the maximum impact of the eclipse.
might potentially cause a reduction of the PV feed-in
by more than 34 GW in case of clear sky conditions Figure 2 shows a comparison of expected feed-in from
in Continental Europe ( see figure 2 ). Together with solar on 20 March in case of clear sky conditions, with
weather experts, the TF estimated the power gradient and without solar eclipse. Note that the x-axis is in
to be 2 to 4 times higher than normal daily PV ramp- UCT time. Figure 3 shows the amount of installed PV
ing. This situation could have posed serious chal- generation and the estimated impact on PV feed-in
lenges to the regulating capability of the intercon- during the eclipse per European country
nected power system in terms of available regulation
capacity, regulation speed and geographical location
of reserves. Beyond the lower PV generation during
MW
60,000
50,000
40,000
30,000
20,000
10,000
0
08:00 08:30 09:00 09:30 10:00 10:30 11:00
Clear sky Solar eclipse Difference Time – UTC
Figure 2: Comparison of expected feed-in from solar on 20 March during clear sky conditions with and without solar eclipse.
ENTSO-E / SolarPower Europe – Solar Eclipse March 2015 Policy Brief | 6Since the study results of the SG SPD was that the flows. It was pointed out that first level of responsi-
solar eclipse would not cause a dynamic effect on bility to handle solar eclipse issues is on the TSOs
the grid, the operational TF Solar Eclipse focussed on with PV installations ( i. e. Germany, Italy, Spain, etc. ).
quasi-static behaviour and the gradient of changes of The solar eclipse led to a strong coordination of
PV generation ( within minutes ). measures aimed at keeping TSOs ACE close to zero
in real-time, so additional needs of coordination were
The input of the operational TF was the basis for all required in the operational planning phases and in
further analysis and defined the bundle of counter- real-time to avoid frequency deviations outside the
measures that could be taken by central European 200 MHz band in order to avoid the risk of disconnec-
TSOs to cover solar eclipse effects on frequency and tion of dispersed generationFI( ref. to chapter 3 ).
NO
SE
EE
LV
IC: 0.6 DK
▼: 0.07
LT
IC: 1.2
IC: 3.2
NL
▼: 0.4 DE PL
BE
IC: 39.7
▼: 10.2 IC: 2.1
LU ▼: 0.7 CZ
IC: 0.5 SK
FR ▼: 0.15
IC: 0.9
IC: 5.4 IC: 0.8
CH ▼: 0.2 AT ▼: 0.15 IC: 0.05 HU
▼: 0.6 RO
▼: 0.015
IC: 0.3
IC: 18.8 ▼: 0.07 HR IC: 1.3
▼: 2.7 SI ▼: 0.2
IC: 0.4
IC: 0.4 BA RS
▼: 0.08
ES IT BG IC: 1.1
ME
PT IC: 4.6
▼: 0.8 MK
GR
IC: 2.5
▼: 0.5
Figure 3: Continental Europe installed PV capacity in GW ( IC ) and estimated eclipse impact ( x GW drop )
ENTSO-E / SolarPower Europe – Solar Eclipse March 2015 Policy Brief | 71.2 Nordic
In November 2014, the RG Nordic ( RGN ), including not be jeopardized. The Nordic system would then
TSO from DK East, FI, NO and SE, established a work- be in a position to help re-energize CE. Based on dy-
ing group to ensure Nordic measures and commu- namic power system analyses, the capacities given
nication concerning the operational handling of the to the market ( ATCs ) were 800 MW import to and
solar eclipse on 20 March. As the Nordic region would 3,500 MW export from NSS towards CE. All automatic
not itself be significantly affected by the reduction in supporting functions on the interconnections were in
photovoltaic ( PV ) power production, the focus was operation to be able to supply a possible imbalance in
on investigating the level of Nordic regulation flex- Continental Europe.
ibility that likely would be available to support Conti-
nental Europe ( CE ), and maintaining communication The exchange between the Nordic region and Conti-
with neighbouring CE TSOs. nental Europe was southbound on the HVDC-inter-
connectors during the event, and was to some extent
In the days leading up to the eclipse it became clear affected by the limitations on the interconnectors,
that the CE TSOs did not have to rely on Nordic which lead to some price differences between the ar-
regulations for balancing their systems during the eas. The HVDC-interconnectors experienced the most
event. Instead, RGN was encouraged to limit the limitations in the northerly direction, but this had no
exchange between CE and the Nordic synchronous impact on the market.
system ( NSS ) to a level where, in the unlikely event
of a blackout in CE, the Nordic system security would
g
I
ENTSO-E / SolarPower Europe – Solar Eclipse March 2015 Policy Brief | 81.3 Great Britain
Forecasts for Great Britain ( GB ) assumed demand The loss of embedded PV generation caused around
suppression due to people watching the event. During 1 GW of demand increase, around 200 MW higher
the partial eclipse in August 1999 there was a 3 GW than forecast. The overall forecast error on the day
drop in demand over the eclipse. Forecasts for 2015 was high, but not exceptional for a normal day.
assumed 40 % of the 1999 effect ( see figure 4 ), based
on the level of media interest and weather forecasts The demand increase was well dealt with by the con-
for the day. In the event, flattening of the demand trol room in real time using pumped storage. Plans
curve at peak suggests a small demand suppression of for the event had ensured that maximum possible
around 10 % of the 1999 effect. In addition, there was pumped storage was available over the eclipse,
around 1,300 MW of demand increase, predominantly and this was utilised as planned. At one point all six
due to the increased lighting load due to the duller Dinorwig machines were generating at the same time,
weather. It is interesting to note the lag at the end which is unusual.
of the event as people seem very slow to turn the
lights off again. Wind generation during the eclipse dropped by
around 10 % ( 500 MW ), as forecast, due to the fall in
Weather during the eclipse turned out very dull and wind speeds associated with eclipses.
overcast over much of the country, particularly in
London and the South East. This resulted in the
eclipse not being visible over most of the population
centres, and so limited public interest on the day.
GW
45,000
44,000
Additional Lighting Load
43,000
People slow to
42,000
turn lights off
41,000
40,000
39,000
38,000
37,000
36,000
35,000
07:00 07:20 07:40 08:00 08:20 08:40 09:00 09:20 09:40 10:00 10:20 10:40 11:00
Normal Day Lost PV Lost Embedded Wind Actual Demand Demand Suppression as people go out to watch Time – CET
Figure 4: Expected demand of load in GB on 20 March 2015
ENTSO-E / SolarPower Europe – Solar Eclipse March 2015 Policy Brief | 92. Preparations and Coordination
of TSOs ahead and during the
solar eclipse
Due to different sizes of TSOs, and to different national regulations, TSOs had
to evaluate and to confirm both on national ( with regulator and ministries, DSOs,
power plants ) and European level ( with other TSOs ), their individual needs of
measures, and the feasibility to activate different measures.
Because of the large amount of PV installed, Italian responsible parties, power plants etc. ) to evaluate and
and German TSOs were the most affected in relation confirm measures that were taken by TSOs on short
to their normal levels of available reserves. Other request and/or reserved with predefined lead-time for
countries had to handle solar eclipse effects in the activation.
range of more common changes in the level of PV in-
jections, and of power plants connection/disconnec- The following measures were implemented by
tion. Terna and the German TSOs worked on national TSOs so that they had the ability to handle the
level with all stakeholders ( regulator, DSOs, balancing effects of the solar eclipse:
measures implemented by TSOs
• Higher Reserves: Some of the TSOs did increase • The TSO Terna ( Italy ) has reduced the to-
their amount of primary, secondary and tertiary tal NTC on the northern border of Italy to
control reserves to be better able to keep their 1,000 MW.
Area Control Error ( ACE ) close to zero.
• In real-time operation, some TSOs have used
• All TSOs had stated that they would keep their strategic pump storage power plants.
individual ACE close to zero in real-time ( i. e.
faster than 10 to 15 minutes ). • According to the German Renewable Energy
Act, German TSOs have to market the renew-
• Strategic use of pump storage power plants to able feed-in via the power exchange. German
have more control during the eclipse for chang- TSOs successfully marketed the forecasted
es in the grid due to the change in PV. amount of PV at the quarterly hour market. This
ensured that the German TSOs only needed to
• The German TSOs had procured approximately
ensure that they could handle the difference
double the amount of reserves in comparison to
between the quarterly hour market and the real
normal operation ( see table ).
feed-in with high gradient in real-time.
• The German TSOs established a special op-
• The TSO Terna (Italy) had a preventive decrease
erational concept for activation of reserves and
of planned PV production in the day-ahead mar-
emergency reserves during the solar eclipse.
ket of around 4,400 MW; equivalent to installed
capacity shutdowns between 7:00 am till 2:00 pm.
ENTSO-E / SolarPower Europe – Solar Eclipse March 2015 Policy Brief | 10measures implemented by TSOs ( continued )
• All TSOs had agreed to have as little as possible • RG CE SG CSO Telco: A back-up Telco among
planned outages in their grid during the time of managers of system operation took place during
the solar eclipse. This measure offered the best the solar eclipse in order to have a permanent
possibility to have a strong and well-meshed platform to coordinate bilateral or multilateral
system to cover possible load flow deviations measures if needed.
and was already implemented in annual opera-
tional planning coordination. • Extra training of control room operators and
exercises on coordination procedures were set
• Capacity on the HVDC cables was reduced by up especially for this event.
between 18 % and 50 % for the Nordic, UK and
CE regions. This ensured synchronous area’s to • A lot of TSOs organized the control room with
extra operators during the event.
be more independent of each other.
• TSOs raised awareness and informed market • Some TSOs went into preventive activation of
crisis policy, in line with their national crisis
players, i.e. balancing responsible parties and
organization.
Distribution System Operators ( DSOs ) on the
responsibility they had during the eclipse. • There was continuous communication between
control rooms in CE and the Nordic system dur-
• An operational teleconference called “RG CE
ing the eclipse, if the need for supportive power
real-time frequency monitoring Telco” was held
in CE should occur.
among the five TSOs of the frequency-monitor-
ing group ( Amprion, REE, RTE, Swissgrid, Ter-
na ). This Telco is normally started if frequency
deviation exceeds predefined values. For the
solar eclipse this Telco was in place during the
entire solar eclipse to avoid any extra time that
would otherwise be needed to start it.
The table on page 12 gives an overview of available • For Italy the costs of the additional downward/
positive and negative individual TSO reserves and ad- upward reserve ( secondary and tertiary reserves )
ditional reserves procured due to the solar eclipse or during solar eclipse: approx. 140 kEuro
available via normal balancing. These values are either
estimated or correct values. • For Germany the cost of additional control power
procurement: approx. 3.6 MEuro.
A part of these reserves have been especially procured • For Czech Republic the cost of additional control
by the TSOs to face the exceptional event of the power procurement: approx. 215 kEuro.
eclipse. Depending on national mechanisms for re-
serve procurement and pricing, costs of such procure- • For Netherlands the cost of additional control
power procurement: approx. 150 kEuro.
ments can be different from one country to the other,
and can’t be compared. The costs indicated below • For France, the cost of an additional downward/
are those the TSOs had to face for reserve power. It upward reserve ( primary and secondary reserves )
should be noted at once that the disconnection of PV during solar eclipse: approx. 40 kEuro.
during the eclipse has resulted in higher power prices
during that period.
ENTSO-E / SolarPower Europe – Solar Eclipse March 2015 Policy Brief | 11Available total upward / Available total downwards /
positive TSO reserves negative TSO reserves
( primary, secondary, Additional upward / positive ( primary, secondary, Additional downwards /
tertiary, others ) TSO reserves for solar tertiary, others ) negative TSO reserves for
including additional eclipse ( primary, second- including additional solar eclipse ( primary,
reserves for solar eclipse ary, tertiary, others ) reserves for solar eclipse secondary, tertiary, others )
TSO / Country ( ( MW ) ( MW ) ( MW ) ( MW )
Austria 500 0 395 0
Belgium 1,227 0 223 0
Bosnia 250 0 0 0
Bulgaria 300 0 196 149
Croatia 180 0 360 0
Czech Republic 1,658 411 868 308
Denmark 0 0 200 500
France 5,500 1,500 10,000 1,500
Germany 9,675 4,920 8,975 3,854
Great Britain 1,100 200 750 200
Greece 600 400 300 300
Hungary 800 250 160 150
Italy 6,863 1,966 9,348 4,937
Netherlands 1,135 450 335 0
Poland 2,916 0 4,818 0
Portugal 850 100 1,000 0
Romania 1,500 700 1,500 1,000
Serbia 700 0 1,000 0
Slovakia 941 100 579 73
Slovenia 420 0 250 0
Spain > 3,500 1,500 > 5,000 0
Switzerland 800 0 800 0
Turkey 5,500 200 5,300 200
ENTSO-E / SolarPower Europe – Solar Eclipse March 2015 Policy Brief | 123. PV Generation on 20 March 2015
Figure 5 shows the aggregated PV feed-in during the solar eclipse from a subset
of European TSOs who could provide data on a quarter hourly basis. The ex-an-
te analysis showed that in case of clear sky conditions, the PV feed-in could be
higher than as shown here.
The estimated PV injection at the start of the eclipse The table on page 14 gives an overview of influence of
( approx. 09:30 CET ) was approx. 22 GW. During the the solar eclipse on the PV feed-in of European TSOs.
maximum of the solar eclipse at 10:00 CET the feed-in For some TSOs this is an estimate and for others this
decreased to approx. 14 GW. The estimated PV injec- is not known due to the low amount of installed PV
tion at 12:00 CET was 35 GW. Hence the change in capacity in their grid.
injection between 10:30 and 12:00 was approx. +21 GW.
MW
40,000
35,000
30,000
25,000
20,000
15,000
10,000
5,000
0
00:15 01:45 03:15 04:45 06:15 07:45 09:15 10:45 12:15 13:45 15:15 16:45 18:15 19:45 21:15 22:45
Germany Italy Greece Spain France Bulgaria Belgium Portugal Time – CET
Figure 5: Aggregated PV feed-in from a subset of European TSOs
( Sources: Amprion, TenneT TSO GmbH, 50Hertz, TransnetBW, Terna, IPTO, REE, RTE, ESO, Elia and REN )
ENTSO-E / SolarPower Europe – Solar Eclipse March 2015 Policy Brief | 13A ) Estimated installed solar capacity in March 2015 ( MW )
B ) Estimated PV injection ( MW ) / PV generation before the eclipse ( approx. 09:30 CET )
C ) Estimated injection with full solar eclipse ( MW ) / PV generation at the maximum of eclipse ( approx. 10:30 CET )
D ) Day-ahead forecast value for PV generation at 12:00 CET ( MW )
E ) Estimated real PV injection at 12:00 CET ( MW )
F ) Estimated max. change in injection from 10:30 to 12:00 CET ( MW )
G ) Impact on consumption ( if known ) ( MW )
TSO / Country A ) B) C ) D ) E) F ) G ) Comment
Austria 750 308 150 400 400 250 0 Weather as predicted
Belgium 2,916 293 81 1,650 519 438 0 Weather was cloudier than forecast
Bosnia 0 0 0 0 0 0 0 Unknown
Bulgaria 1,039 321 381 437 455 74 0
Croatia 400 17 12 0 20 8 0
Czech 2,282 1,260 500 1,540 1,540 1,040 0 Clear weather
Republic
Denmark 600 65 10 0 110 100 0 Cloudy weather
France 5,300 880 650 2,300 1,900 1,250 1,000 Weather was cloudier than forecast
Germany 37,268 13,200 6,200 22,000 21,000 15,000 - 2,500 Weather cloudier then expected
( high fog in North-West Germany )
Great Britain 4,640 542 583 1,820 1,450 870 1,000 Cloudy weather reduced impact of
PV reduction
Greece 25,000 1,100 650 0 1,290 640 0 Weather was sunny as forecasted
Hungary 50 20 20 0 40 20 0 Weather was sunny as forecasted
Italy 18,856 6,718 4,340 7,500 9,653 5,313 0 Sunny day with some clouds in the
north ( Alps region )
Luxembourg 0 0 0 0 0 0 0 Unknown
Netherlands 1,200 600 200 0 600 400 0 Weather very foggy no solar eclipse
visible in the NL
Poland 7 0 0 0 0 0 0 Installed capacity 7 MW;
no measurement or forecast
Portugal 400 60 50 0 160 110 0 Estimated values
Romania 1,300 456 248 0 346 98 200
Serbia 0 3 2 0 4 2 0
Slovakia 500 294 145 0 350 205 100 Weather was sunny as forecasted
Slovenia 266 117 67 140 122 111 0 Estimated values, real data available
in D+1
Spain 4,600 580 285 0 1,350 1,065 0 Weather has been cloudier than
forecast
Switzerland 800 180 80 0 335 255 600 Cloudier than forecast
Turkey 0 0 0 0 0 0 0 Cloudy weather in most of Turkey.
Limited amount of installed PV
ENTSO-E / SolarPower Europe – Solar Eclipse March 2015 Policy Brief | 144. Frequency Quality during
the eclipse
During normal operation, frequency has to be managed within an acceptable
range of ± 50 mHz, called standard frequency range1 ).
The following limits are also monitored on real-time • 49 Hz is the frequency leading to automatic load
operation in order to avoid wide area incidents caused shedding. Pump load shedding shall start over that
by frequency disturbances: limit.
• Some generators start disconnecting at 50.5 Hz. The evolution of system frequency 3 ) between
However, 50.2 Hz is the frequency leading to 08:00 and 12:00 is presented in the following
automatic Disconnection of PV generation in diagram:
some zones 2).
Hz
50.06
50.04
50.02
50.00
49.98
49.96
49.94
49.92
08:00 08:30 09:00 09:30 10:00 10:30 11:00 11:30 12:00
Frequency Time – CET
Figure 6: Frequency evaluation between 08:00 CET and 12:00 CET of Continental Europe
The frequency quality during the eclipse timeframe ( between - 49.968 Hz and 50.048 Hz ), therefore at
was very good. The maximum absolute frequency no point the acceptable range of ± 50 mHz was
deviation from the set point observed was 48 mHz exceeded.
1)
Frequency measurement from Swissgrid SCADA with 1 second granularity.
2)
A large amount of PV installed capacity was initially tuned for automatic shedding at 50.2 Hz. A wide retrofitting campaign was performed since
2011 in order to avoid this technical specification, mainly on German and Italian areas. On German area 4 GW of PV installed capacity remains not
retrofitted. For Italy the completion of retrofitting will be fulfilled in 2015
3)
Cf. Network Code on Load-Frequency Control and Reserves, Chapter 3 Frequency Quality, Article 19 Frequency quality target parameters
ENTSO-E / SolarPower Europe – Solar Eclipse March 2015 Policy Brief | 15The GB system is much smaller than the Continental Frequency was well controlled throughout the event,
European system, and so routinely experiences larger only briefly exceeding operational targets at 0800 CET.
frequency fluctuations. Statutory frequency limits
are ± 0.5 Hz, and operational standards allow 1,500
excursions per year outside the operational targets of
± 0.2 Hz.
Hz
50.3
50.2
50.1
50.0
49.9
49.8
49.7
08:00 08:30 09:00 09:30 10:00 10:30 11:00 11:30 12:00
Frequency Time – CET
Figure 7: Frequency evaluation between 08:00 CET and 12:00 CET in Great Britain
4
Cl
,I
~l
~Ill~ ~
~ 5
1
~~i'~
ENTSO-E / SolarPower Europe – Solar Eclipse March 2015 Policy Brief | 165. Summary and Conclusion
The weather conditions during the solar eclipse for the western part of
Continental Europe were cloudier than the hypothesis, which resulted in less
severe impact than predicted. For Germany and Italy the conditions were still
clear sky and the eclipse impact was strong.
Due to the careful and coordinated planning of the indicates careful planning and coordination between
TSOs in advance ( from August 2014 until March 2015 ) TSOs in all operation phases will be necessary during
and thanks to a good communication before and dur- similar events.
ing the eclipse it was not necessary for TSOs to pro-
vide any assistance to each other. Even though dur- The main lessons learned are as follows:
ing this predictable event no issues occurred, it still
main lessons learned
• Controllability of PV:
As Terna successfully showed, it is possible to disconnect in advance part of the installed PV
production. This shows promising results for the future, but to use such practice on a large scale the
following needs to be taken into consideration:
• The exact amount of PV feed in that will be switched off
• Timing of switching PV off from the grid and switching PV back on to the grid
• Steps that are taken during switching PV back on to the grid
• Which retroactive effect shutdowns have on the system
• Observability of PV generation:
• A clear description of the installed PV capacity and their capabilities is needed for the accuracy of
forecast studies ( technical data, retrofitting campaign, disconnection/reconnection settings and
logics, etc. … )
• Real time measurement of the dispersed PV generation is the key for adapting the operational
strategy in real-time
• The German TSOs had instructed the power plants to keep in continuous operation,
which had a positive impact on the available control power within a quarter of
an hour.
ENTSO-E / SolarPower Europe – Solar Eclipse March 2015 Policy Brief | 17main lessons learned ( continued )
• Quarter-hour market:
• The hourly day-ahead market was mainly unaffected by the eclipse. German TSOs successfully
marketed the PV in a first step at the hourly market and in a second step at the quarter-hour
market.
• In case of high demand or supply, there is a de facto quarter hour market ( OTC and power ex-
change ) in DE, AT and CH which can provide significant contributions for intra-quarter-hourly
compensation. This solution is a fine-tune balancing done by the TSO.
• The quarter-hour market showed big spreads. A European coupling of quarter-hour markets
should contribute to increased liquidity of the market and reduce these spreads. At the same time
the quarter-hour trading should be combined with the hourly market.
• Thanks to higher amounts of reserves, all European TSOs managed to balance
themselves and to keep their individual ACE close to zero in real-time ( i. e. faster
than 5 minutes ). Nevertheless, these additional reserves have a significant cost,
and this solution must be kept for exceptional situations.
• Thanks to strong coordination and transparency in preparation for and during the
event, all the TSOs were aware of the risks and the existing remedial actions and
methods of implementation, and the availability of help from each other should the
need arise.
In the future, fast gradient changes of PV feed-in are expected due to the
increasing amount of installed PV capacity in the grids. Such events will be
a challenging opportunity for the RSCIs to provide strong support to the
TSOs in their task of guaranteeing secure and efficient operation of the
interconnected system in every critical grid condition.
ENTSO-E / SolarPower Europe – Solar Eclipse March 2015 Policy Brief | 18part 2:
Connecting more sun –
ready for 2021 and 2026
~ ~ ~ ~ ~ ~ ~ ~ ~ ~ ~ ~ ~ ~ ~ ~ ~ ~ ~ ~ ~ ~ ~ ~ ~ ~ ~ ~ ~ ~ ~ ~ ~ ~ ~ ~ ~ ~ ~ ~ ~ ~ ~ ~ ~ ~ ~ ~ ~
Introduction
Solar eclipses similar to that of 20 March 2015 will occur in 2021 and 2026.
By then, the amount of solar panels in Europe will have tripled. SolarPower Europe
foresees that in 2021, the amount of installed PV capacity would add up to
170 GW. In 2026 it would reach 250 GW.
Solar generation, which now covers 3.5 % of the EU are already below retail prices in many countries. By
demand for electricity, could cover 7 % in 2021 and 2025, large scale power system are expected to pro-
10 % in 2026 going up to 15 % by 2030. This further duce at 4 to 6 ct€/kWh, going down to 2 to 4 ct€/kWh
uptake of solar power will be supported by continued by 2050.1)
cost decreases of photovoltaics. In less than 10 years,
PV system prices have already decreased by around
75 %. Today, large-scale PV generation costs already
compare with conventional electricity production, 1)
Fraunhofer Institute for Solar Energy Systems ISE/ Agora
and the costs of solar power at the distributed level Energiewende: PV Cost Vision for 2050, 01.09.2014
ENTSO-E / SolarPower Europe – Solar Eclipse March 2015 Policy Brief | 19GW
15 %
500
400
10 %
300
8%
200
4%
100
84 GW
0
2000 2005 2010 2015 2020 2025 2030
Historical data High scenario Accelerated 2020 (8 %) - “Connecting the Sun” Accelerated 2030 (15 %) - “Connecting the Sun”
Low scenario Baseline 2020 (4 %) - “Connecting the Sun” Baseline 2030 (10 %) - “Connecting the Sun”
National targets (NREAPs) 2020 (2.4%)
EPIA, “Connecting the Sun: Solar photovoltaics on the road to large-scale grid integration”, 2012.
The percentage indicates the share of electricity demand.
Figure 8: Solar PV cumulative capacity forecast compared to SolarPower Europe’s scenarios
As described in part one, managing a solar eclipse of a significant scale with
90 gigawatts took a year’s meticulous preparation and coordination. Managing
similar eclipses in 2021 and 2026 with twice and three times as much PV in
Europe calls for change and rapid action in key areas.
ENTSO-E / SolarPower Europe – Solar Eclipse March 2015 Policy Brief | 201. The key ingredients of an
eclipse-proof power grid
In ENTSO-E and SolarPower Europe’s view progress is needed in five key
areas to keep the EU grid safe during the upcoming eclipses of 2021 and 2026:
upgraded market- and system rules, reinforced regional cooperation, active
customers, new system services provided notably by PV, and an enhanced
TSO / DSO cooperation.
1.1 Network codes are the first part of the answer
The EU network codes are setting the new rules of The RfG code especially defines important elements
the game for an electricity system that is experienc- to allow the integration of more and more decentral-
ing a vast paradigm shift. They have been drafted by ised and variable energy sources safely into the trans-
ENTSO-E following guidelines set by ACER and the mission grid. Some countries, like Italy and Germany,
Commission. have already started partial retrofit programmes of
their PV installations to make them compliant with
All codes were heavily consulted with stakeholders. In the requirements set in the code, thus concretely
mid-2015, ACER had recommended for adoption working towards greater system safety.
9 of the 10 network codes. Two, capacity alloca-
tion and congestion management ( CACM ) and the The Demand Connection Code ( DCC ) soon to enter
requirement for generators ( RfG ), have been adopted ‘comitology’ lays the groundwork for customers to
by Member States and after scrutiny by Parliament become active and have more control of when they
and Council should become binding across the EU consume electricity.1)
member states and will be implemented by all the
ENTSO-E members, which covers the EU and 6 ad- All the network codes are vital pieces of a jigsaw
ditional countries. which, when put together, will create a stronger,
more sustainable and cost-efficient power grid
for Europe and its citizens. Having all these stream-
lined rules in place is the first step to guarantee the
safe management of future solar eclipses in Europe at
the most reasonable cost for society.
1)
The annex of this report provides an extensive overview on how
network codes will play an important role to facilitate the integration
of renewables.
ENTSO-E / SolarPower Europe – Solar Eclipse March 2015 Policy Brief | 211.2 Regional security coordination
provides the second
This solar eclipse exemplified the importance of In 2015, Germany and 12 other member states signed
regional and pan-European cooperation for Europe’s the Pentalateral Forum Declaration on regional
security of supply. The good coordination of TSOs coordination of policies in electricity security of
ahead of and during the eclipse was key in getting supply. The Energy Union is also set to give a political
through the event without any interruption of power push to an already successful voluntary regional coop-
supply for consumers. As market integration pro- eration in the energy field, which led to great progress
gresses combined with the rise of variable genera- on market coupling, early implementation of pan-EU
tion, it seems more and more logical to systematise network rules, and system security as illustrated by
the regional and pan-European approach to system the Regional Security Coordination Initiatives ( RSCIs )
security. This is already foreseen by the operational such as Coreso in Brussels, SSC in Rommerskirchen,
network codes. TSC in Munich or SCC in Belgrade.
Transmission System Operators have been cooperat-
ing in regions for years. RSCIs have been pioneered
and developed pro-actively by TSOs. They offer
All-TSOs contract to regional coordination services and provide TSOs
define pan-European
coverage in 2015 with an overview of electricity flows at regional level
to complement their own system data. This enables
them to identify and manage potential threats to
secure system operations arising from large-scale,
regional power flows or from extreme natural phe-
nomenon, like solar eclipses for example. RSCIs are to
play an increasing role in the future. Up to now, three
quarters of Europe’s population is covered by an
RSCI. ENTSO-E has the objective to cover 100 % of
the population by having all of its members belong to
a RSCI by end 2015.
1.3 Customers hold the keys
Energy transition means more and more dispersed potential for system flexibility. Demand-side response
and variable generation. This calls for greater flex- ( DSR ) creates value for consumers and society by al-
ibility. Increasing power reserve is one solution but it lowing consumers to be rewarded for changing their
comes at a cost ( as illustrated in the extreme by the consumption behaviour and to therefore reduce the
case of the March 2015 solar eclipse ) and does not costs of energy. For system operators, it is a cost-
always fit with Europe’s ambition of decarbonisation. efficient way to balance their system. It optimises the
utilisation of infrastructure and investments in the
Given that domestic demand makes up 30 – 40 % of grids. The DCC network code provides a framework to
electricity use, giving consumers the opportunity to deploy DSR-ready electric appliances ( able to adjust
reduce their consumption at certain peak periods automatically their electricity consumption ).
( and save money in the process ) represents a huge
ENTSO-E / SolarPower Europe – Solar Eclipse March 2015 Policy Brief | 22In view of this great potential and this win-win situa- regardless of their connection points ( distribution or
tion for the consumers and grid operators, demand- transmission ). Being able to act on demand is another
side response should be considered on an equal foot- guarantee that the ‘power stress tests’ of 2021 and
ing with storage and generation. Consumers should be 2026 will be successful.
allowed to enter all markets and be able to aggregate
1.4 Empowered PV can contribute to the solution
As there is great potential in enabling customers to ing power ( if controllable ). Such services could po-
pro-actively participate in system security, there is tentially be extended when combining solar PV with
equally a lot of benefit in leveraging the system ser- self-consumption and battery storage. In that way, it
vices that solar power can offer to the grid. Today, would also be possible to provide positive balancing
PV can already provide some of them. For example, power as well as an increased self-regulation on con-
inverters allow solar systems to provide reactive sumption as illustrated in the Table below.
power for voltage support as well as negative balanc-
Solar PV System Size
Small scale Large scale Aggregation
Technical Aspects Procedures Technical Aspects Procedures Technical Aspects Procedures
FCR
FRR
Frequency
RR
FFR
RM
SSVC
Voltage
FRCI
Source: ReserviceS Project 2014
Procedures: Grid Code Requirements, prequalification
Technical Aspects
procedures and Network Code Requirements, amongst other
Well defined requirements / specifications in most procedures at
Implemented
european level
P artially implemented / implementable / low cost or investment to P oorly defined requirements / specifications or not addressed in
enable the required capacities most procedures
ot defined / not possible due to requirements in all or most
N
Not implemented / implementable / high cost to implement
procedures
Existing Grid Support Services New Grid Support Services
ENTSO-E / SolarPower Europe – Solar Eclipse March 2015 Policy Brief | 23The table above shows what PV can do already for
Existing frequency support services
frequency and voltage support services and what it
include:
could be doing if procedural and technical prerequi-
• Frequency Containment Reserve ( FCR ) sites were in place.
• Frequency Restoration Reserves ( FRR )
• Replacement Reserves ( RR ) Europe represents today a best in class demonstration
project for placing solar power in the energy sector.
New frequency support services refer to: The European solar PV sector is experiencing the
transition from feed-in tariffs towards a more
• Fast Frequency Response ( FFR )
market-based development framework with a
• Ramping Margin ( RM )
general move to progressively integrate solar PV in
the electricity market at wholesale and retail levels.
Voltage support services include:
• Steady Stage Voltage Control ( SSVC ) This transition is essential to steer innovative ap-
• Fast Reactive Current Injection ( FRCI ) proaches. At the same time, it needs to happen
smoothly and depends on the right market conditions,
so as to avoid destabilisation and price increases.
Much of it relies on a strong link between distribution
In the future, with all the network codes in place and
and transmission.
the right communication and measurement technol-
ogy & infrastructure, especially between distribution
and transmission, Europe will be able to use the full
potential of solar power in terms of system services.
1.5 Europe’s electricity New Frontier
A reconsidered TSO/DSO interface is a condition sine The upcoming convergence of wholesale and retail
qua none not only for the integration of PV, but for markets is one of the main challenges for European
other decentralised renewables and planning of the regulation to deal with in the next decade. This con-
system. vergence can be regarded as the New Frontier for
Europe’s power system. ENTSO-E and European
Appropriate arrangements for data management are associations of DSOs have taken action already on
also needed to ensure that TSOs, DSOs, suppliers and a voluntary basis, signing a memorandum of under-
other market participants are able to have access to standing and subscribing to an agenda of common
the required data in a timely and transparent manner. actions.
ENTSO-E / SolarPower Europe – Solar Eclipse March 2015 Policy Brief | 242. The Way forward
Taking stock of what kept the EU system eclipse-proof on 20 March 2015 is
important for preparing the future. Lessons can be drawn from this successful
power stress test. They will help prepare the European electricity system and
market to connect more sun and pass the 2021 and 2026 ‘stress tests’ with
equal success.
The key insight of this report is that those developing new generation
technologies and those operating the grid at distribution and at transmission
level have to work hand in hand. This is the message that ENTSO-E and
SolarPower Europe wanted to convey by co-signing this publication.
2015 to 2026: ingredients of preparation
Managing a high voltage power system, where there thanks to a thorough and competent preparation. But
needs to be at all times enough generation to cover managing with 250 gigawatts PV installed by 2026, the
demand, requires clear visibility and control on how date of one of the next solar eclipses to hit Europe,
much power is injected in the system. Nearly all solar requires a yet different preparedness and important
generation is connected to the distribution level. The adaptations to the system are essential. The objective
overview for transmission on these capacities is yet remains the same: security of supply at lowest cost to
limited, but has to be build up. The eclipse in March, society.
with 90 gigawatts of PV installed, has been managed,
Codes count!
The energy transition is changing the power system and demand connection codes in particular, aim
to a customer centric one, with many new opportu- to reflect this new reality of more decentralised and
nities emerging at the ‘new downstream’ side of the more variable power systems. The RfG code sets the
power sector value chain. The rules of the game have technical conditions to safely integrate large amounts
to be adapted to reflect this paradigm shift. The EU of renewables in the system. PV installations, which
network codes, and the requirements for generators are linked to the transmission grid via the distribution
ENTSO-E / SolarPower Europe – Solar Eclipse March 2015 Policy Brief | 25grid, need to have certain technical characteristics The Demand Connection Code is equally important as
that allow their safe interaction with sophisticated it is setting the conditions for the smartening of grids.
and sensitive high voltage system. Work on adapting Smarter grids mean more active customers able to
existing PV installations to the RfG requirements, for provide the system with the much-needed flexibility
example as is the case in Italy and Germany, is a con- in a cost efficient manner. Innovative and enhanced
crete step towards greater electricity security. grids will allow PV and other renewable generation to
play a greater role in balancing the system.
Network operators to team up
The linking up of retail and wholesale is where a great deal of regulatory
and policy-making effort is needed. Balancing the system can no longer
remain the sole responsibility of the TSOs; DSOs have a role to play and
regulation should allow this. The next legislative push has to be about
opening up possibilities.
ENTSO-E and SolarPower Europe …
… are equally committed to turn the challenge of more and more PV in the
system, into an opportunity. The European Commission Energy Union pro-
posal and related legislative initiatives should support their momentum and
adapt the framework so that the grid remains eclipse-proof for the next
decade to come.
ENTSO-E / SolarPower Europe – Solar Eclipse March 2015 Policy Brief | 26Annex:
role of network codes
for renewable integration
EU network codes are divided into three main categories or ‘families’ of codes:
connection, operation and market code. As the table below shows, integrating
the European electricity markets is one of the objectives that led to the drafting
of the codes. But equally as important is the integration of renewable energy
sources.
Connection codes
Requirements for RES technologies have different technical characteristics compared to the generators that have traditionally
Generators ( RfG ) connected to transmission grids and are often smaller in size. As variable production share rises, more and
more grid support services will have to be provided by renewable generators.
The requirements in RfG define what ancillary services each generator should be capable of delivering. It
does not dictate how these services should be procured or remunerated, leaving this to the market to decide.
Demand Connec- The DCC ensures that all distribution networks and demand facilities ( suppliers and customers ) contribute
tion Code ( DCC ) effectively to the stability of the system across Europe.
The DCC clarifies the role that demand response will play in increasing the proportion of energy from
renewable sources. The code specifies the basic functional requirements for electricity users who want
to feed power back into the system from small-scale renewable generation technologies.
It provides a framework for making different household appliances ‘DSR ready’ ( able to adjust their
electricity usage automatically ), making it easier for consumers to provide demand side response.
High Voltage Direct HVDC technology is used to construct interconnectors between countries ( such as the East-West Intercon-
Current Connec- nector between Ireland and Great Britain ) and to connect offshore wind farms. In the future it could form
tions ( HVDC ) part of a “supergrid” or provide long distance onshore connections, though is unlikely to completely replace
AC onshore.
The requirements in the NC HVDC will allow this to happen. Without these requirements, it would not be
possible to integrate very large amounts of renewable energy into electricity grids ( for example countries
such as Ireland and Denmark produce 50% of electricity from renewables at certain times ). Hence, the
NC HVDC ( together with NC RfG ) is critical for countries to continue to connect large volumes of renewable
energy in future.
ENTSO-E / SolarPower Europe – Solar Eclipse March 2015 Policy Brief | 27Operational codes
Operational It defines the TSO-DSO coordination framework critical due to the increasing renewable energy sources in-
Security ( OS ) stalled in DSO networks. It harmonizes the requirements for data provision from grid users ensuring secure
integration of RES; a necessary condition for increased RES penetration.
Operational OPS establishes requirements for TSOs with respect to generation forecasts and their accuracy to be em-
Planning & ployed in the operational security analysis taking into account the uncertainties introduced by RES; the
Scheduling ( OPS ) harmonization in this respect will enable more efficient coordinated operational planning and secure RES
integration.
It introduces requirements for coordinated Contingency Analysis and other relevant Operational Security
Analysis at cross border level; this guarantees security of supply in highly meshed areas of the European
grid and secure integration of RES.
The Adequacy assessment framework included in the code requires contributions of generation from RES
to be taken into account therefore early detection and resolution of issues is possible; this is critical for
increased RES penetration.
Load Frequency The code establishes the technical basis for balancing ( reserve dimensioning and activation ); it provides
Control & Reserves the necessary conditions for efficient integration of RES with market solutions that serve system needs ( by
( LFCR ) creating the correct market signals for increased flexibility from generation and demand, the RES penetra-
tion is facilitated ).
Harmonised rules for frequency control management that take into account the characteristics of RES.
The code provides the basis for further TSO coordination in optimizing their resources with respect to
balancing thus increase the potential for further secure RES integration.
Emergency and The code establishes the framework for the management of frequency deviations; it ensures efficient coor-
Restoration ( ER ) dination between the different actors and allows for increased RES penetration as the means for frequency
management are used in an optimal way.
The code sets up the rules for coordinated TSO actions for system restoration after wide area incidents;
clear roles and responsibilities are defined through which RES are efficiently managed during these events.
TSO-DSO coordination framework for emergency and restoration detailed; critical due to the increasing
RES installed in DSO networks
ENTSO-E / SolarPower Europe – Solar Eclipse March 2015 Policy Brief | 28Market codes
Capacity allocation The objective of CACM and FCA is to create the largest and most competitive electricity market in the world.
and congestion
The codes set out the rules that will enable a transition from the current system, in which there are different
management
rules for electricity market participants in different countries or regions, to a single set of electricity market
( CACM ) &
rules applied across Europe.
Forward Capacity
Allocation ( FCA ) A competitive internal electricity market will allow a wider range of companies to enter the energy market,
particularly small companies and those that invest in renewable energy sources ( RES ), and will help
guarantee that the electricity system in Europe can continue to operate effectively, notwithstanding changing
electricity generation and consumption patterns in Europe.
A key role of the forward market ( FCA ) is to provide market participants with the ability to manage the risk
associated with cross-border electricity trading. Market players are able to buy long-term transmission rights
( which come in either physical or financial forms ) which allow them to hedge price fluctuations within day
ahead markets. Long-term transmission rights facilitate cross-border trading, competition and provide effi-
cient and reliable long-term price indication. They create a sound, more stable business environment, which
will allow smaller businesses, including RES producers, to enter the market.
Electricity As variable RES keep developing, balancing the grid on real time is more and more challenging. The
Balancing ( EB ) optimisation of this system at European level is essential to keep the cost under control for consumers
across Europe.
A key part of the NC EB is that it is a first step towards a more level playing field for all potential providers
of balancing services, including demand side response and variable sources ( like wind and solar power )
by introducing standardised rules. This creates additional revenue streams for RES generators.
ENTSO-E / SolarPower Europe – Solar Eclipse March 2015 Policy Brief | 29Authors
ENTSO-E Groups Frauke Thies
on Coordinated System Operations and on Chief Policy Officer,
System Protection and Dynamics SolarPower Europe
Jan Vorrink Thomas Döring
National Control Centre Manager, Policy Analyst,
TenneT TSO B.V. SolarPower Europe
Ciska Timmerman
Process Specialist,
TenneT TSO B.V.
Nathalie Lemaître
Deputy Director National Control Centre,
RTE
Christoph Schneiders
Manager Main Control Centre Brauweiler,
Amprion
James Bradley
European Development,
National Grid
Contact
ENTSO-E aisbl SolarPower Europe
Avenue de Cortenbergh 100 Rue d ’Arlon 69 - 71
1000 Brussels – Belgium 1040 Brussels – Belgium
Tel + 32 2 741 09 50 Tel +32 2 709 55 20
Fax + 32 2 741 09 51
Fax +32 2 725 32 50
info @ entsoe.eu
info@solarpowereurope.org
www.entsoe.eu
www.solarpowereurope.org
European Network of
Transmission System Operators
for ElectricityYou can also read