The Value of Using Unofficial Measurements of Rainfall: The Dublin Storm and Flood of June 1963
←
→
Page content transcription
If your browser does not render page correctly, please read the page content below
Journal of Geoscience and Environment Protection, 2019, 7, 76-91
                                                                                                   http://www.scirp.org/journal/gep
                                                                                                            ISSN Online: 2327-4344
                                                                                                              ISSN Print: 2327-4336

The Value of Using Unofficial Measurements of
Rainfall: The Dublin Storm and Flood of
June 1963

Colin Clark

CHRS Shute Lane, Bruton, UK

How to cite this paper: Clark, C. (2019).       Abstract
The Value of Using Unofficial Measure-
ments of Rainfall: The Dublin Storm and         Rainfall measurements are vital for the design of hydraulic structures, climate
Flood of June 1963. Journal of Geoscience       change studies, irrigation and land drainage works. The most important
and Environment Protection, 7, 76-91.           source of design rainfall data comes from convective storms. Accurate as-
https://doi.org/10.4236/gep.2019.72006
                                                sessment of the storm rainfall requires a fairly dense network of raingauges.
Received: January 21, 2019                      In 1963, such a storm took place over Dublin in Ireland. However, the existing
Accepted: February 19, 2019                     raingauge network was insufficient to identify both the depth and pattern of
Published: February 22, 2019                    rainfall. An appeal was made by Met Eireann for additional unofficial rainfall
                                                data. The result was remarkable in that the estimated maximum rainfall depth
Copyright © 2019 by author(s) and
                                                was found to be more than double the official value and that the resulting
Scientific Research Publishing Inc.
This work is licensed under the Creative        depth area analysis suggested a rainfall volume over a large area much bigger
Commons Attribution International               than the original isohyet map indicated. This result has huge implications for
License (CC BY 4.0).                            the estimation of maximum rainfall and dam safety assessment, especially in
http://creativecommons.org/licenses/by/4.0/
                                                countries where the raingauge network has a low density. This paper first
               Open Access
                                                provides a description of the synoptic conditions that led to the storm, second
                                                an analysis of the rainfall data and how the unofficial measurements pro-
                                                duced a very different depth area relationship; third, the social consequences
                                                of the resulting flood are described. Fourth, the storm is then placed in the
                                                context of other storms in the British Isles Finally the implications for rainfall
                                                measurement, gauge density and an example of how revised estimates of
                                                probable maximum precipitation (PMP) have been used to improve the safety
                                                and design standard of a flood detention dam are discussed.

                                                Keywords
                                                Raingauge Network, Unofficial Data, Maximum Rainfall Estimation, Dam Safety

                                              1. Introduction
                                              “Raingauges are the gold standard of precipitation measurement”. (Strangeways,

DOI: 10.4236/gep.2019.72006        Feb. 22, 2019                   76             Journal of Geoscience and Environment Protection
C. Clark

                              2007). With rainfall being measured for over 100 years in many countries, it was
                              with some dismay that the author read that the global network is in serious de-
                              cline (Sun et al., 2018). The value of measurements of rainfall to science and so-
                              ciety has been admirably described by Hou et al. (2014), and is not repeated
                              here. On a national scale, the UK has one of the densest networks in the world
                              but “if the 3000 or so rain gauges were placed side by side they would cover an
                              area less than the size of a football field” (Clark, 2002). Therefore the highest
                              falls during a major storm, especially over hilly ground where there are fewer
                              gauges per unit area, will almost certainly be missed. This was shown for the
                              Martinstown UK storm in 1955 where the unofficial highest measurement was
                              76 mm higher than the official measurement (Clark, 2005). This raises serious
                              questions about reliable long term monitoring of rainfall trends (New et al.,
                              2001; Kidd and Huffman, 2011), flow modelling, (Andiego et al., 2018) flood
                              warning, (Shaw, 1994), water resources, (Singh, 2017) and PMP estimation (Clark,
                              2002; Rakhecha & Clark, 1999). Although there is an urgent need to have na-
                              tionally recognised estimates of PMP (Faulkner & Benn, 2016) which are reliable
                              (Afzali-Gorouh et al., 2018) neither of these reports stressed the need for more
                              detailed rainfall data. Some allowance for a sparse network of gauges in India
                              where there is an average of one gauge per 913 km2 was made by Rakhecha &
                              Clark (1999) by applying depth area analysis. The results were extended down to
                              an area of 10 km2 and were then maximised using WMO methods (WMO 2009).
                              Around Mumbai, the estimates of one-day PMP were 60% higher than the stan-
                              dard values in the IITM atlas (IITM, 1989), that is to say 120 cm instead of 70
                              cm. A record breaking storm of 94 cm in 2005 in Mumbai proved that the lower
                              value was in serious error, although the revised value of 120 cm is yet to be at-
                              tained. However, the higher values are being used for dam safety assessments in
                              Gujarat, India where the probable maximum flood (PMF) has to be estimated.
                              As an example of the value of unofficial raingauges in rainfall studies and PMP
                              estimation, the Dublin storm of June 1963 is analysed in this paper. The synoptic
                              situation is then followed by an analysis of the official and unofficial rainfall
                              measurements. A brief description of the resulting flood is given and the storm
                              placed in the context of other storms in the British Isles. Finally, the implications
                              for rainfall measurement in the future and estimates of PMP and PMF, with an
                              actual example of a flood detention dam, are described.

                              2. The Synoptic Situation
                              At 0600 hrs on the 11th June nearly the whole of the British Isles was under the
                              influence of a col, Figure 1, with high pressure to the north and south and low to
                              the east and west. McIntosh (1963) and Bonacina (1974) state that this is condu-
                              cive to summer thunderstorms, and the forecast for Great Britain and Northern
                              Ireland mentioned isolated thunder breaking out in some western districts.
                              About 320 km to the west of Ireland an occluded front aligned NW-SE and then
                              NNW-ESE as it moved eastwards. Conditions were overcast in W Ireland but

DOI: 10.4236/gep.2019.72006                         77             Journal of Geoscience and Environment Protection
C. Clark
Figure 1. Simplified synoptic charts for 11 June 1963.
rather more clear in the east. At Roches Point thunder was heard and continued
for another hour. During the next 6 hours the occluded front moved 80 km
eastwards and at the same time pressure rose from 1012.6 hPa to 1013.5 hPa at
Dublin Figure 2. At the same time the dewpoint temperature—a good indicator
of atmospheric moisture—reached 16 deg C, with air temperature 3 deg C
warmer. Rain was now falling over the Dublin area and by 1800 hr the front had
almost reached the SW Irish coast. Thunderstorms were reported at Aldergrove
in Northern Ireland, Malin Head in Donegal, and Collinstown about 5 km east
of Ballsbridge in Dublin. During the thunderstorm pressure dropped by just 1
hPa, so the storm was largely driven by convection.
The upper air charts, Figure 3 confirm both the presence of the col into the
middle troposphere and a warm pool of air over western Europe and the south
west approaches. Light winds such as 4 kts at Collinstown just to the west of
Dublin complete the synoptic situation.
3. Distribution of Rainfall
The official maximum rainfall for the day was 98 mm at Ballsbridge, Dublin,
Figure 4, which shows the distribution of rainfall using the official raingauge
data and then augmented by the unofficial data. Figure 5 shows the location of
most of the places mentioned in the text. The depth duration of the storm is
shown by the autographic record at Ballsbridge and also by unofficial manual
measurements made at Mount Merrion between 1350 hrs and 1450 hrs of 46
mm and 77 mm respectively. However, the highest unofficial fall was 235 mm at
Churchtown and the implied depth duration relations of this and the Ballsbridge
site are shown in Figure 6.
Morgan (1971) gives a list of 24 official gauges at which +10 mm were re-
corded. Because of the scale of the flood damage an appeal was made to the pub-
lic for more information. The result was remarkable. Table 1 shows the out-
come.
In an account of the accuracy of these measurements Morgan (1971) debated
DOI: 10.4236/gep.2019.72006 78 Journal of Geoscience and Environment ProtectionC. Clark
Figure 2. Changes in air pressure, temperature and dew point at Collinstown 11 June
1963.
Figure 3. (a) and (b) Contours of the 1000 - 500 hPa thickness charts for 0000 hr 11 and
12 June 1963. (c) and (d) Contours of the 500 hPa surface 0000 hr 11 and 12 June 1963.
Table 1. Unofficial rainfall measurements.
Location Depth (mm) Method of measurement
Churchtown 235 A can 203 mm diameter and 289 mm high
Mount Merrion 184 Raingauge
Blackrock 150 Bucket
Mount Merrion (2) 142 Glass tank 305 mm × 219 mm and 454 mm high
Donnybrook 131 Bucket well exposed
Sandymount 91 Bucket
Clontarf 54 Raingauge
DOI: 10.4236/gep.2019.72006 79 Journal of Geoscience and Environment ProtectionC. Clark
Figure 4. Distribution of storm rainfall using official and with the addition of unofficial
measurements.
Figure 5. Location of some places mentioned in the text.
Figure 6. Depth duration of the storm at Ballsbridge and Churchtown.
DOI: 10.4236/gep.2019.72006 80 Journal of Geoscience and Environment ProtectionC. Clark
the poor siting of the Churchtown site in terms of both insplashing and outsplash-
ing. However, Clark (2016) showed that a bucket gauge sited 2.5 m from a two
storey house and closer to a nearby bush in the southerly direction than twice its
height, gave very satisfactory results, Figure 7. This being the case there is no
overriding reason to reject the value of 235 mm especially as it is backed up by a
raingauge reading of 184 mm and unlikely to have caught the highest rainfall.
Comparing the two isohyet maps, Figure 4 shows how the unofficial readings
have produced a remarkable transformation of the distribution of storm rainfall.
The storm is much more concentrated and the centre is shifted about 4 km
south of Ballsbridge Showground. The effect of the extra data extends to the 50
mm isohyet SSW of Merrion.
The great contrast between the official and unofficial rainfall measurements is
also shown by depth area analysis Figure 8. There is no method known to the
author that could have predicted the augmented depth area curve by only using
the official measurements.
4. The Flood
The effects of such a concentrated storm were exceptional and are best described
by newspaper reports. The Irish Times (12/6/1963) stated: “Early today, house-
holders in Stillorgan, Blackrock, Mount Merrion, Dundram, Sandyford and
Merrion were trying to restore some kind of order following the destruction
caused in their homes by the retreating waters, even then still lapping around
their feet … during the height of the storm thousands of workers were leaving
the city for home. One man was thrown high into the air in Pearse Street as a
blast of lightning hit the footpath where he walked He was treated for burns in
Sir Patrick Dun’s Hospital. The concentration of the flooding in the Merrion
Figure 7. Comparison of standard and bucket raingauge observations (Clark, 2016).
DOI: 10.4236/gep.2019.72006 81 Journal of Geoscience and Environment ProtectionC. Clark
Figure 8. Depth area analysis of the storm Open circles official data. Closed circles with
unofficial data.
area is believed to be due to lightning which wrecked the automatic pumping
station… this normally keeps the low-lying lands at Merrion free of floods”. The
Irish Independent (12/6/19063) continues: “An artificial night fell over Dublin at
the height of the storm at 3pm with lightning flashes streaking eerily through the
gloom. Motorists drove with headlights on… Torrents cascaded in and out of
houses and in some cases bore furniture out through windows. Fire Brigade,
Gardai, Civil Defence and Corporation workers, aided by clergy and civilians,
were still battling late last night. Two children on their way from school at
Goatstown were rescued after being swept some distance by a fast moving tor-
rent on the main Goatstown Road… Dr Joseph McNeaney in Lower Kilmacud
Road had to take refuge with his family in the upstairs rooms of his home when
water flooded the ground floor to a depth of five feet when a small river at the
rear of the house overflowed.” Similarly, as reported in the Irish Times 12/6/1963:
“Two gardens in Grove Avenue were completely under water as the stream in
the area flooded”.
DOI: 10.4236/gep.2019.72006 82 Journal of Geoscience and Environment ProtectionC. Clark
The Evening Press (12/6/1963) reported Miss Coleman of Allesbury Park as
saying “I got home by taxi at 4pm, yesterday and found the water up to the steps.
Shortly after, it burst in through the kitchen which became flooded … about
8pm the water rushed into the hall and flooded all the downstairs rooms. The
average depth of the water in St Albans Park was 3 1/2 feet”. Lorry drivers did
their best to drive through the waters but: “three hours later a lorry driver ig-
noring the advice of many motorists drove into the swirling waters only to be
bogged down in the deepest part. He had an attractive girl companion in the cab.
When the vehicle showed no signs of extricating itself he clambered out to the
back and jumped into the water which was waist high. From there he gallantly
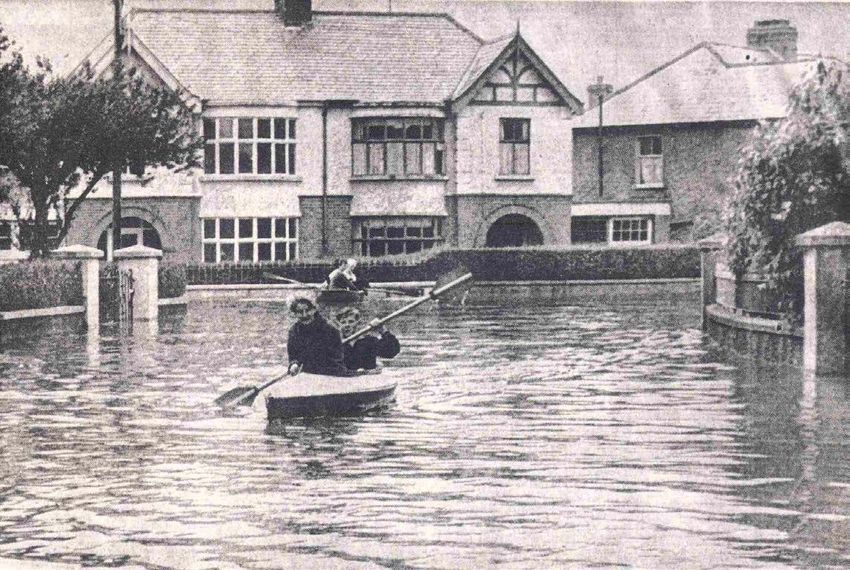
carried his girl friend to dry land” (Irish Times 12/6/1963). The following day at
Ballsbridge people were seen using boats to get about Figure 9 with Miss Griffin
and Stanley Paisley paddling along in the front boat.
From these descriptions it is clear that both fluvial and surface water caused
the damage. With low land gradients the water was slow to subside, while the
pumping station failure made the situation worse.
5. The Storm in the Context of UK Extreme Storms
The Dublin storm must be placed in relation to other extreme storm events since
this gives a better description on a Nationwide scale. There are several examples
of depth duration data (Rodda, 1970; Austin et al., 1995; Clark, 1995). Figure 10
shows the results of this approach which includes the Dublin storm. The esti-
mated duration of 9 hours is based on the 1000 - 1900 hrs GMT collection pe-
riod at Churchtown. While Ireland is a separate land mass to Britain, it covers
the same latitudes so that comparable rainfall depths would be expected. The key
finding from Figure 10 is that without maximisation of storm depths (WMO,
2009) the expected 24 hr rainfall is about 400 mm. This is in excess of the 300
mm given in the Flood Studies Report (NERC, 1975). In view of this the tech-
nique of storm maximisation was applied. The maximum persisting dewpoints
Figure 9. Residents going about their business by boat 11 June (Evening Post 12/6/1963).
DOI: 10.4236/gep.2019.72006 83 Journal of Geoscience and Environment ProtectionC. Clark
Figure 10. Depth duration of rare storms in SW England and Ireland 11 June 1963.
for Collinstown were gathered from the Daily Weather Reports and subjected to
an extreme frequency analysis. Figure 11 shows the results. During many, but
not all storms, the highest persisting dewpoint for that time of year is not
reached. The WMO manuals for estimating probable maximum precipitation
(PMP) have consistently advocated comparing the maximum dewpoint of the
storm with the 100-year persisting dewpoint for the same time of year. This is
defined as a time period 15 days either side of the storm date. Figure 2 shows
that the 12 hr persisting dewpoint was 12 deg C, while Figure 11 shows the
100-year persisting dewpoint is 17 deg C. Air masses with these temperatures
will hold different depth of moisture, called precipitable water (PW) and the
WMO manual has a table that relates PW to temperature. This depth will be less
than the storm rainfall because air is continually fed into the storm cell over the
period of interest. The ratio of the maximum PW to the storm PW gives the
moisture maximisation factor. When multiplied by the observed rainfall gives an
estimate of what the rainfall would have been under the most extreme condi-
tions:
MR = R × PWmax/PWstorm (1)
In the present case this becomes = 235 × 40.5/25.9 = 367 mm. However, from
Figure 2 the storm period did not start until about 0900 hr when the dewpoint
was 14 deg C. thus the maximised rainfall = 334 mm. Assuming that the depth
duration relationship has the same rate of change over the range 1 - 24 hours
this equates to a 24 hr PMP of about 500 mm. This is similar to that obtained for
parts of SW England (Clark, 1995) and Britain (Clark, 2002), with the latter
study using WMO methods with storm transposition where the storm is physi-
cally moved and the maximisation process repeated according to PW character-
istics and altitude in a meteorologically homogenous area. This analysis was
further backed up by standard frequency analysis.
DOI: 10.4236/gep.2019.72006 84 Journal of Geoscience and Environment ProtectionC. Clark
Figure 11. Frequency analysis of 12 hr maximum persisting dewpoint at Collinstown.
6. Implications for Raingauge Networks, Radar Rainfall,
PMP and Dam Safety
Over 80 years ago the Institution of Water Engineers, IWE (1937) produced
guidelines for the minimum number of raingauges for reservoired catchments.
Their recommendations are shown graphically in Figure 12 together with an es-
timate by Bleasdale (1965). Referring to the Dublin storm (Figure 2) the density
of the official network meets the IWE standard but this was much less dense in
the central area of the storm than when the unofficial measurements are in-
cluded. Results from the Martinstown storm (Clark, 2005) are also included.
Some 40 years later IOH (1977) suggested network densities for soil moisture
deficit, agriculture, and flood design, making the point that “the most stringent
requirements are met nowhere in the existing network apart from in local clus-
ters”. This is made clearer in Table 2 which also shows how the situation has
improved in Ireland while in Britain it has worsened.
During the past 30 years increasing resort has been made to radar rainfall
which can be calibrated with telemetered rainfall measurements. However, the
accuracy will depend on the correct density of raingauges in the first place. Ra-
dar rainfall tends to be less accurate for higher rainfall, and by implication
higher intensity, (Sebastianelli et al. 2013; Espinosa et al., 2015). When radar
based rainfall are used to produce a flood frequency curve via input into a hy-
drological model (Wright et al., 2014) for a 31 km2 sub-tropical catchment in
North Dakota gave a 1 in 1000 year flood estimate of only 200 cumecs, which is
just above that for the Upper Brue in the UK which has a temperate climate.
There were no historic flood data that were used to help validate their result.
A key concern for the future is the maintenance and improvement of the
raingauge network, especially in countries with a low network density. Following
the opening remarks by Strangeways (2007) a National appeal should be made to
encourage more people to measure rainfall, a practice that was largely the prov-
ince of the public as volunteers, pioneered by George Symons during the 1850’s.
Quality control can be achieved through published guidelines made freely avail-
able. The standard raingauge measuring funnel can be replaced by a simple
weighing machine and conversion factor. This would save time during a major
DOI: 10.4236/gep.2019.72006 85 Journal of Geoscience and Environment ProtectionC. Clark
Figure 12. Institute of Water Engineers’ standard of raingauge density. Mo = Mar-
tinstown storm official. Mu = Martinstown unofficial. Do = Dublin official. Du = Dublin
unofficial.
Table 2. Comparison of daily raingauge networks in 1935 and 2007.
1935 2007
Number of gauges (km per gauge)
2
Number of gauges (km2 per gauge)
Irish Republic 189 371.9 474 148.5
N. Ireland 68 207.8 103 137.2
Britain 3790 60.9 2665 86.6
storm if the bucket began to fill up, with a danger of outsplashing taking place.
As has been shown above, a simple bucket can give sensible measurements of
rainfall.
Given that 24 hr PMP in the Dublin area has been assessed as about 500 mm,
a result very comparable with Britain, it is likely that design rainfall depth will
also be higher than the Flood Studies Report (NERC, 1975). Higher 2 hr and 24
hr PMP was necessary to reproduce the historic flood record and estimated
probable maximum flood for the upper Brue, Somerset UK. This was used by
consultants Black & Veatch (2006) in an assessment of the spillway design flood
for the Bruton dam on the upper Brue. The original value was 240 cumecs, but
using the higher rainfall estimates, combined with higher percentage runoff and
lower time to peak of the flood hydrograph, a value in excess of 500 cumecs was
produced (Black & Veatch, 2006) almost the same as Clark (1997). This led to
major improvement works on the Bruton dam (Pether, 2010). However, general
advice on the use of higher estimates of both design rainfall and PMP has not
DOI: 10.4236/gep.2019.72006 86 Journal of Geoscience and Environment ProtectionC. Clark
been issued. Design rainfall estimates are based on probability theory, whereas
PMP estimates are deterministic. On the face of it the two parameters cannot be
combined into a unified frequency analysis. However, several attempts have
been made to give PMP a probability (Lowing & Law, 1995; Austin et al., 1995;
Koutsoyiannis, 2007; Fontaine & Potter, 1989; Nathan et al., 2016). The overall
consensus is that the annual exceedance probability (AEP) of PMP is somewhere
between 250,000 - 2 million years. Given that there is no correct value for the
AEP it is instructive to calculate the effect of the range of estimates—always as-
suming that they are realistic—on for example the 1 in 100 year rainfall. The re-
sults for 24 hr rainfall at the Bruton dam site are shown in Table 3. Two fre-
quency distributions are tested, the modified Gumbel scale (Rakhecha & Clark,
1999) hereafter RC, and the Gumbel scale (Gumbel, 1958).
The range of estimates for both the 1 in 100 and 1 in 1000 year rainfall is
much bigger when using the Gumbel scale. What is more alarming is that the es-
timates using the RC scale are much bigger. The largest difference is a factor of
1.75 for 1 in 1000 year rainfall with an AEP = 2 × 10⁶ years. The small range of
values using the RC scale are well within an uncertainty band of 20% for this
type of analysis with a difference of 6% for the 1 in 100 year rainfall depth be-
tween the highest two exceedance probabilities. This contrasts with a difference
of 10% using the Gumbel scale. The RC 1 in 1000 year estimates are 46% higher
than the Gumbel based estimate. So which estimates are the more realistic? For-
tunately for the East Somerset area in the first instance there is a 292 year his-
toric flood record for the upper Brue at Bruton (Clark, 2014) and rainfall records
(Clark & Pike, 2007) that are detailed enough to allow a test of the two fre-
quency scales. On June 28 1917 Bruton had the second highest flood in the
historic record. From the daily rainfall record the soil moisture deficit prior to
the storm was about 64 mm. The estimated storm profile based on manual
measurements made at Bruton gives an effective rainfall of 107 mm in about
7.6 hours. The FEH CDROM areal 2-year 7.6 hr rainfall = 25.5 mm. Using 1-hr
and 24 hr PMP estimates (Clark, 2002) the 7.6 hour point PMP = 376 mm
which when reduced by the areal reduction factor (Clark, 2012) for a catch-
ment area of 31 km2 = 256 mm. The Gumbel equation for the reduced variate:
−ln(1 − 1/T) where T = return period (years). Taking a value of the AEP = 106
years gives a value of the reduced variate = 13.8155. The modified reduced vari-
ate, RC gives a value for the reduced variate = 9.3826. The resulting rainfall fre-
quency equations are:
Table 3. Rainfall estimates based on different estimates of the AEP of PMP.
24 hr rainfall (mm) RC 24 hr rainfall Gumbel
AEP of PMP 1 in 100 year 1 in 1000 year 1 in 100 year 1 in 1000 year
4 × 10⁻⁶ 138 226 98 158
10−6 130 208 89 137
2 × 10 −6
127 201 79 115
DOI: 10.4236/gep.2019.72006 87 Journal of Geoscience and Environment ProtectionC. Clark
LogR = 0.1089y + 1.3859 (RC) (2)
LogR = 0.0744y + 1.3792 (Gumbel) (3)
These equations give return periods of 745 years and 6180 years respectively
for the effective storm rainfall. Since the rarity of the threshold SMD (Clark,
2018) = 4.07 years, a value based on evaporation measurements at CHRS and a
corrected 142 year rainfall record, then the estimated return period of the flood
can be calculated (Clark, 2012, 2018):
RpFLOOD = RpER × RpSMD (4)
where ER = effective rainfall = rainfall – SMD down to the threshold SMD. This
gives return periods of the flood event as 3030 years (RC) and 25,150 years
(Gumbel). The historic flood frequency analysis (Clark, 2014) shows that the
1917 flood had a return period of 1930 years. To obtain a rarity of 1 in 25,150
years would mean a peak discharge of 246 cumecs, which is 70 cumecs higher
than the estimated value of 175 cumecs. A discharge of 193 cumecs has a rarity
of 3030 years These differences show that the Gumbel scale produces unrealistic
estimates of both rarity and design rainfall depth. If on the other hand the
Gumbel derived rarity was correct then the 1979 flood on the Brue would need a
channel roughness value of 0.042 which is excessively high and it would also
mean a probable maximum flood (PMF) of 260 cumecs which has a runoff rate
considerably below the Extreme Catastrophic Flood of Allard, Glassspole, &
Wolf (1960).
In a worldwide study of rainfall Papalexiou & Koutsoyiannis (2013) have also
shown that the Gumbel scale is not suitable for analysing extreme rainfall. The
argument has been extended (Koutsoyiannis & Papalexiou, 2017) which showed
that the Gumbel distribution gave lower design rainfall estimates than the Fre-
chet distribution. Further details of this important result, which is supported by
the present analysis are given in Papalexiou et al. (2013).
7. Conclusion
The initiative of Met Eireann to enquire if local people had any records of the
storm of June 11 1963 has proven to be of great value. It also highlights the need
for more registered raingauges, especially in upland areas where the density of
gauges is low and, more important, where many reservoirs are located.
The most important role of science is to provide an accurate description of
nature. The humble raingauge which was pioneered on a systematic basis by
Richard Townley during the 17th century and later developed on a National scale
by George Symons, remains the best way of providing a description of rainfall.
But in recent years it has become neglected, fallen out of fashion, as the reliance
on indirect methods has grown. This may be a mistake as shown in retrospect by
the Dublin storm. The estimated 24 hr PMP for the Dublin area is about 500 mm
which is 200 mm in excess of the value given in the FSR (NERC, 1975). This has
serious implications for dam safety. Similarly, higher values of PMP were used to
justify the improvement of the Bruton dam. Furthermore, higher estimates of
DOI: 10.4236/gep.2019.72006 88 Journal of Geoscience and Environment ProtectionC. Clark
PMP in India were obtained by using depth area analysis (RC), which overcomes
to a certain extent the rather sparse raingauge network of one gauge per 913
km2. To begin with the higher values were disbelieved until the storm of July
2005 over Mumbai when existing estimates of PMP were exceeded by 24 cm!
The much higher PMP values for India have been used in an assessment of dam
safety in Gujarat. It is not clear why more general guidance has not been issued
for Britain. The FEH13 (Stewart et al., 2013) omitted a consideration of PMP
which is some way be linked to rainfall of a lower rarity. Higher design rainfall
estimates have been produced as a result of the analysis of the Dublin storm. Es-
timates of PMP for the whole of Ireland are now being produced. The implica-
tions for the design of dam spillways and other drainage works are serious.
Acknowledgements
The author would like to thank staff at Met Eireann for supplying data on the
Dublin storm.
Conflicts of Interest
There is no competing or conflict of interest in this study.
References
Afzali-Gorouh, Z., Bakhtiari, B., & Qaderi, K. (2018). Probable Maximum Precipitation
Estimation in a Humid Climate. Natural Hazards and Earth System Sciences, 18, 3109-
3119. https://doi.org/10.5194/nhess-18-3109-2018
Allard, W., Glasspole, J., & Wolf, P. O. (1960). Floods in the British Isles. Proceedings of
the Institution of Civil Engineers, 15, 119-144.
Andiego, G., Waseem, M., Usman, M., & Manti, N. (2018) The Influence of Rain Gauge
Network Density on the Performance of a Hydrological Model. Computational Water,
Energy, and Environmental Engineering, 7, 27-50.
https://doi.org/10.4236/cweee.2018.71002
Austin, B. N., Cluckie, I. D., & Collier, C. G. (1995). Radar-Based Estimation of Probable
Maximum Precipitation and Flood. Metstar Consutlants. Bracknell. Report for DOE,
123 p.
Black & Veatch (2006). Bruton Flood Storage Reservoir. Report on Hydraulic and Hy-
drological Studies. 43 p
Bleasdale, A. (1965). Rain Gauge Networks Development and Design with Special Refer-
ence to the United Kingdom. Pro. WMO/IASH Symposium on the Development of
Hydrological Networks, 67, 46-54.
Bonacina, L. C. W. (1974). The Weather in Cols. Weather, 29, 158.
Clark, C. (1995). New Estimates of Probable Maximum Precipitation in South-West Eng-
land. Meteorl. Appl., 2, 307-312. https://doi.org/10.1002/met.5060020403
Clark, C. (1997). Cause for Concern. International Water Power and Dam Construction,
49(4), 34-37.
Clark, C. (2002). Rainfall Estimates (PMP) in Great Britain. International Water Power
and Dam Construction, 54(5), 18-26.
Clark, C. (2005). The Martinstown Storm 50 Years on. Weather, 60, 251-257.
DOI: 10.4236/gep.2019.72006 89 Journal of Geoscience and Environment ProtectionC. Clark
https://doi.org/10.1256/wea.58.05
Clark, C. (2012). Spillway Design Flood and Flood Volume Estimated Using the New
Guide to Flood Estimation. In: T. S. W. Wong (Ed.), Flood Risk and Flood Manage-
ment (pp. 219-255), New York: Nova Science.
Clark, C. (2014). The Great Flood of 1726 at Bruton, UK. Weather, 69, 249-253.
https://doi.org/10.1002/wea.2272
Clark, C. (2016). Reply to Stephen Burt’s Comments on the Scarborough Storm and
Flood. Weather, 70, 280-284. https://doi.org/10.1002/wea.2512
Clark, C. (2018). The Storm and Flood of 13 May 1906 at Mells, Somerset UK. Weather,
73, 109-115. https://doi.org/10.1002/wea.3230
Clark, C., & Pike, W. S. (2007). The Bruton Storm and Flood after 90 Years. Weather, 62,
300-305. https://doi.org/10.1002/wea.142
Espinosa, B., Hromadka, T. V., & Perez, R. (2015). Comparison of Radar Data versus
Rainfall Data. MethodsX, 2, 423-431. https://doi.org/10.1016/j.mex.2015.10.007
Faulkner, D., & Benn, J. (2016). Reservoir Flood Estimation: Time for a Re-Think. In 19th
Biennial Conference of British Dam Society (pp. 1-13). London: ICE Publishing.
Fontaine, T. A., & Potter, K. W. (1989). Estimating Probabilities of Extreme Rainfalls.
Journal of Hydraulic Engineering, 115, 1562-1575.
https://doi.org/10.1061/(ASCE)0733-9429(1989)115:11(1562)
Gumbel, E. J. (1958). Statistics of Extremes (375 p.). New York: Columbia University
Press.
Hou, A. Y., Kaker, R. K., Neeck, S., Azarbarzin, K., Kummeron, C. D., Kojima, M., Oki,
R., Nakamura, K., & Iguchi, T. (2014). The Global Precipitation Measurement Mission.
Bulletin of the American Meteorological Society, 95, 702-722.
https://doi.org/10.1175/BAMS-D-13-00164.1
Indian Institute of Tropical Meteorology IITM (1989). Probable Maximum Precipitation
Atlas. Pune: IITM.
Institute of Water Engineers IWE (1937). Report of Joint Committee to Consider Meth-
ods of Determining General Rainfall over Any Area. Transactions of the Institution of
Water Engineers, 42, 231-259.
IOH (1977). Methods of Evaluating the UK Rain-Gauge Network (262 p.). IOH Report
40, Wallingford.
Kidd, C., & Huffman, G. (2011). Global Precipitation Measurement. Meteorological Ap-
plications, 18, 334-353. https://doi.org/10.1002/met.284
Koutsoyiannis, D. (2007). A Critical Review of Probability of Extreme Rainfall: Principles
and Models (pp. 139-166). Advances in Urban Flood Management, London: Taylor
and Francis.
Koutsoyiannis, D., & Papalexiou, S. M. (2017). Extreme Rainfall: Global Perspective. In V.
P. Singh (Ed.), Handbook of Applied Hydrology (pp. 74.1-74.16). New York: McGraw
Hill.
Lowing, M. J., & Law, F. M. (1995). Reconciling Flood Frequency Curves with the Prob-
able Maximum Flood. In BHS 5th National Hydrology Symposium.
McIntosh, D. H. (1963). Meteorological Glossary (288 p). London: HMSO.
Morgan, W. A. (1971). Rainfall in the Dublin Area on 11th June 1963 (7 p). Dublin: Met
Eireann.
Nathan, R., Jordan, P., Scorah, M., Lang, S., Kuczera, G., Schaefer, M., & Weinmann, E.
(2016). Estimating the Exceedance Probability of Extreme Rainfalls up to the Probable
DOI: 10.4236/gep.2019.72006 90 Journal of Geoscience and Environment ProtectionC. Clark
Maximum Precipitation. Journal of Hydrology, 543, 706-720.
https://doi.org/10.1016/j.jhydrol.2016.10.044
NERC (1975). Flood Studies Report (5 Vols.). London: Meteorological Office.
New, M., Todd, M., Hulme, M., & Jones, P. (2001). Precipitation Measurements and
Trends in the Twentieth Century. International Journal of Climatology, 21, 1899-1922.
https://doi.org/10.1002/joc.680
Papalexiou, S. M., & Koutsoyiannis, D. (2013). Battle of Extreme Value Distributions: A
Global Survey on Extreme Daily Rainfall. Water Resources Research, 49, 187-201.
https://doi.org/10.1029/2012WR012557
Papalexiou, S. M., Koutsoyiannis, D., & Makropoolo, S. C. (2013). How Extreme Is Ex-
treme? An Assessment of Daily Rainfall Distribution Tails. Hydrology and Earth Sys-
tem Sciences, 17, 851-862. https://doi.org/10.5194/hess-17-851-2013
Pether, R. (2010). Design and Construction of Improvement Works at Bruton Flood
Storage Reservoir, Somerset. Dams and Reservoirs, 20, 33-38.
https://doi.org/10.1680/dare.2010.20.1.33
Rakhecha, P. R., & Clark, C. (1999). Revised Estimates of One-Day Probable Maximum
Precipitation (PMP) for India. Meteorological Applications, 6, 343-350.
https://doi.org/10.1017/S1350482799001280
Rodda, J. C. (1970). Rainfall Excesses in the United Kingdom. Transactions of the Insti-
tute of British Geographers, 49, 49-59. https://doi.org/10.2307/621640
Sebastianelli, S., Russ, F., Napolitano, F., & Baldini, L. (2013). On Precipitation Measure-
ments Collected by a Weather Radar and a Rain Gauge Network. Natural Hazards and
Earth System Sciences, 13, 605-623. https://doi.org/10.5194/nhess-13-605-2013
Shaw, E. M. (1994). Hydrology in Practice (3rd ed., 613 p). London: Chapman & Hall.
Singh, V. P. (2017). Handbook of Applied Hydrology. New York: McGraw Hill.
Stewart, E. J., Jones, D. A., Svensson, C., Morris, D. G., Dempsey, P., Dent, J. E., Collier,
C. G., & Anderson, C. W. (2013). Reservoir Safety—Long Return Period Rainfall. R&D
Technical Report WS 194/2/39/TR.
Strangeways, I. (2007). Precipitation Theory, Measurement and Distribution (290 p.).
Cambridge: Cambridge University Press.
Sun, Q., Miao, C., Duan, Q., Ashouri, H., Sorooshian, S., & Hsu, K.-L. (2018). A Review
of Global Precipitation Data Sets: Data Sources, Estimation, and Intercomparison. Re-
views of Geophysics, 56, 79-107. https://doi.org/10.1002/2017RG000574
World Meteorological Organisation WMO (2009). Manual on Estimation of Probable
Maximum Precipitation (PMP) (259 p). WMO No. 1045, Geneva.
Wright, D. B., Smith, J. A., & Baek, M. L. (2014). Flood Frequency Analysis Using Radar
Rainfall Fields and Stochastic Storm Transposition. Water Resources Research, 50,
1592-1615. https://doi.org/10.1002/2013WR014224
DOI: 10.4236/gep.2019.72006 91 Journal of Geoscience and Environment ProtectionYou can also read