THE WORLD'S PREMIER GROWTH-ORIENTED ROYALTY COMPANY - CORPORATE PRESENTATION SEPTEMBER 2018
←
→
Page content transcription
If your browser does not render page correctly, please read the page content below
THE WORLD’S PREMIER
GROWTH-ORIENTED
ROYALTY COMPANY

CORPORATE PRESENTATION

SEPTEMBER 2018
Forward Looking Statements
Certain statements contained in this presentation may be deemed "forward-looking statements“ within the meaning of applicable Canadian and U.S. securities laws. All statements in this presentation, other than statements of historical fact,
that address future events, developments or performance that Osisko Gold Royalties Ltd (the "Corporation” or “Osisko” ) expects to occur, including managements’ expectations regarding the Corporation’s growth, results of operations,
estimated future revenues, requirements for additional capital, mineral reserve and mineral resource estimates, production estimates, gold equivalent ounces, production costs and revenue, future demand for and prices of commodities,
business prospects and opportunities are forward looking statements based on certain estimates and assumptions, and no assurance can be given that the estimates and assumptions will be realized. Forward looking statements are
statements that are not historical facts and are generally, but not always, identified by the words "expects", "plans", "anticipates", "believes", "intends", "estimates", "projects", "potential", "scheduled" and similar expressions or variations
(including negative variations), or that events or conditions "will", "would", "may", "could" or "should" occur including, without limitation, that all conditions precedent to the closing of the transaction between the Corporation and Orion Mine
Finance Group (the "Transaction") will be met and the realization of the anticipated benefits deriving therefrom for shareholders of the Corporation, the view on the quality and the potential of the Corporation’s assets, production forecasts
for properties in which the Corporation holds a royalty, stream or other interest. Although the Corporation believes the expectations expressed in such forward-looking statements are based on reasonable assumptions, such statements
involve known and unknown risks, uncertainties and other factors and are not guarantees of future performance and actual results may accordingly differ materially from those in forward looking statements. Factors that could cause the
actual results to differ materially from those in forward-looking statements include, without limitation: acceptance of the Transaction by the Corporation’s shareholders; the completion of a concurrent private placement to fund and support
the Transaction; the ability of the parties to receive, in a timely manner, the necessary regulatory and other third party approvals; the ability of the parties to satisfy, in a timely manner, the conditions to the closing of the Transaction; the
ability of Osisko to realize the assumed benefits of the Transaction; fluctuations in the prices of the commodities that drive royalties held by the Corporation; fluctuations in the value of the Canadian dollar relative to the U.S. dollar; risks
related to the operators of the properties in which the Corporation holds a royalty or other interest; the unfavorable outcome of litigation relating to any of the properties in which Osisko holds a royalty or other interest; development,
permitting, infrastructure, operating or technical difficulties on any of the properties in which the Corporation hold a royalty or other interest; rate and timing of production differences from mineral resource estimates or production forecasts
by operators of properties in which the Corporation hold a royalty or other interest; risks and hazards associated with the business of exploring, development and mining on any of the properties in which the Corporation hold a royalty or
other interest, including, but not limited to unusual or unexpected geological and metallurgical conditions, slope failures or cave-ins, flooding and other natural disasters or civil unrest; regulatory changes by national and local government,
including corporate law, permitting and licensing regimes and taxation policies; regulations and political or economic developments in any of the countries where properties in which the Corporation hold a royalty or other interest are located
or through which they are held); continued availability of capital and financing and general economic, market or business conditions; business opportunities that become available to, or are pursued by the Corporation; the impossibility to
acquire royalties and to fund precious metal streams; other uninsured risks. The forward looking statements contained in this presentation are based upon assumptions management believes to be reasonable, including, without limitation:
the ongoing operation of the properties in which the Corporation holds a royalty or other interest by the owners or operators of such properties in a manner consistent with past practice; the accuracy of public statements and disclosures
made by the owners or operators of such underlying properties; no material adverse change in the market price of the commodities that underlie the asset portfolio; no adverse development in respect of any significant property in which the
Corporation holds a royalty, stream or other interest; the accuracy of publicly disclosed expectations for the development of underlying properties that are not yet in production; and the absence of any other factors that could cause actions,
events or results to differ from those anticipated, estimated or intended. For additional information on risks, uncertainties and assumptions, please refer to the Corporation’s most recent Annual Information Form filed on SEDAR at
www.sedar.com and on EDGAR at www.sec.gov. The Corporation cautions that the foregoing list of risk and uncertainties is not exhaustive. Investors and others who base themselves on the forward looking statements contained herein
should carefully consider the above factors as well as the uncertainties they represent and the risk they entail. The Corporation believes that the expectations reflected in those forward-looking statements are reasonable, but no assurance
can be given that these expectations will prove to be correct and such forward-looking statements included in this presentation should not be unduly relied upon. These statements speak only as of the date of this presentation. The
Corporation undertakes no obligation to publicly update or revise any forward-looking statements, whether as a result of new information, future events or otherwise, other than as required by applicable law.
Safe Harbour Statement

This presentation has been prepared for informational purposes only in order to assist prospective investors in evaluating an investment in Osisko Gold Royalties Ltd.
Inquiries regarding this confidential presentation can be made to the senior management of the Corporation.

Cautionary Note to U.S. Investors Regarding Mineral Reserve and Mineral Resource Estimates

Osisko is subject to the reporting requirements of the applicable Canadian securities laws, and as a result, reports its mineral resources and reserves according to Canadian standards. Canadian reporting requirements for disclosure of mineral
properties are governed by National Instrument 43-101 (“NI 43-101”). The definitions of NI 43-101 are adopted from those given by the Canadian Institute of Mining, Metallurgy and Petroleum (“CIM”). U.S. reporting requirements are
governed by the Industry Guide 7 (“Guide 7”) of the Security and Exchange Commission ("SEC"). This presentation includes estimates of mineral reserves and mineral resources reported in accordance with NI 43-101. These reporting
standards have similar goals in terms of conveying an appropriate level of confidence in the disclosures being reported, but embody different approaches and definitions. For example, under Guide 7, mineralization may not be classified as a
“reserve” unless the determination has been made that the mineralization could be economically and legally produced or extracted at the time the reserve determination is made. Consequently, the definitions of “Proven Mineral Reserves”
and “Probable Mineral Reserves” under CIM standards differ in certain respects from the standards of the SEC. Osisko also reports estimates of “mineral resources” in accordance with NI 43-101. While the terms “Mineral Resource,”
“Measured Mineral Resource,” “Indicated Mineral Resource” and “Inferred Mineral Resource” are recognized by NI 43-101, they are not defined terms under standards of the SEC and, generally, U.S. companies are not permitted to report
estimates of mineral resources of any category in documents filed with the SEC. As such, certain information contained in this presentation concerning descriptions of mineralization and estimates of mineral reserves and mineral resources
under Canadian standards is not comparable to similar information made public by United States companies subject to the reporting and disclosure requirements of the SEC. Readers are cautioned not to assume that all or any part of
Measured Mineral Resources or Indicated Mineral Resource exists, or is economically or legally mineable. Further, an “Inferred Mineral Resource” has a great amount of uncertainty as to its existence and as to its economic and legal
feasibility, and a reader cannot assume that all or any part of an Inferred Mineral Resource will ever be upgraded to a higher category. Under Canadian rules, estimates of Inferred Mineral Resources may not form the basis of feasibility or
other economic studies.

Mr. Luc Lessard is the qualified person for this release as defined by National Instrument 43-101 – Standards of Disclosure for Mineral Projects and has reviewed and verified the technical information contained herein. Mr. Luc Lessard is an
employee of Osisko Gold Royalties and is non-independent.
                                                                                                                                                                                                                                                     2
Why Osisko?
LEADING & UNPARALLELED GROWTH PROFILE
Growing GEOs from 80k oz in 2018 to over 180k oz within the next 5 years
LEADING & HIGHEST MARGINS IN THE METALS & MINING SECTOR
Over 87% Cash Margins expected in 2018
DELEVERAGING QUICKLY
Repayment of $51.8M on the revolving credit facility in Q2
EXPERIENCED AND PROVEN MANAGEMENT TEAM
Global Exploration and Mine Building Capabilities In-House
A SIGNIFICANT DIVIDEND
Currently Yielding 2%
TRADING AT A DISCOUNT TO PEERS
3
Osisko’s Unique CAPITAL & HUMAN
Business Model RESOURCES
75% DEPLOYMENT 25%
TRADITIONAL ROYALTY
ACCELERATOR BUSINESS
& STREAMING BUSINESS
ORION PORTFOLIO | ~C$1.1B OSISKO MINING
ACHIEVEMENTS
Developing high grade resource in Québec
2017
BACK FORTY STREAM | ~C$70M BARKERVILLE
GIBRALTAR STREAM | ~C$50M Recording solid exploration results and commencing
small-scale mining
OSISKO METALS
Creation of new vehicule focused on base metals,
EAGLE ROYALTY | ~C$98M recently acquired Pinepoint mining camp
2018
HORNE 5 STREAM | C$180M FALCO RESOURCES
Completed feasibility study and advancing development
CHEQUE SIZE: MEDIUM TO LARGE SMALL TO MEDIUM
TIMELINE TO NEAR-TERM OR
MEDIUM TO LONG-TERM
CASH FLOW: PRODUCING
TYPE: STREAM, ROYALTY ROYALTY, RIGHTS, EQUITY
RISK: LOWER HIGHER
RETURN: LOWER HIGHER
COMPETITION: HIGHER LOWER
4
Tier 1 Jurisdictional Focus – Safe & Stable Asset Base

             104                             6
                                                                 3

                                         2

                        9

                                                                                      13

                                                  Represents total royalty/streaming assets

                                                                                              5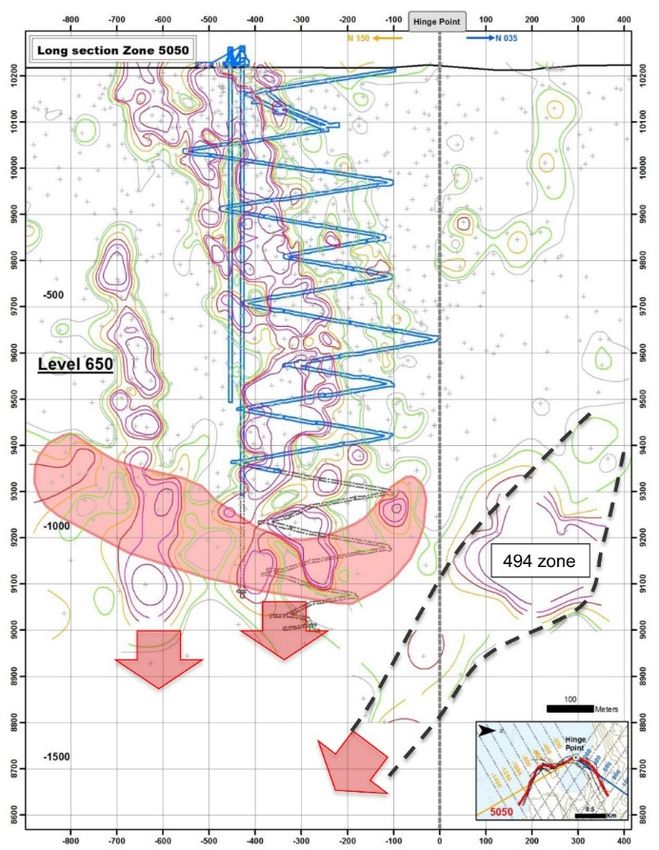
Quality Cash Flowing Assets – Strong North American Focus

                                                            6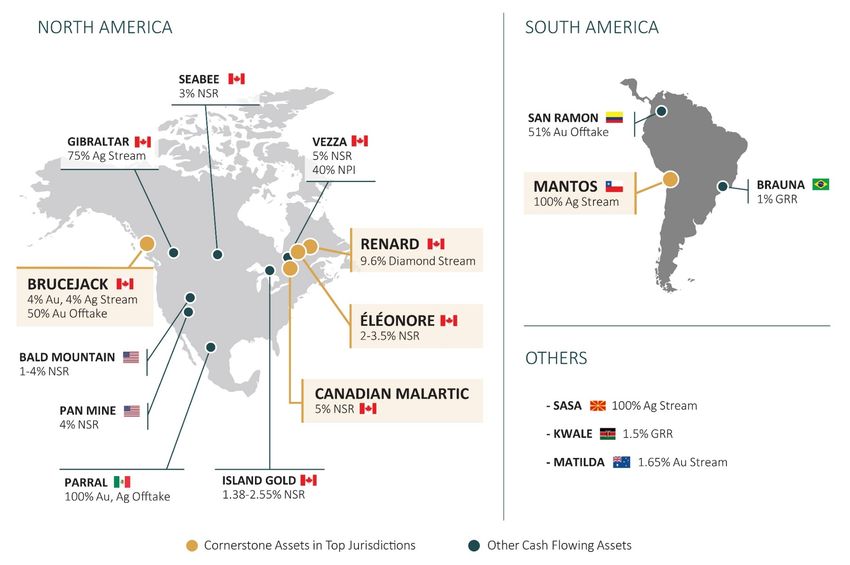
Strong producing platform & growth pipeline
Horne 5 Stream2
GEOs (k oz) Cariboo NSR
Windfall NSR
Amulsar Stream Hermosa NSR
& Offtake
Accelerator Companies
Back Forty Stream
Lamaque NSR 180-190
Brucejack Stream
& Offtake
Victoria NSR 21 OPTIONALITY
Horne 5:
25 k oz Marban NSR
130 - 140 Upper Beaver NSR
+
19 Highland Copper NSR
Casino NSR
Ollachea NSR
Yenipazar Offtake
77.5 - 82.5 Spring Valley NSR
Assets Nimbus Offtake
Currently in Tijirit NSR
Assets Production:
Currently in
115 k oz
Production: AND PORTFOLIO
90 k oz OF OVER 100
ADDITIONAL ROYALTIES
34.2 k oz
1
2018 2020E 2023E
Dotted box represents contribution from Brucejack stream if not bought-back by the operator
CURRENTLY FULLY FUNDED TO MORE THAN DOUBLE GEOS WITHIN 5 YEARS
Source: Osisko management estimates.
1. Refer to February 20, 2018 press release.
7
2. Subject to the closing of the transaction announced June 18, 2018 between Osisko and Falco. Expected closing in September 2018.
Delivering Significant Production Growth since Inception

   PRODUCTION AND GUIDANCE (GEOs)

                                                              77,500
                                                                to
                                                              82,500

                                                  58,933        At
                                    38,270                   87% Cash
                     30,588                                  Operating
       12,499                                                 Margin

        2014          2015           2016          2017     2018 Guidance

    WE EXPECT A STRONG PRODUCTION
          DURING H2 2018 AND                THE HIGHEST MARGIN IN THE
     STEADY PRODUCTION INCREASES            METALS AND MINING SECTOR
        THROUGH 2019 AND 2020
                                                                            8
Paying Down Debt

CREDIT FACILITY                                                        LONG-TERM DEBT
     $99.8M

                                                                    450.0

                                      TOTAL                         350.0

                                      CREDIT                                          $350.0
                                     FACILITY:                      250.0
                                                                                                           $350.0

                                     $450M1
                                                                    150.0

                                                                                      $148.0
                                                                                                            $99.8
                                                                     50.0
                                                                                   Dec. 31, 2017         Jun. 30, 2018

                Undrawn Credit Facility     Drawn Credit Facility           Debt from Credit Facility   Convertible Debt

                     REPAYMENT OF $51.8 MILLION ON THE REVOLVING CREDIT FACILITY IN 2018
1.   Including the $100M accordion
                                                                                                                           9
GEO Production and Guidance (k oz) – Growing Portfolio of New Mines
                                  OSISKO GOLD ROYALTIES                                                                                        Franco-Nevada
                     100
                                                                               80                                        500
                      75
                                                        59
        GEO (k oz)

                                                                                                            GEO (k oz)
                                                                                                                         400
                      50
                                38

                                                                                                                         300
                      25

                       0                                                                                                 200
                              2016A                  2017A                   2018E                                                 2016A                   2017A    2018E

                                            Royal Gold1                                                                              Wheaton Precious Metals2
                     375
                                                                                                                         800

                                                                                                                         750
                     325
        GEO (k oz)

                                                                                                            GEO (k oz)
                                                                                                                         700
                     275
                                                                                                                         650

                     225                                                                                                 600
                             2016A                   2017A                   2018E                                                 2016A                   2017A    2018E

1.   Royal Gold does not provide 2018 production guidance. Using consensus estimates instead. Calendarizing production and margin – fiscal year end is June 30th.
2.   Using consensus long-term gold and silver prices to calculate 2018 gold equivalent production guidance for WPM                                                         10
Osisko Trading at Discount to Peers
Consensus P / NAV
2.1x
1.9x
1.6x
1.1x
FNV RGLD WPM OR
112017 Gross Margin (%)
100.0% LEADING & HIGHEST MARGINS IN
THE METALS & MINING SECTOR
95.0%
92.0%
90.0%
85.0%
81.7%
80.0% 79.0%
75.0%
70.6%
70.0%
65.0%
60.0%
55.0%
50.0%
Osisko Gold Royalties Royal Gold Franco-Nevada Wheaton Precious Metals
1. Osisko 2017 gross margin is based on cost of sales over sales (excluding offtakes). Consensus estimates.
1275 %
LOW RISK PORTFOLIO
Source: Research reports and Osisko management estimates. 11Royalty Dominant Portfolio
Consensus NPV by Stage Consensus NPV by Type
Construction/ Offtake 2%
Ramp-Up 17%
ZERO-COST
GOLD
Stream
Production 47%
60%
Development
23% Royalty
51%
Consensus NPV By Geography Consensus NPV by Metal
Other 8% Other 4%
Chile Diamond
8% 12%
U.S.
9%
Silver
22%
Canada Gold
75% 62%
Source: Research reports. 14Updates on Cash Flowing Assets
CANADIAN ÉLÉONORE RENARD BRUCEJACK1
MALARTIC
5% NSR 2.2 - 3.5% NSR 9.6% DIAMOND STREAM 4% Au, Ag STREAMS, 50% offtake
Record annual production and mill Improved average recovery by Q1 recent average diamond price First gold pour on June 20, 2017
throughput 1.5% in 2017 of US$112/carat 95.8% gold recovery rate in Q4 2017
The Barnat extension continues to 7% increase in volume of ore 1.2 mcarats to be produced in Steady state gold production to be
progress on schedule milled for 2017 2018 achieved mid-to-late 2018
Exploration programs are ongoing Opened 3rd mining horizon Commenced ore-waste sorting, First year ramp-up total gold
to evaluate a number of near facility completed in Q1 2018 production is forecasted to be 302-
pit/underground targets 352 Koz
MANTOS SASA ISLAND SEABEE
GOLD
100% Ag STREAM 100% Ag STREAM 1.38-2.55% NSR 3% NSR
Production of silver better than One of the largest zinc, lead and Significant exploration results As per recent PEA, estimated gold
expected for Q4 and year 2017 silver mines in Europe Increasing throughput at mill production would average 100
due to change in the mine plan Acquisition by Central Asia Metals Koz/year from 2018-2023, 29% higher
Debottlenecking project expected Plc in 2017 than 2016 production
to increase processing capacity at Resources to support 20 year mine Record mill throughput for Q4 2017
the concentrator by 70% life
15
1. Subject to a 100% buy-back provision by the operator in 2018Near & Medium-Term Cash Flowing Assets
HORNE 5
HAMMOND 90-100% AG
EAGLE REEF STREAM
5% NSR 1.5% NSR
WINDFALL
BRUCEJACK CARIBOO 1.5% NSR
4% AU-AG 2.25% NSR
STREAM UPPER BEAVER
KIRKLAND LAKE CAMP
2% NSR
LAMAQUE
HERMOSA 1.7% NSR
AMULSAR 1% NSR
4.22% Au, 62.5% Ag STREAM
82% Au OFFTAKE
ODYSSEY NORTH & SOUTH
3% & 5% NSR
BACK FORTY
18.5% Au STREAM
75% Ag STREAM
CERRO DEL GALLO
3% NSR
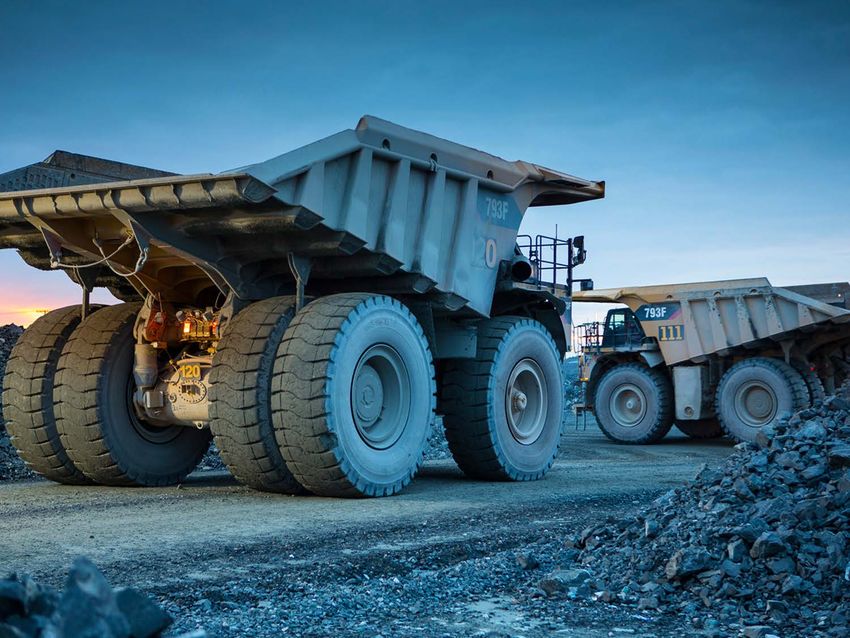
16Q2 Acquisition - Eagle 5% NSR Gold Royalty
POTENTIAL TO BE
THE LARGEST GOLD
MINE IN THE YUKON
OPERATOR: Victoria Gold Corp. (100%)
LOCATION: 85 km NE of Mayo, Central Yukon, Canada
RESERVES: 123 Mt at 0.67 g/t Au for 2.7 M oz Au
5% NSR royalty until 97,500 ounces of gold have
ROYALTY:
been delivered and 3% thereafter
PRODUCTION: 10,000 avg. royalty-attributable GEO's/year
Fully permitted and in construction
Top-tier jurisdiction
HIGHLIGHTS:
Excellent near-mine and regional exploration
potential
PERMITTED AND IN CONSTRUCTION WITH MAJOR INFRASTRUCTURE ITEMS IN PLACE
17Q2 Acquisition Announcement – Horne 5 Silver Stream
THE NEXT GREAT UNDERGROUND
MINE IN CANADA
OPERATOR: Falco Resources Ltd (100%)
LOCATION: Rouyn-Noranda, Québec
RESERVES: 6.0 M oz at 2.37 g/t Au Eq.
STREAM: 90-100% Ag @ 20% of spot transfer price (up to $6/oz)
PRODUCTION: 25,000 avg. attributable GEO's/year
Feasibility study completed
A significant silver streaming interest on an
advanced North American project
HIGHLIGHTS: Mid-term cash flow from Québec, one of the best
mining jurisdictions in the world
Upside potential through further resource
conversion and exploration at Horne 5
Closing expected in September 2018 and is subject
CLOSING: to approval by Falco shareholders
Transaction is subject to ROFR in favor of Glencore
OSISKO LOOKING FORWARD TO SUPPORTING ANOTHER GREAT MINE IN
QUÉBEC, ONE OF THE TOP MINING JURISDICTIONS IN THE WORLD 18Updates on Near & Medium-Term Cash Flowing Assets
AMULSAR LAMAQUE HORNE 5 HERMOSA
4.22% Au, 62.5% Ag STREAMS, 0.85% NSR 1% NSR 1% NSR
82.5% offtake CAPEX in 2018 are forecast to be $120 Completed Feasibility in late 2017. Updated PEA shows US$2.0B NPV and
million Deposited EIA. rapid 1.6 year payback of pre-
Engineering ~95% complete,
Mill start-up expected in Q4 2018 220,000 ounces of Gold production at production capex
procurement is approaching 90%, and
Commercial production remains $399/oz Au AISC 29 year mine life
construction work is over 50% complete
forecast for 2019 Strong and Experienced management Rapid development to production in
First gold production expected for Q4
Ramp is advancing, now at C2 Level team. 2020 at first quartile costs
2018
Advancing the declines in June 2018
Schedule risks are now reduced given
New copper-rich zone discovered
that critical earthworks are largely
complete
WINDFALL CARIBOO ODYSSEY BACK FORTY
NORTH & SOUTH
1.5% NSR 2.25% NSR 3% & 5% NSR 18.5% Au,- 75% Ag STREAMS
Largest exploration program in Expect to see near-term cash flow During 2017, a total of 125 holes 4 out of 4 permits granted
Canada recently extended to from small-scale operation (86,051 metres) were completed at PEA highlights 16 years mine life
800,000 metres Started collaring ramp the Odyssey property and 5,350 tpd throughput
Announced initial maiden resource Very good exploration results The results have been incorporated Feasibility expected in 2018
on May 14th, 2.9 M oz @ 6.91 g/t to update the mineral resource for Potential for mine life extension
Severe capping the Odyssey property Received final permit
During Near-term production (2018-
2020) from Odyssey South
19Accelerator Model: Case Study
Arizona Mining to Dalradian:
1. Osisko makes equity ($5.6M) and royalty ($10M) investment in Arizona Mining
2. Discovery made by Arizona Mining on Hermosa project
3. Negative market reaction, Osisko makes further equity investment post further technical diligence
4. Osisko monetizes Arizona Mining equity investments for gains of $22.8M
5. Osisko uses Arizona Mining gains and makes investment in Dalradian of $28.5M
Production
Expansion
VALUE OF PROJECT / COMPANY
Exploration Production
Euphoria Re-Rating
Important:
4
Maintain exposure
to Hermosa
2 DALRADIAN Production project through
Technical Studies Ramp-up royalty investment
and Permitting
Financing,
ARIZONA 5
Construction
MINING
3
1 TIME
Transferring gains to new investments while keeping exposure to existing assets
Optimal investing stage for Accelerator Model
20SUMMARY
137 5 19 DIVIDEND YIELD
ROYALTIES,
STREAMS AND
CORNERSTONE
ASSETS
PRODUCING
ASSETS
2%
METAL OFFTAKES
RECORD 77,500 to
PRECIOUS METAL AMERICAS 82,500 oz
FOCUSED FOCUSED 58,933 GEOs
ATTRIBUTABLE
EARNED FOR 2017
GEOs FOR 2018
THE WORLD’S PREMIER
GROWTH-ORIENTED C$336M C$188.6M
IN INVESTMENTS IN CASH
ROYALTY COMPANY As at June 30, 2018 As at June 30, 2018
21APPENDIX
The Team – Over 200 Years of Experience in Geology and Mine Building
Transformed 20 years of 10 years of
Osisko Mining experience in experience in the
MANAGEMENT into a leading
intermediate
legal affairs in
the mining
mining industry
in corporate dev.
TEAM producer
Over 30 years of
industry and mining
investment
experience in the banking
Bryan A. Coates mining industry
André Le Bel Joseph de la Plante
President VP, Legal Affairs & VP, Corporate Development
Corporate Secretary
Co-Founder of 18 years of 10 years of 15 years of
Osisko Mining experience in experience in the experience in
Corporation finance, treasury mining industry financial
Transformed and financial related to capital reporting,
Osisko Mining reporting markets and including over
into a leading mergers & 10 years in the
intermediate acquisition mining industry.
Sean Roosen producer Elif Lévesque Vincent Metcalfe Frédéric Ruel
Chair & CEO CFO & VP, Finance VP, Investor Relations VP, Corporate Controller
Led the Over 17 years of Over 16 years of
construction of experience in experience in
TECHNICAL the Canadian mining and engineering,
extensive design and
TEAM Malartic Mine
experience in construction of
open pit and mining projects
underground
operations
Luc Lessard François Vézina Christian Laroche
SVP, Technical Services VP, Technical Services Director, Metallurgy
23Canadian Malartic Royalty – 5% NSR Royalty
THE LARGEST
GOLD MINE
IN CANADA
OPERATORS: Agnico Eagle (50%) / Yamana Gold (50%) CANADIAN MALARTIC EXTENSION
PROJECT RECEIVES GOVERNMENT
LOCATION: Malartic, Québec OF QUEBEC APPROVAL
RESERVES: P&P mineral reserves of 6.38 M oz Au1
5% NSR royalty
ROYALTY: $0.40/tonne on milled ore from outside
the current property area for life of mill
starting in June 2021
2017 PRODUCTION
682.0 K oz2 Au (33,136 oz earned for Osisko)
(100%):
OPERATOR 2018: 650 k oz PROVEN & PROBABLE
2019: 650 k oz
GUIDANCE (Au)
(100%): 2020: 690 k oz
MINERAL RESERVES OF
6.38 M oz Au1
1. See Appendix for full disclosure on Reserves & Resources. 24
2. Based on Agnico Eagle’s press release dated February 14, 2018, titled: “Agnico Eagle Reports Fourth Quarter and Full Year 2017 Results…”Canadian Malartic Exploration Upside| Odyssey & East Malartic
ODYSSEY NORTH & SOUTH Updated Inferred mineral resources are
estimated at 1.68 Moz of gold (22.4 million
OSISKO HOLDS A 5% NSR ROYALTY tonnes grading 2.32 g/t gold) for the
ON THE ODYSSEY SOUTH ZONE AND Odyssey property.
A 3% NSR ROYALTY ON THE ODYSSEY During 2017, a total of 125 holes (86,051 metres) were
NORTH ZONE completed at the Odyssey property and the results
have been incorporated with previous work to update
the mineral resource for the Odyssey property1.
4.08 M oz Au
Combined inferred
and growing
resources1
EAST MALARTIC In 2017, an initial inferred mineral
resource was declared on the East
LIES ON THE CANADIAN MALARTIC Malartic property, which was a historical
MINE PROPERTY. OSISKO HOLDS A
gold producer directly adjacent to the
5% NSR ROYALTY
Canadian Malartic Mine. Inferred mineral
resources at East Malartic are estimated
at 2.4 million ounces of gold (38.0 million
tonnes grading 2.02 g/t gold) to a depth
of 1,000 metres.
1. Based on Agnico Eagle’s press release dated February 14, 2018, titled: “Agnico Eagle Reports Fourth Quarter and Full Year 2017 Results…”
25Canadian Malartic Site - Longitudinal
26Éléonore Royalty – 2.0 to 3.5% NSR
3.80 M oz Au
OPERATOR: Goldcorp (100%)
LOCATION: James Bay, Québec
RESERVES: P&P mineral reserves of 3.80 M oz Au1
2.0% NSR on the first 3 M oz of Au
Potential to 1,500m
0.25% increase for every additional
ROYALTY: 1M oz of production thereafter, to a
maximum of 3.50%
+10% if Au is higher than US$500/oz
2017 PRODUCTION: 305 k oz2 (6,390 oz earned for Osisko)
2018 OPERATOR
360 k oz3
GUIDANCE:
The mine is on pace to achieve optimum
sustainable gold production rates by the
1. See Appendix for full disclosure on Reserves & Resources.
second half of 2018.
2. Based on Goldcorp press release dated February 14, 2018, titled “Goldcorp Reports Fourth Quarter 2017 Results”.
27
3. Based on Goldcorp’s Investor Day presentation dated January 18, 2018 and company website9.6% Renard Diamond Stream
Operator: Stornoway
Primary Commodity: Diamond
QUÉBEC’S FIRST P&P RESERVES OF
Location: North-Central Québec, Canada
DIAMOND MINE 20.0 M CARATS
Reserves: P&P reserves of 20.0M carats
Resources:1 M&I of 2.8M and inferred of 13.1M carats
9.6% Stream on diamonds
US$50/carat transfer payment
Stream: - 1% annual inflation starting 3 years
after commercial production
No cap on current reserve pipes
Production: LOM avg. of 1.6M cts/year
Producing world class diamond mine in Québec
Québec organizations invested (Investissement Quebec, La Caisse
and Fonds)
Scarcity of new diamond mines globally
Upside from M&I and inferred and all pipes remain open at depth
Significant upside potential from recovery of large stones
Quality operator
Caisse owns separate 4% stream on Renard and Investissement
Quebec owns a 2% NSR royalty
1.6M carats recovered
2018 Guidance: - 1.1M carats (+7 DTC) at US$125-165
- 0.6M carats (-7 DTC) at US$15-19
Source: Company disclosure and Osisko management estimates. 28
1. Exclusive of reserves. See slide 40 for detailed R&R statement.100% Mantos Silver Stream
A LARGE 3 BILLION POUND Operator: Mantos Copper (private company owned by Orion)
COPPER MINE COPPER RESOURCE Primary
Copper
UNDERGOING WITH A STABLE SILVER Commodity:
EXPANSION BY-PRODUCT Location: Antofagasta, Chile
100% stream on silver production; reducing to
30% after 19.3M oz
Transfer payments based on 25% of the prevailing
Stream:
spot silver price
50% buy-down option exercisable in 2020, 2021,
or 2022 for US$70M
2017-20 avg. payable production of 0.6M oz Ag
Production: Avg. payable production of 1M oz Ag from 2021
onwards; sulphide expansion assumed in 2021
Debottlenecking feasibility study underway
Well-established operating copper mine in top jurisdiction
Ex-Anglo American management team with strong understanding
of the mine and highly incentivized
Significant cost reductions and more de-bottlenecking in progress
Drilling underway to add resources
Limited historical regional exploration
294% Au/Ag Brucejack Stream, 50% Au Offtake
Operator: Pretium
Primary
Gold
Commodity:
HIGH GRADE GOLD Location: 65km north of Stewart BC. Canada
PRODUCTION IN CANADA
Reserves: P&P reserves of 8.1M oz Au, 5.9M oz Ag
Resources:1 M&I of 9.1M oz Au, 7.9M oz Ag and inferred of
3.1M oz Au, 4.0M oz Ag
4% Stream on Au and Ag
US$400/oz Au, US$4.00/oz Ag transfer payment
Stream:
50% offtake of Au and Ag representing an
effective NSR of 0.9%
Stream capped at 7.067M oz Au and 26.297M
oz Ag
Full stream buyback option in 2018 and 2019
Caps /
for US$119M and US$136M respectively.
Buy-Down / Buy-
Stream buy-down option in 2018 (8%) and
Back Options:
2019 (8%) for US$75M
Offtake buy-down options (50% or 75%
buyback) in 2018 and 2019
2017 Production: 152 koz Au; 179.2 koz Ag
2018 Guidance: 150-200 koz Au during H1
We have assumed stream could be bought-back for US$119M in 2018
Additional upside if stream not repurchased or Pretium undergoes a
change of control
Source: Company disclosure and Osisko management estimates.
1. Inclusive of reserves. See slide 40 for detailed R&R statement. 30Royalties, Streams and Offtakes – Complete List
Asset Name Operator Country Status Description
Producing Royalties, Streams & Offtakes
1 Canadian Malartic CM Partnership (Agnico Eagle, Yamana) Canada Production 5% NSR
2 Éleonore Goldcorp Canada Production 2-3.5% NSR on Au, 2% NSR on all other metals
3 Gibraltar Taseko Mines Canada Production 100% Ag Stream
4 Mantos Blancos Mantos Copper Chile Production 100% Ag Stream
5 Renard Stornoway Diamonds Canada Production 9.6% Diamond Stream
6 SASA Central Asia Metals Macedonia Production 100% Ag Stream
7 Brucejack (O) Pretium Resources Canada Production 50% Au offtake
8 Matilda Blackham Resources Australia Production 55% Au offtake
9 Parral GoGold Resources Mexico Production 100% Au + Ag offtake
10 San Ramon Red Eagle Mining de Colombia Colombia Production 51% Au offtake
11 Bald Mountain Kinross United States Production 1%-4% GSR
12 Brauna Lipari Mineração Brazil Production 1% of Gross Sales (Diamond)
13 Hewfran Metanor Resources Canada Production 1.7% NSR
14 Holloway Holt Kirkland Lake Canada Production $8.50/oz production from the property
15 Island Gold Alamos Gold Canada Production 1.38%-2.55% NSR
16 Kwale Base Resources Kenya Production 2% of GRR on titanium
17 Pan Fiore Gold United States Production 2.5-4.0% Au Production Royalty, 2% on all other products
18 Seabee Santoy SSR Mining Canada Production 3% NSR
19 Vezza Nottaway Resources Canada Production 5% NSR on all metals, 40% NPI
Near-Term Development Royalties, Streams and Offtakes
20 Amulsar (S) Lydian Armenia Construction 4.22% Au Stream and 62.5% Ag Stream
21 Amulsar (O) Lydian Armenia Construction 82% Au offtake
22 Back Forty Aquila Resources United States Development 18.5% Au Stream and 75% Ag Stream
23 Brucejack (S) (2020) Pretium Resources Canada Production 4% Au Stream and 4% Ag Stream (stream in 2020)
24 Cariboo Gold Project Barkerville Gold Mines Canada Exploration 2.25% NSR
25 Eagle Victoria Gold Canada Construction 5% NSR until 97,500; 3% NSR thereafter
26 Hammond Reef Agnico Eagle Canada Development 1.5% NSR
27 Hermosa Arizona Mining United States Development 1% NSR on all sulphide ores of lead and zinc
28 Horne 5 Falco Resources Canada Development 1% NSR
29 Lamaque-Rocdor Eldorado Gold Canada Development 0.85% NSR
30 Malartic CHL (Odyssey) CM Partnership (Agnico Eagle, Yamana) Canada Exploration 3% NSR on all metals
31 Nimbus MacPhersons Resources Australia Development 100% Ag offtake
32 Upper Beaver / Kirkland Lake Agnico Eagle Canada Development 2% NSR
33 Windfall Osisko Mining Canada Development 1.5% NSR
34 Yenipazar Aldridge Mineral Turkey Development 50% Au offtake
Long-Term Development Royalties
35 Ambler NovaCopper US United States Development 1% NSR
36 Cameron Lake Cameron Gold Operations Canada Development 1% NSR
37 Casino Western Copper and Gold Canada Development 2.75% NSR
38 Cerro del Gallo Argonaut Gold Mexico Development 3% NSR
39 Copperwood & White Pine Highland Copper United States Development 3% NSR
40 Corcoesto Edgewater Exploration Spain Development 1% NSR
31Royalties, Streams and Offtakes – Complete List
Asset Name Operator Country Status Description
41 Gurupi (Centro Gold) Jaguar Mining Inc. Brazil Development 0.75% NSR Au
42 King Island King Island Scheelite Australia Development 1.5% GRR
43 Magdalena Basin Minera Sonora Borax S.A. de C.V. Mexico Development 3% GOR
44 Northern Dancer Largo Resources Canada Development 1% NSR Tungsten-Molybdenum
45 Ollachea Minera IRL Peru Development 1% NSR on all products
46 Rakkurijoki Prospect Hannans Reward Sweden Development 1.50% NSR Fe, Cu, Ag
47 Sandman 1 Newmont United States Development 5% NSR
48 Sandman 2 Newmont United States Development 1% NSR
49 São Jorge Braz. Res. Min. Ltda. and Min Regent Brasil Ltda. Brazil Development 1% NSR
50 Spring Valley Waterton Global United States Development Derivative Royalty of 1/7 interest in a sliding scale NSR royalty (Gold)
51 Tijirit Algold Resources Mauritania Development 1.5%
52 Unicorn Dart Mining Australia Development 2% NSR initial, 1% NSR Additional
Exploration Royalties
53 Abbeytown Erris Resources Ireland Exploration 1% NSR
54 Adel, Hardrock East Goldstream Minerals Canada Exploration 1.7% NSR
55 Altar Stillwater Mining San Juan Exploration 1% NSR
56 Annamaque Faraday Alexandria Minerals Canada Exploration 1.7% NSR
57 Antamina / Recauys Compañia Minera Antamina Peru Exploration 2.5% NSR
58 Apple (Uranium) Strateco Resources Canada Exploration 2% NSR
59 Aurbel QMX Gold Canada Exploration 2.125% NSR
60 Ballarat Castlemaine Goldfields Australia Exploration 4% GSR
61 Bargold Abcourt Mines Canada Exploration 1.275 % NSR
62 Bathurst and Québec Camps Osisko Metals Canada Exploration 1% NSR
63 Beaufor - Pascalis Monarques Gold Canada Exploration 25% NPI
64 Bonfortel Yorbeau Resources Canada Exploration 1.7% NSR
65 Candle Lake Adamas Minerals Corp. Canada Exploration 3% GOR
66 Casino B Cariboo Rose Resources Canada Exploration 5% NPI
67 Century / Lawn Hill MMG Australia Australia Exploration AUD 0.0055 /tonne Zn sold, 1% NSR for other minerals
68 Clearwater (1 claim) Eastmain Resources Canada Exploration 2% NSR
69 Croinor Monarques Gold Canada Exploration 0.75% NSR
70 Crowsnest Pass Crowsnest Pass Coal Mining Canada Exploration $1.00 per tonne of coal produced
71 Cumobabi Minera Geoinformatica S.A. Mexico Exploration 2% NSR
72 Destor Explor Resources Canada Exploration 2.125% NSR
73 Dieppe (Gold) Agnico Eagle Canada Exploration Resource Payment
74 Duncan (Iron) Augyva Mining Resources Canada Exploration Production royalty (iron), 2% NSR on all other metals
75 Eastbay Duparquet Explor Resources Canada Exploration 0.85% NSR
76 Eastmain (Gold) CBAY Minerals Canada Exploration 1.15% NSR royalty
77 Eastmain West Azimut Exploration Canada Exploration 1.4% NSR
78 El Tecolote Minera Piedra Azul, S.A. Mexico Exploration 2% NSR
79 Estacion Llano Minera Piedra Azul, S.A. Mexico Exploration 2% NSR
80 Gabel Wolfpack Gold United States Exploration 2% NSR on Precious Metals, 1% NSR on all other metals and minerals
81 Gabel Columbus Wolfpack Gold United States Exploration 1% NPI
32Royalties, Streams and Offtakes – Complete List
Asset Name Operator Country Status Description
82 Gabel Williams Wolfpack Gold United States Exploration 1% NPI
83 Gaffney Manitou Gold Canada Exploration 1.7% NSR on all metals
84 Gaffney Extension Manitou Gold Canada Exploration 0.10625% NSR on all metals
85 Gold Rock Monte Fiore Gold United States Exploration 2%-4% royalty for Au, Ag, Pt and Pd, 2% for other products
86 Holloway McDermott Kirkland Lake Canada Exploration 12.75% NPI
87 Jonpol-Amos & Paramount Abcourt Mines Canada Exploration 2.125% NSR on all metals
88 Jubilee Merrex Gold Canada Exploration 1.7% NSR on all metals
89 Kan Extension Osisko Mining Canada Exploration 1.5%-3.5% NSR on precious metals, 2% NSR on all other products
90 Kliyul Creek Kiska Metals Canada Exploration 1.5% NSR
91 Lac Clark Chibougamau Independant Mines Canada Exploration 1% NSR
92 Lac Dufault (Base Metals) Nyrstar Canada Exploration 2% NSR
93 Landmark Wolfpack Gold United States Exploration 2% NSR on precious metals, 1% NSR of all other metals and minerals
94 Leitch Premier Gold Mines Canada Exploration 1.7% NSR on all metals
95 Lorraine/Dorothy/Jayjay Lorraine Copper, Teck Resources Canada Exploration 2% NSR
96 Los Chinos Minera Piedra Azul, S.A. Mexico Exploration 2% NSR
97 Malartic Gold Claims Khalkos Exploration Canada Exploration 1% NSR
98 Marban, Nolartic, First Canadian Osisko Mining Canada Exploration 0.425%-1.7% NSR
99 Moore Lake Denison Mines Canada Exploration 2.5% NSR
100 Mt. Hamilton Mt. Hamilton United States Exploration 2% NSR on Au and Ag, 0.67% NSR on all other metals and minerals
101 New Jersey Zinc Database Kiska Metals Canada Exploration 0.5% Gross Royalty on coal, dia., oil, gas and salt, 0.5% NSR for other
102 Oracle Ridge Oracle Ridge Mining United States Exploration 3% NSR
103 Pandora CM Partnership (Agnico Eagle, Yamana) Canada Exploration 2% NSR on all metals
104 Peat (Barunga) Australia Pacific LNG Australia Exploration 1.75% GOR
105 Pipestone Clavos Sage Gold Canada Exploration 1.7% NSR on all metals
106 Pozo de Nacho Azure Minerals Mexico Exploration 2% NSR
107 Preissac Sphinx Resources Canada Exploration 2% NSR
108 Rattlesnake Hills GFG Resources (US) United States Exploration 0.5% NSR
109 Renault Bay Vantex Resources Canada Exploration 1.7% NSR on all metals
110 Reward / Myrtle Teck Australia Pty Australia Exploration 2% NSR
111 Sabourin Creek (Akasaba) Agnico Eagle Canada Exploration 2.125% NSR on all metals
112 Sagar (Uranium, Gold) Energizer Resources Canada Exploration 1.5% NSR
113 San Juan Azure Minerals Mexico Exploration 2% NSR
114 Savard/Emerald Lake Northern Nickel Mining Canada Exploration 1.275% NSR on all metals
115 Silver Swan 1 Poseidon Nickel Atlantis Australia Exploration 3% NSR on Au and Ag
116 Silver Swan 2 Poseidon Nickel Atlantis Australia Exploration 1.75% NSR on Cu, Ni, PGMs and other metals (excluding Au and Ag)
117 Sleitat and Coal Creek Strongbow Exploration United States Exploration 1.75% NSR on all metals
118 Stabell (Gold) Alexandria Minerals Canada Exploration 3% NSR
119 Swedish Properties Erris Resources Sweden Exploration 1% NSR
120 Tantale Erlandson (Rare Earth) Commerce Resources Canada Exploration 1% NSR
121 Taylor Silver Predator United States Exploration 0.5%-2.0% NSR for precious metals and other minerals
122 Teck Hughes Kirkland Lake Canada Exploration 0.85% NSR on all metals
123 Tintaya (Rifas) Glencore Peru Exploration 1.5% NSR
33Royalties, Streams and Offtakes – Complete List
Asset Name Operator Country Status Description
124 Tonkin Springs McEwen Mining United States Exploration 1.4% NSR
125 Trail Wolfpack Gold United States Exploration 2% NSR on precious metals, 1% NSR on all other metals and minerals
126 Treasure Hill Silver Predator US Holdings United States Exploration 1% NPI
127 Turgeon Yorbeau Resources Canada Exploration 1.7% NSR on all metals
128 UNR Wolfpack Gold United States Exploration 2% NSR on precious metals, 1% NSR on all other metals and minerals
129 Valco Osisko Mining Canada Exploration 1.7% NSR on all metals
130 Val-d'Or Alexandria Minerals Canada Exploration 2.125% NSR on all metals
131 Valdora Alexandria Minerals Canada Exploration 1.7% NSR on all metals
132 Waihi West Antipodes Gold New Zealand Exploration 2% NSR
133 West Desert / Crypto InZinc Mining United States Exploration 1.50% NSR Zn, Cu, In, Mg
134 Wharekirauponga (WKP) Project Antipodes Gold New Zealand Exploration 2% NSR
135 Whistler GoldMining United States Exploration 2.75% NSR
136 WO Claims Peregrine Diamonds Canada Exploration 8248567 Canada Limited: 1% GOR
34Mineral Reserves and Resources
CANADIAN MALARTIC1 ISLAND GOLD3
RESERVES RESERVES
CATEGORY AU GRADE (G/T) AU (M OZ) TONNES (MT) CATEGORY AU GRADE (G/T) AU (K OZ) TONNES (KT)
Proven 0.95 1.52 50.0 Proven 8.68 159.8 573
Probable 1.15 4.86 131.0 Probable 9.31 592.4 1,978
Total Proven & Probable 1.10 6.38 180.8 Total Proven & Probable 9.17 752.2 2,551
GLOBAL RESOURCES (EXCLUDING RESERVES)
CATEGORY AU GRADE (G/T) AU (K OZ) TONNES (KT)
2
ÉLÉONORE Measured 4.94 5.35 33.5
RESERVES Indicated 6.01 86.10 445.5
CATEGORY AU GRADE (G/T) AU (M OZ) TONNES (MT) Total Meas. & Ind. 5.94 91.45 479.0
Total Proven & Probable 6.02 3.80 19.61 Inferred 10.18 995.7 3,042
GLOBAL RESOURCES (EXCLUDING RESERVES)
CATEGORY AU GRADE (G/T) AU (M OZ) TONNES (MT)
Total Meas. & Ind. 5.81 1.34 7.16
Inferred 7.31 1.99 8.45
1. Agnico Eagle and Yamana public disclosure – as at February 14, 2017
2. Goldcorp public disclosure – as at June 30, 2017
3. Alamos public disclosure – as at February 14, 2017
35Mineral Reserves and Resources
RENARD 1
AMULSAR 3
PROBABLE RESERVES* RESERVES*
GRADE (CPHT) CARATS (M) TONNES (MT) AU GRADE AG GRADE AU AG TONNES
CATEGORY
Total Probable 66.3 20.0 30.2 (G/T) (G/T) (M OZ) (M OZ) (MT)
Proven 0.8 4.6 1.2 6.6 44.7
*Estimated at a +1 DTC sieve size cut-off
Probable 0.8 3.3 1.4 6.1 57.9
Total P&P 0.8 3.9 2.6 12.7 102.7
GLOBAL RESOURCES (EXCLUDING RESERVES)
GRADE (CPHT) CARATS (M) TONNES (MT) GLOBAL RESOURCES (INCLUDING RESERVES)*
Total Indicated 46.0 2.8 6.1 AU GRADE AG GRADE AU AG TONNES
CATEGORY
Inferred 56.0 13.1 23.4 (G/T) (G/T) (M OZ) (M OZ) (MT)
Measured 0.8 4.7 1.4 7.7 51.5
2
BRUCEJACK Indicated 0.7 3.4 2.1 9.8 90.7
Total M&I 0.8 3.8 3.5 17.5 142.2
RESERVES* Inferred 0.6 3.3 1.3 7.6 72.2
AU GRADE AG GRADE AU AG TONNES *Au cut-off grade: 0.24 g/t; gold price - US$1,500/oz, silver price - US$25.00/oz
CATEGORY
(G/T) (G/T) (M OZ) (M OZ) (MT)
Proven 14.5 12.9 1.6 1.4 3.3
Probable 16.5 11.3 6.5 4.5 12.3
Total P&P 16.1 11.7 8.1 5.9 15.6
*NSR cut-off of C$180/t; gold Price - US$1,100/oz, silver Price - US$17.00/oz and a CAD:USD
FX rate of 0.92
GLOBAL RESOURCES (INCLUDING RESERVES)
AU GRADE AG GRADE AU AG TONNES
CATEGORY
(G/T) (G/T) (M OZ) (M OZ) (MT)
Measured 17.0 15.3 1.9 1.7 3.5
Indicated 17.3 15.0 7.2 6.2 13.0
Total M&I 17.2 15.0 9.1 7.9 16.4
Inferred 21.0 26.9 3.1 4.0 4.6
1. Stornoway public disclosure - as at February 6, 2017.
2. Pretium pubic disclosure - as at December 15, 2016.
3. Lydian public disclosure - as at February 27, 2017. 36Mineral Reserves and Resources
3
BACK FORTY 1 CASINO
GLOBAL RESOURCES* RESERVES*
CATEGORY AG GRADE (G/T) AG (M OZ) TONNES (MT) CU GRADE AU GRADE CU AU TONNES
CATEGORY
Measured 27.3 5.9 6.7 (%) (G/T) (B LBS) (M OZ) (MT)
Indicated 22.2 6.0 8.4 Proven 0.26% 0.4 0.7 1.8 123
Total M&I 24.5 11.9 15.1 Probable 0.17% 0.2 3.7 7.1 999
Inferred 26.5 2.0 2.3 Total P&P 0.18% 0.2 4.5 8.9 1,123
*NSR cut-off : US$27.78/oz Ag GLOBAL RESOURCES (INCLUDING RESERVES)*
CU GRADE AU GRADE CU AU TONNES
CATEGORY
2 (%) (G/T) (B LBS) (M OZ) (MT)
SEABEE Measured 0.26% 0.5 0.7 1.8 124
RESERVES* Indicated 0.18% 0.2 4.0 7.1 1,016
CATEGORY AU GRADE (G/T) AU (M OZ) TONNES (MT) Total M&I 0.20% 0.2 4.7 8.9 1,140
Proven 7.0 0.1 0.5 Inferred 0.14% 0.2 5.4 9.0 1,713
Probable 8.9 0.3 0.9 *Au cut-off grade: 0.25% Cu Eq. & 0.25 g/t Au. Table excludes silver and moly.
Total P&P 8.2 0.4 1.4
*Au cut-off grade: 4.92 g/t Seabee & 3.65 g/t Santoy
BALD MOUNTAIN 4
RESERVES*
GLOBAL RESOURCES (INCLUDING RESERVES)* CATEGORY AU GRADE (G/T) AU (M OZ) TONNES (MT)
CATEGORY AU GRADE (G/T) AU (M OZ) TONNES (MT) Proven 0.8 0.3 10.3
Measured 7.7 0.2 0.8 Probable 0.6 1.9 100.2
Indicated 8.1 0.4 1.4 Total P&P 0.6 2.1 110.5
Total M&I 8.0 0.6 2.2
*Gold Price: US$1,200/oz Au
Inferred 7.7 0.6 2.6
*Au cut-off grade: 4.40 g/t Seabee & 3.26 g/t Santoy GLOBAL RESOURCES (EXCLUDING RESERVES)*
CATEGORY AU GRADE (G/T) AU (M OZ) TONNES (MT)
Measured 0.6 0.5 24.9
Indicated 0.5 3.0 176.1
Total M&I 0.5 3.5 200.9
1. Aquila public disclosure - as at March 15, 2017.
Inferred 0.4 0.6 49.5
2. Silver Standard public disclosure - as at March 22, 2017. *Gold Price: US$1,400/oz Au
3. Western Copper and Gold disclosure - as at June 2017. 37
4. Kinross public disclosure - as at March 31, 2017.Mineral Reserves and Resources
Eagle1,2
RESERVES
CATEGORY AU GRADE (G/T) AU (K OZ) TONNES (MT)3
Proven 0.80 685 27
Probable 0.62 1,778 90
Total Proven & Probable 0.66 2,463 116
GLOBAL RESOURCES (EXCLUDING RESERVES)
CATEGORY AU GRADE (G/T) AU (K OZ) TONNES (KT)
Measured 0.81 761 29.4
Indicated 0.59 2,870 151.3
Total Meas. & Ind. 0.63 3,631 180.7
Inferred 0.49 276 17.4
Olive1,2
RESERVES
CATEGORY AU GRADE (G/T) AU (K OZ) TONNES (MT)3
Proven 1.02 58 2
Probable 0.93 142 5
Total Proven & Probable 0.95 200 7
GLOBAL RESOURCES (EXCLUDING RESERVES)
CATEGORY AU GRADE (G/T) AU (K OZ) TONNES (KT)
Measured 1.19 75 2.0
Indicated 1.05 254 7.5
Total Meas. & Ind. 1.08 329 9.5
Inferred 0.89 210 7.3
1. Victoria Gold Feasibility Study – September 12, 2016
2. Mineral resources are inclusive of mineral reserves
3. Numbers may not add up due to rounding 38You can also read