2019 INVESTOR DAY MARCH 7, 2019 - OCEANAGOLD

Page created by Zachary Craig
 
CONTINUE READING
2019 INVESTOR DAY MARCH 7, 2019 - OCEANAGOLD
2019 Investor Day
March 7, 2019

CONSISTENTLY DELIVERING ON COMMITMENTS

INNOVATION I PERFORMANCE I GROWTH
2019 INVESTOR DAY MARCH 7, 2019 - OCEANAGOLD
2
Cautionary and Technical Statements
Cautionary Notes - Information Purposes Only
The information contained in this presentation is provided by OceanaGold Corporation (“OGC”) for informational purposes only and does not constitute an offer to issue or arrange to issue, or the solicitation of an offer to issue, securities of OGC or
other financial products. The information contained herein is not investment or financial product advice and has been prepared without taking into account the investment objectives, financial situation or particular needs of any particular
person. The views, opinions and advice provided in this presentation reflect those of the individual presenters only. No representation or warranty, express or implied, is made as to the fairness, accuracy, completeness or correctness of the
information, opinions and conclusion contained in this presentation. To the maximum extent permitted by law, none of OGC or any of its directors, officers, employees or agents accepts any liability, including, without limitation, any liability arising
out of fault or negligence, for any loss arising from the use of the information contained in this presentation. Furthermore, this presentation does not constitute an offer of shares for sale in the United States or to any person that is, or is acting for
the account or benefit of, any U.S. person (as defined in Regulation S under the United States Securities Act of 1933, as amended (the "Securities Act")) ("U.S. Person"), or in any other jurisdiction in which such an offer would be illegal. OGC’s shares
have not been and will not be registered under the Securities Act.

Cautionary Statement Concerning Forward Looking Information
Certain information contained in this presentation may be deemed “forward-looking” within the meaning of applicable securities laws. Forward-looking statements and information relate to future performance and reflect OGC’s expectations
regarding the generation of free cash flow, execution of business strategy, future growth, future production, estimated costs, results of operations, business prospects and opportunities of OGC and its related subsidiaries. Any statements that
express or involve discussions with respect to predictions, expectations, beliefs, plans, projections, objectives, assumptions or future events or performance (often, but not always, using words or phrases such as “expects” or “does not expect”, “is
expected”, “anticipates” or “does not anticipate”, “plans”, “estimates” or “intends”, or stating that certain actions, events or results “may”, “could”, “would”, “might” or “will” be taken, occur or be achieved) are not statements of historical fact and
may be forward-looking statements. Forward-looking statements are subject to a variety of risks and uncertainties which could cause actual events or results to differ materially from those expressed in the forward-looking statements and
information. They include, among others, the accuracy of mineral reserve and resource estimates and related assumptions, inherent operating risks, and those risk factors identified in OGC’s most recent annual information forms prepared and filed
with securities regulators which are available on SEDAR at www.sedar.com under OGC’s name.
There are no assurances OGC can fulfil forward-looking statements and information. Such forward-looking statements and information are only predictions based on current information available to management of OGC as of the date that such
predictions are made; actual events or results may differ materially as a result of risks facing OGC, some of which are beyond OGC’s control. Although OGC believes that any forward-looking statements and information contained in this presentation
are based on reasonable assumptions, readers cannot be assured that actual outcomes or results will be consistent with such statements. Accordingly, readers should not place undue reliance on forward-looking statements and information. OGC
expressly disclaims any intention or obligation to update or revise any forward-looking statements and information, whether as a result of new information, events or otherwise, except as required by applicable securities laws. The information
contained in this release is not investment or financial product advice.

Technical Disclosure
Mineral Resources for Macraes have been verified and approved by, or are based upon information prepared by or under the supervision of S. Doyle; that relating to Waihi by P. Church; that relating to Didipio by J. G. Moore; and that relating to
Macraes by P. Doelman for open pit and T. Maton for the underground. Mineral Reserves for Macraes have been verified and approved by, or are based upon information prepared by, or under the supervision of, P. Doelman for open pit and T.
Maton for the underground; for that relating to Waihi by T. Maton for open pit and D. Townsend for underground; and that relating to Didipio by C. Fawcett. The Mineral Reserves and Resources for Haile have been verified and approved by, or are
based upon information prepared by or under the supervision of B. van Brunt.
Information relating to Macraes exploration results in this presentation has been verified by, is based on and fairly represents information compiled by or prepared under the supervision of H. Blakemore; information relating to Waihi exploration
results by L. Torckler; information relating to Didipio exploration results by J. Moore; and information relating to Haile exploration results by J. Jory.
 P. Church, P. Doelman, S. Doyle, J. Jory, J. G. Moore, and T. Maton and are Members and Chartered professionals with the Australasian Institute of Mining and Metallurgy while H. Blakemore is a member of the Australian Institute of Geoscientists
(AIG). Messrs Blakemore, Church, Doelman, Doyle, Jory, Moore, and Maton have sufficient experience, which is relevant to the style of mineralisation and type of deposits under consideration, and to the activities which they are undertaking, to
qualify as Competent Persons as defined in the 2012 Edition of the “Australasian Code for Reporting of Exploration Results, Mineral Resources and Ore Reserves” (“JORC Code”) and all are Qualified Persons for the purposes of the NI 43 101. Messrs
Blakemore, Church, Doelman, Doyle, Jory, Moore, and Maton are employees of OceanaGold, and they consent to the inclusion in this public presentation of the matters based on their information in the form and context in which it appears.
For further scientific and technical information (including disclosure regarding mineral resources and mineral reserves) relating the Macraes Operation, the Didipio Operation, the Waihi Operation and the Haile Operation, please refer to the NI 43-
101 compliant technical reports available at sedar.com under the Company’s name.

General Presentation Notes
All AISC and cash costs are net of by-product credits unless otherwise stated
All financials are denominated in US Dollars unless otherwise stated
2019 INVESTOR DAY MARCH 7, 2019 - OCEANAGOLD
3
Agenda
  INTRODUCTION

  COMPANY OVERVIEW & PERFORMANCE

  FINANCE OVERVIEW

  ESG PERFORMANCE & RATING

  STRATEGY & VALUE CREATION TRACK RECORD

  EXPLORATION

  OPERATIONS

  ORGANIC GROWTH

  WRAP-UP
2019 INVESTOR DAY MARCH 7, 2019 - OCEANAGOLD
4
       OceanaGold Management Team
                                                         PARTICIPATING IN TORONTO

Mick Wilkes                     Michael Holmes                 Cody Whipperman                    Mark Cadzow                         Sam Pazuki
President & CEO                Chief Operating Officer       EVP, Corporate Development        Chief Development Officer           VP, Investor Relations
  (joined 2011)                    (jointed 2012)                   (joined 2018)                    (joined 1991)                     (joined 2012)

                                                    PARTICIPATING IN AUSTRALIA

                  Scott McQueen                                    Sharon Flynn                                Craig Feebrey
                  Chief Financial Officer                      EVP, Social Performance &                        EVP, Exploration
                      (joined 2016)                           External Affairs (joined 2017)                     (joined 2015)
2019 INVESTOR DAY MARCH 7, 2019 - OCEANAGOLD
5
                     Portfolio of High Quality Assets
                                                                                                                                                                                        3.2

                                                                                                                                                                                   GOLD
                                                                                                                                                                                 RESERVES(*)

                                                                                                                                                                                       6.0
                                                                                                                                                                                       (Moz)
                                                                                                                                                                           1.2                       1.3
                                                                                                                                                                                       0.3

                                                                                  DENVER
                                                                                                                                                               HAILE       DIDIPIO             WAIHI             MACRAES

                                                                                                                                     HAILE
                                                                                                                                                                   3.3                                     0.6
                                                                                                                                                                                                          GOLD    0.3
                                     DIDIPIO                                                                                                                   GOLD M&I
                                                                                STRATEGIC                                                                                                               INFERRED
                                                                                INVESTMENTS &                                                                 RESOURCES(*)
                                                                                                                                                                                 1.4                   RESOURCES(*)
                                                                                JOINT VENTURES
                                                                                                                                                                   9.2                         0.8          2.8
                                                                                                                                                                   (Moz)                                    (Moz)
                                                                                                                                                                            0.9                                       1.1
                                                                                                                                                             3.6
                                                                                                       JOINT VENTURES
                        MELBOURNE                              WAIHI
                                                                                                                                                        COPPER (kt)                          SILVER (Moz)
                                                             MACRAES                                                                                    RESERVES: 150                        RESERVES: 3.57
                                                                                                                                                        M&I RESOURCES: 170                   M&I RESOURCES: 4.23
* NOTES
1.   For additional information on Resources, visit www.oceangold.com for Annual AIF, WKP Resource News Release & Waihi Updated Resource news release   INFERRED RESOURCES: 30               INFERRED RESOURCES: 0.6
2.   Reserves are included in the Measured & Indicated Resources
3.   Total Inferred Resources also include Blackwater
4.   Copper resource is exclusively from Didipio
5.   Reserves and resources have been rounded to one decimal
2019 INVESTOR DAY MARCH 7, 2019 - OCEANAGOLD
6
     Latest Achievements & Highlights

                OPERATIONS                                               FINANCIAL

▪   7 straight years of achieving guidance              ▪   Positive ROIC every year since 2011
▪   Exceptional performance at Macraes                  ▪   $121m in FCF generation
▪   Implementing technology                             ▪   Strong EBITDA Margins
▪   Strong environment & social performance             ▪   Cash balance growth, Net Debt reduction

             ORGANIC GROWTH                                             EXPLORATION

▪   Martha Underground Project consented                ▪   Martha Underground Resource increased
▪   Haile plant expansion advancing well                ▪   Significant initial Resource at WKP
▪   Haile larger pits & Horseshoe permitting underway   ▪   Exploration success at Macraes for further UG
▪   Didipio underground progressing well                    potential
2019 INVESTOR DAY MARCH 7, 2019 - OCEANAGOLD
%

SOURCE: Bloomberg
                                        -100
                                                                                                                 100

                                                                       0
                                                                                             20
                                                                                                  40
                                                                                                            80

                                               -80
                                                     -60
                                                           -40
                                                                 -20
                                                                                                       60
                       Kirkland Lake

                            Saracen

                        OceanaGold

                        Northern Star

                            Evolution

                         SSR Mining

                          St Barbara

                               Regis

                              Alacer

                            Harmony

                              Torex

                             B2Gold

                          Gold Fields

                            Centerra

                    Endeavour Mining

                           SEMAFO
                                                                                                                                                                                                                             Total Shareholder Return

                              Tahoe

                              Detour

                            Yamana
                                                                                                                       2018 TOTAL SHAREHOLDER RETURN

                             Kinross

                           IAMGOLD
                                                                           Average returns

                             Alamos

                               Hecla

                               Coeur

                             Sibanye

                            Eldorado
                                                                                                                                                       ONE OF THE TOP PERFORMING GOLD EQUITIES OVER THE PAST SEVERAL YEARS

                             Guyana

                           New Gold
                                                                                                                                                                                                                                                  7
2019 INVESTOR DAY MARCH 7, 2019 - OCEANAGOLD
8
                  Consistent Positive Performance
                         DELIVERING ON OUR COMMITMENTS & CONSISTENTLY PRODUCING POSITIVE RESULTS

                                                                                GUIDANCE PERFORMANCE
                                                                                                 (2011 to 2018)
                                                                                                    Hit   Miss
      18
      17
      16
      15
      14
      13
      12
      11
      10
       9
       8
       7
       6
       5
       4
       3
       2
       1
       0
      -1
      -2
      -3
      -4
      -5
      -6
      -7
      -8
      -9
                  ROXG
            OGC

                                                                                                                      NGD

                                                                                                                                        DGC

                                                                                                                                                                                             GUY
                                                                                                                                                                                 ALO

                                                                                                                                                                                       PVG
                                    BTO
                               KL

                                                                                                          AR

                                                                                                                                              TXG

                                                                                                                                                               IAG
                                                 AEM

                                                                   SSRM

                                                                                PG

                                                                                           TGZ
                                                                          DPM

                                                                                                                            NEM
                                                       CG

                                                            PAAS

                                                                                     EDV

                                                                                                    ASR

                                                                                                                                  AUY
                                                                                                                 HL
                         KGC

                                          GOLD

                                                                                                                                                    EGO

                                                                                                                                                          GG

                                                                                                                                                                     CDE

                                                                                                                                                                           AGI

                                                                                                                                                                                                   TMR
SOURCE: RBC Capital Markets
2019 INVESTOR DAY MARCH 7, 2019 - OCEANAGOLD
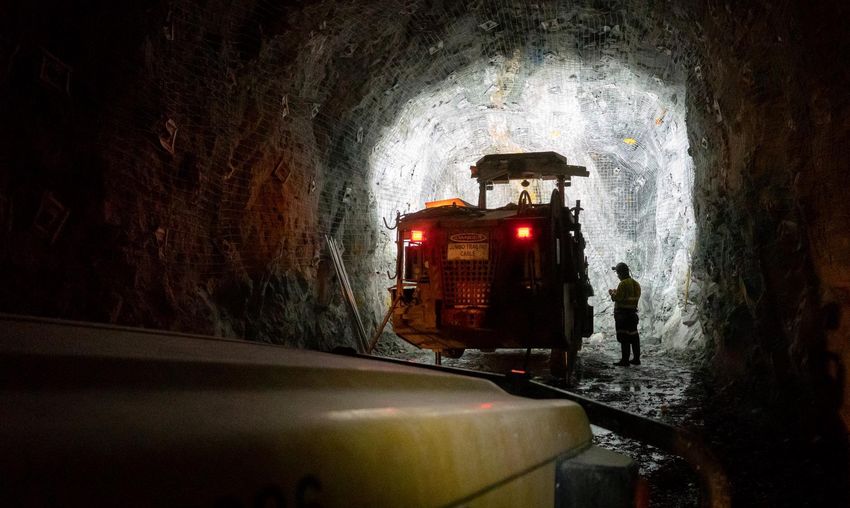
Waihi Underground, New Zealand   9

      FINANCIAL
      OVERVIEW
2019 INVESTOR DAY MARCH 7, 2019 - OCEANAGOLD
10
Balance Sheet Overview (as at 31 Dec 2018)
                                                      Year-on-Year                           Year-on-Year

                     CASH BALANCE
                                              CASH BALANCE                                   NET DEBT
                     $108m
   Total Liquidity   Excludes cash held in
                     marketable securities
                                                                     47%                            59%
       $158m
                     Credit Facility
                     (Undrawn)
                     $50m                            NET DEBT                              NET DEBT/EBITDA

                                                    $69 million
                                             Excludes cash held in marketable securities
                                                                                               0.19

                     Credit Facility
                     (Drawn)                   DISCRETIONARY DEBT REPAYMENTS IN 2018
                     $150m
     Total Debt
       $176m

                     Equipment Leases
                     $26m                      FIRST DIVIDEND OF 2019 APPROVED BY THE
                                                               BOARD
11
                  Industry Leading Margins & Returns
                                                      8 CONSECUTIVE YEARS OF DELIVERING A POSITIVE ROIC

                                         EBITDA MARGIN*                                                 RETURN ON INVESTED CAPITAL*

                                                     Peer Average                                                      Peer Average
         60%                                                                               20%

         50%
                                                                                           15%

         40%

                                                                                           10%
         30%

         20%
                                                                                           5%

         10%
                                                                                           0%
          0%

        -10%                                                                               -5%
                  2011        2012       2013        2014      2015   2016   2017   2018         2011    2012   2013   2014     2015   2016   2017   2018

Source: Bloomberg. 2018 data based on Company estimates
12
                      Capital Investment                                                                        Profile(1)
                            TOTAL CAPITAL INVESTMENT PROFILE                                                                     SUSTAINING CAPITAL PROFILE
                                                            (USDm)                                                                              (USDm)
                 300

                                                                                                                    100

                 200

                                                                                                                     50
                 100

                    0                                                                                                 0
                               2019E                 2020E                 2021E                 2022E                        2019E         2020E            2021E    2022E

                                 EXPLORATION CAPITAL PROFILE                                                                           GROWTH CAPITAL PROFILE
                                                            (USDm)                                                                                  (USDm)
                 50                                                                                                  150

                                                                                                                     100

                 25

                                                                                                                      50

                  0                                                                                                       0
                             2019E                  2020E                 2021E                 2022E                          2019E         2020E            2021E    2022E
Capital Investment profile in 2020 – 2022 are general ranges only and should not to be considered as guidance
13
                                         Haile Expansion Capital                                                                 Program(1)
                                                              HAILE EXPANSION CAPITAL PROFILE COMPARISON
                                                                                                                                                             (2)
                                                                   Actual Capex Invested                   Estimated Capital Investment   Technical Report
                                         120

                                         100

                                          80
               Capital Investment ($m)

                                          60

                                          40

                                          20

                                           0
                                               2018A                            2019E                                 2020E                  2021E                 2022E

1.   Haile Expansion capital program for 2020 to 2022 are general figures and are not to be used as formal guidance
2.   Refer to the Haile 43-101 Technical Report at www.oceanagold.com
14

Strategy & Value
Creation
15
Strategy

   DRIVE EFFICIENCY THROUGH                BOOST PERFORMANCE via NEW
   TECHNICAL EXCELLENCE &                   TECHNOLOGIES (e.g. Analytics,
   LEADERSHIP                                               Automation)

                               OCEANAGOLD
                              VALUE CREATION

                                        REDUCE BUSINESS RISK THROUGH
   ADVANCE ORGANIC GROWTH                        GEOGRAPHIC & ASSET
   OPPORTUNITIES                                      DIVERSIFICATION

                        EFFECTIVE MANAGEMENT &
  HIGH QUALITY ASSETS                               ROBUST BALANCE SHEET
                             ORGANISATION
16
                                        Creating Value and Real Growth
                                                     PRODUCTION GROWTH
                                                     Macraes        Reefton        Didipio      Waihi      Haile
                                                                                                                                   EBITDA GROWTH
                            700,000                                                                                                2018                                            per share
                                                                                                                                                                         $364M
                                                  per share
                            600,000                                                                                                                                                   20%
                                                       10%                                                                         2012
                                                                                                                                          $145M                                  (2012 to 2018)
                            500,000
                                               (2012 to 2018)
     Gold Production (oz)

                            400,000

                                                                                                                                   EARNINGS GROWTH
                            300,000

                                                                                                                                   2018                                            per share
                                                                                                                                                                   $0.20/sh
                            200,000

                                                                                                                                   2012
                                                                                                                                                                                   190%
                            100,000                                                                                                 $0.07/sh                                     (2012 to 2018)

                                 0
                                 2012          2013               2014              2015              2016           2017   2018
                                                                                                                                                   GOLD
                                                                                                                                                   PRICE                 24%
1.                    Reefton entered Closure in December 2016                                                                                    (2012 to 2018)
2.                    Per share is based on the fully diluted shares outstanding
3.                    EPS adjusted = Earnings after tax before gains/losses on undesignated hedges and impairments
17
                     M&A Track Record
                           DISCIPLINED, DILIGENT AND PATIENT IN OUR APPROACH TO EXTERNAL OPPORTUNITIES
                                                                2015                                            2015
                                                   WAIHI       ACQUISITION(1)      ROMARCO (HAILE) ACQUISITION(2)
                                                                (USDm)                                          (USDm)             SINCE Q4/17 –
                                                                                                                                   Dec 31/18
         ACQUISITION COST + DEVELOPMENT COST (if                                                                          $62
         applicable)
         ANALYST NAV
         CUMULATIVE FCF (since acquisition to
         Dec 31/18)
                                                                         $180

                                                                                                                         $759
                                                                                                $596

                                                    $101                 $130

                                                WAIHI RESOURCE GROWTH                           HAILE RESERVES
                                                                 (koz)                                          (koz)
         M&I RESOURCE                                                                                                     321
                                                                                   P&P RESERVES
         INFERRED RESOURCE

         DEPLETION
                                                                          429      DEPLETION (after recovery)

                                                                         1088                                            3460
                                                                                               2020
                                                      380                905
                                                     101
1.   Waihi Acquisition closed Nov 2015              Original             Current               Original                  Current
2.   Romarco Acquisition closed Oct 2015
18
      Building Pipeline of Opportunities
                              ABILITY & COMMITMENT TO INVEST COUNTERCYCLICALLY

            2015                                      2016
GSV STRATEGIC INVESTMENT             NUG STRATEGIC INVESTMENT                  SIGNED JOINT VENTURES
           (million)                                 (million)

                        BOOK VALUE    MARKET VALUE
                                                                       Mirasol Resources
                                                                       ▪   LaCurva – Argentina
                                                                       ▪   Claudia – Argentina
                                                                       Bravada Gold
                       C$68                 C$7
                                                                 C$6
                                                                       ▪   Highland Project – Nevada
                                                                       Renaissance Gold
    C$29
                                                                       ▪   Fat Lizard – Nevada
                                                                       ▪   Spring Peak - Nevada

                         Return on investment
                                                                       ADDITIONAL JV OPPORTUNITIES UNDER
                                 105%                                           CONSIDERATION
19
      Organic Growth Plan Progressing Well
             VALUE CREATING ORGANIC GROWTH INITIATIVES ARE FALLING INTO PLACE

MARTHA UNDERGROUND PROJECT           WKP (NEW ZEALAND)                HAILE EXPANSION

      PERMIT RECEIVED;               INITIAL RESOURCE           PLANT EXPANSION ADVANCING
   IMPLEMENTING PROJECT                 ANNOUNCED                         WELL

   EXTENSIVE EXPLORATION          INCREASED EXPLORATION         PERMITTING LARGER PITS &
         ONGOING                         BUDGET                HORSESHOE UG PROGRESSING
Santa Cruz, Argentina   20

GROWTH
THROUGH
EXPLORATION
21
        Exploration Overview
              GEOGRAPHIC DIVERSITY - OPERATING AND EXPLORING IN MULTIPLE GOLD BELTS

                                                                        2019 Exploration Plan
                                                                        ▪   US$40 - $50 million / year
                                                                        ▪   150,000 metres / year
                                                                        ▪   High-grade LS Epithermal
                                                                        ▪   High-grade Orogenic
                                                               HAILE
                                    GREAT BASIN             CAROLINA
    DIDIPIO                                                 TERRANE
                                    GSV EQUITY
CAGAYAN VALLEY                      NUL EQUITY
PHILIPPINE FAULT ZONE               HIGHLAND JV
                                    SPRING PEAK JV
                                    FAT LIZARD JV

                                           WAIHI
                                                                  LA CURVA JV
                                        COROMANDEL                CLAUDIA JV
                        MACRAES         VOLCANIC ZONE
                                                               DESEADO MASSIF
                    OTAGO TERRANE
22
Further Opportunities for Discovery
           BUILDING A PIPELINE OF OPPORTUNITIES
23

Environment
Social
Governance
24
         OceanaGold ESG Approach
   WE VIEW RESPONSIBLE MINING AS NOT ONLY A RISK MANAGEMENT TOOL BUT ALSO AN OPPORTUNITY

▪ Proactive management of                                                     ▪ External reporting
                                              Responsible Mining
   environmental & social impacts                                             ▪ External engagement

                                                                 RISK
                                    OPPORTUNITY
                                                              MANAGEMENT

  ▪ Continuous improvement                                  ▪ Ongoing engagement
  ▪ Attract new investors                                   ▪ Maintain/improve risk profile
  ▪ Enhance reputation                                      ▪ Maintain shareholder base
25
                      Solid ESG Program & Performance
                          TOP 3 ESG RATING IN MSCI ESG RATINGS FOR 2018 IN THE PRECIOUS METALS INDUSTRY(1)

     ▪ Significant ESG experience                                                                          ▪ Strong engagement with stakeholders
                                                                         BOARD AND MANAGEMENT
     ▪ Alignment of values                                                                                 ▪ Environmental stewards

                            Our Values                                              Our Vision                          Our People

     ▪ Doing things the right way
                                                                       ▪ Template for responsible mining   ▪ High performing team
     ▪ Leveraging local benefits that build
                                                                       ▪ Employer / company of choice      ▪ Display Our Values
          capacity
                                                                       ▪ Go where the gold is              ▪ Focused on achieving Our Vision
     ▪ Ranked 3RD in MSCI ESG ratings (1)
1.    2018 MSCI ESG Rating, against 10 largest precious metals peers
26
          Environmental Management
          PROVEN TRACK RECORD OF OPERATING TO THE HIGHEST OF ENVIRONMENTAL STANDARDS

                                                         COMPREHENSIVE ENVIRONMENT
                                                     ✅
                                                         MANAGEMENT STANDARDS

                                                         COMPREHENSIVE MINE PLANNING &
                                                     ✅
                                                         INTERACTIVE MINE CLOSURE

Macraes, New Zealand

                                                     ✅   PROGRESSIVE REHABILITATION

                           Reefton Rehabilitation,
                           New Zealand

                                                         ROBUST WASTE & WATER MANAGEMENT
                                                     ✅
                                                         PLANS

                                                         SEVERAL KEY ACCOLADES & AWARDS
                                                     ✅
                                                         RECEIVED
27
Growing Our People
      ATTRACT AND DEVELOP THE BEST PEOPLE IN THE INDUSTRY

                                                 EFFECTIVE LEADERSHIP
                                              BECOME THE COACH

                                                    EMBRACE DIVERSITY
                                              2,068 EMPLOYEES - 16% WOMEN

                                            BE A VALUES BASED ORGANISATION

                                              RESPECT           INTEGRITY

                                             TEAMWORK           INNOVATION

                                              ACTION         ACCOUNTABILITY
28

   NEW ZEALAND
   OPERATIONS

                                        Waihi
                    Auckland

                       Wellington

Macraes
                         Christchurch

          Dunedin
29
                 Waihi Gold Mine North Island, New Zealand
                          MEASURED & INDICATED RESOURCES(1)                                                            INFERRED RESOURCES(1)
                                                        (KOZ)                                                                          (KOZ)

                                                                      331
                                                                                                                                                    667
                                                                                              234
                170                        170                                                                                                                            401
                                                                                                             10            10
               Open Pit                 Underground             Martha Underground (2)            WKP (3)   Open Pit    Underground            Martha Underground
                                                                                                                                                                    (2)
                                                                                                                                                                          WKP
                                                                                                                                                                                (3)

                                                                                            ANALYST CONSENSUS

                                                         LOW                             AVERAGE                                      HIGH

                                                        ($2M)                             $130M                                   $429M

1.   As at 31 Dec 2018
2.   Martha Underground Resource based on 7 Mar 2019 news release
3.   WKP Resources based on 25 Feb 2019 news release
WAIHI – 2019 METRICS                                                                                                           30

                                               2019 GUIDANCE

                             GOLD PRODUCTION        oz          60,000 – 70,000
                             CASH COSTS         per oz sold       $740 – $790
                             AISC               per oz sold       $875 – $925

  2019 MINING                                        2019 UNIT COSTS (USD)

  TONNES MINED        kt     500 – 520               UG MINING COSTS            $/t mined    55.00 – 60.00
  GRADES MINED      AU g/t    5.3 – 5.4              PROCESSING COSTS           $/t milled   30.00 – 35.00
  2019 PROCESSING                                    SITE G&A COSTS             $/t milled   20.00 – 25.00
  TONNES MILLED       kt     500 – 520               2019 CAPITAL PROGRAM

  HEAD GRADE        AU g/t    4.7 – 4.9              GENERAL OPERATING           USDm             2–3
  RECOVERIES        AU %       85 – 87               CAPITALISED MINING          USDm             3–5
                                                     EXPLORATION                 USDm            15 – 20
                                                     GROWTH                      USDm            15 – 20

                                                 Mining unit costs are inclusive of pre-stripping & capitalised mining costs
31
                         Martha Underground Project
                                                                          MARTHA UNDERGROUND PROJECT APPROVED TO PROCEED

     1025m
     RL                                                                   Martha Open Pit

                        Rex Vein                                                                         Martha Vein
                                                                                      920 Drill Drive
                               Edward Vein

                                         800 Drill Drive                                                          Empire vein
                                                                        Royal Vein

     500m
     RL

1.   Underground resources are reported below the consented Martha Phase 4 open pit design within conceptual underground mining shapes and at a gold price of NZD$2,083/oz. Provision has been made for dilution and
     mining recoveries. The tabulated resources are estimates of metal contained as troy ounces of gold and do not include allowances for processing. All figures are rounded to reflect the relative accuracy and confidence of the
     estimates and totals may not add correctly. There is no certainty that Mineral Resources that are not Mineral Reserves will be converted to Mineral Reserves
2.   Exploration Target is outlined as a potential volume of between 5 million and 8 million tonnes at a grade of between 4.0 g/t and 6.0 g/t gold, inclusive of reported Indicated and Inferred Mineral Resources. Insufficient
     exploration work has been conducted to date to define a mineral resource of this magnitude and it is uncertain if further exploration will result in the delineation of additional mineral resources. The exploration target is
     conceptual in nature and is based on the assessment of surface and underground drilling data collected by the Company as well as historical and archived geological and mining data from over a century of mining activity at
     Waihi.. Refer to OceanaGold news release dated 9 August 2018 for additional information.
32
                         Martha Underground Resource Growth
                                                                          MARTHA UNDERGROUND PROJECT APPROVED TO PROCEED

                                                                                                                                                                                                                                                                                    (1)
                                                                                                                                                                                                          MARTHA UG RESOURCE GROWTH
                                                                                                                                                                                                                              M&I Resource           Inferred Resource
                                                                                                                                                                                                    800

                                                                                                                                                                                                    700                                                                        667

                                                                                                                                                                                                    600

                                                                                                                                                                                  Thousand Ounces
                                                                                                                                                                                                    500

                                                                                                                                                                                                    400
                                                                                                                                                                                                                                                              339        330
                                                                                                                                                                                                    300

                                                                                                                                                                                                    200
                                                                                                                                                                                                                                               140     140
                                                                                                                                                                                                    100
                                                                                                                                                                                                                                       20
                                                                                                                                                                                                      0
                                                                                                                                                                                                              2016                          2017          Aug-18           Mar-19

1.   Underground resources are reported below the consented Martha Phase 4 open pit design within conceptual underground mining shapes and at a gold price of NZD$2,083/oz. Provision has been made for dilution and
     mining recoveries. The tabulated resources are estimates of metal contained as troy ounces of gold and do not include allowances for processing. All figures are rounded to reflect the relative accuracy and confidence of the
     estimates and totals may not add correctly. There is no certainty that Mineral Resources that are not Mineral Reserves will be converted to Mineral Reserves
2.   Exploration Target is outlined as a potential volume of between 5 million and 8 million tonnes at a grade of between 4.0 g/t and 6.0 g/t gold, inclusive of reported Indicated and Inferred Mineral Resources. Insufficient
     exploration work has been conducted to date to define a mineral resource of this magnitude and it is uncertain if further exploration will result in the delineation of additional mineral resources. The exploration target is
     conceptual in nature and is based on the assessment of surface and underground drilling data collected by the Company as well as historical and archived geological and mining data from over a century of mining activity at
     Waihi.. Refer to OceanaGold news release dated 9 August 2018 for additional information.
33

                    Initial Resource at WKP (WHAREKIRAUPONGA)
                                     NEWLY DISCOVERED HIGH-GRADE MINERALISATION IN NEW ZEALAND

                                                                                             INDICATED RESOURCE(1)                INFERRED RESOURCE(1)

                                                   Dome Field                            GOLD: 234,000 oz                     GOLD: 401,000 oz
                                                     North
                                                                                         SILVER: 296,000 oz                   Silver: 568,000 oz
                                                           Dome Field                    ▪   0.41 Mt @ 18.0 g/t Au            ▪   1.05Mt @ 11.9 g/t Au
                                                             South
                                                                                         ▪   0.41 Mt @ 22.7 g/t Ag            ▪   1.05Mt @ 16.8 g/t Ag

                                                                                Ohui
                                                                                                       RECENT SIGNIFICANT INTERCEPTS FROM
                                                             Twin Hills                                        EAST GRABEN VEIN(1)
                                                                          White Bluffs

                                                                                                   ▪   8.7 metres @ 24.5 g/t gold, 32.0 g/t silver
                                                                  Glamorgan

                                                                                                   ▪   5.0 metres @ 39.0 g/t gold, 76.6 g/t silver
                                                            Hauraki (WKP)
                                                               Golden Cross
                                                                                                   ▪   10.2 metres @ 19.2 g/t gold, 20.0 g/t silver
                                                                     Waihi North                   ▪   9.0 metres @ 21.2 g/t gold, 24.4 g/t silver
                                                              Karangahake
                                                                                WAIHI              ▪   3.6 metres @ 35.8 g/t gold, 43.3 g/t silver
1.   Refer to OceanaGold news releases dated 25 Feb 2019, 12 Feb 2019 & 9 July 2018
34
WKP Exploration
  CURRENT DRILLING FOCUSSED ON EAST GRABEN VEIN – SIGNIFICANT UPSIDE

                                                               T STREAM VEIN

                                                             EAST GRABEN VEIN

        Veins open along strike                                WESTERN VEIN
35
                      WKP Drilling To Date
                                                                                                                                                  East Graben Vein Long section

                                                                                                                                              open                                      open

                                                                                                                                              CURRENT EAST GRABEN VEIN PARAMETRES(1)

                                                                                                                                         ▪   Avg. width: 5 metres (1)
                                                                                                                                         ▪   Avg. grade: 16.0 g/t Au(1)
                                                                                                                                         ▪   Strike: 1,000m & open in both directions
                                                                                                                                         ▪   Vertical: 200m, open 100-200m up-dip
1.   Average width and grade of the East Graben vein target have been calculated based on all intercepts to date (20) in the preferred
     undifferentiated rhyolite host(refer to OceanaGold news release dated 25 Feb 2019).
36
  Waihi Plan
MARTHA UNDERGROUND PROJECT

                             PERMITS RECEIVED & DETAILED DESIGN UNDERWAY

                             RAPID DEVELOPMENT PLANNED

                             EXTENSIVE DRILLING CONTINUING

     WKP (NEW ZEALAND)

                             CONTINUED EXTENSIVE EXPLORATION

                             ADVANCE TO PERMITTING PHASE

                             STUDY WORK
37
                     Analyst Consensus
                                                                                  CONSENSUS NAV / TAKE-OUT PRICE
                                                                                                     (USDm)
                                800

                                600
                                               685                      627
                         USDm

                                400
                                                                                               539

                                200
                                                                                                                      357                   329                 151

                                  0
                                             Lakeshore                 Richmont               Wesdome                 Integra               Claude               Waihi

                                                     Lakeshore(1)                 Richmont              Wesdome                   Integra            Claude              Waihi(2)
     Au M&I Reserves (Moz)                                      0.4                  0.8                    0.4                       -                 0.2                0.3
     Au M&I Resources(3) (Moz)                                  0.9                  0.9                    2.8                      1.9                0.4                0.9
     Inferred Resources (Moz)                                   0.4                  1.0                   1.7(4)                    1.3                1.0                1.1
     Annual Production (koz)                             170 – 180                 87 – 93                72 – 80               123 (avg LOM)         65 – 72             100 ↑
     AISC ($/oz)
38
   Macraes Gold Mine South Island, New Zealand
                                                                       MEASURED & INDICATED
                                                                           RESOURCES(1)
                                                                                    (KOZ)
                       ANALYST CONSENSUS

   LOW              AVERAGE                        HIGH
                                                                       2765
                                                                                               840
   $60M               $156M                        $373M              Open Pit              Underground

                                                                      INFERRED RESOURCES(1)
                                                                                    (KOZ)

MINE LIFE                                  2021+
AVG OP GOLD RESERVE GRADE(1)    g/t        1.08                         743

AVG UG GOLD RESERVE GRADE(1)    g/t        2.12                                                 92
                                                                      Open Pit              Underground

                                                           1.   As at 31 Dec 2017
MACRAES – 2019 METRICS                                                                                                           39

                                                 2019 GUIDANCE

                               GOLD PRODUCTION        oz        175,000 – 190,000
                               CASH COSTS         per oz sold       $670 – $720
                               AISC               per oz sold     $1,000 – $1,050

  2019 MINING                                          2019 UNIT COSTS (USD)

                              OP: 50 – 55              OP MINING COSTS            $/t mined     1.10 – 1.20
  TONNES MINED       Mt
                              UG: 0.9 – 1.0            UG MINING COSTS            $/t mined    38.00 – 42.00
  STRIP RATIO       W/O           10:1                 PROCESSING COSTS           $/t milled    7.00 – 8.00
                             OP: 0.90 – 0.95           SITE G&A COSTS             $/t milled    2.00 – 2.20
  GRADES MINED      AU g/t
                              UG: 2.0 – 2.1
                                                       2019 CAPITAL PROGRAM
  2019 PROCESSING
                                                       GENERAL OPERATING           USDm            10 – 15
  TONNES MILLED      Mt         5.7 – 5.8
                                                       CAPITALISED MINING          USDm            30 – 35
  HEAD GRADE        AU g/t     1.15 – 1.20
                                                       EXPLORATION                 USDm             6–8
  RECOVERIES        AU %         82 – 84
                                                       GROWTH                      USDm             1–2
                                                   Mining unit costs are inclusive of pre-stripping & capitalised mining costs
40
                      Macraes Overview
         SIGNIFICANT RESOURCE OF 3.6 MOZ(1) OF GOLD REPRESENTS STRONG LEVERAGE TO THE GOLD PRICE

                                                                                                  TARGETING ORGANIC MINE LIFE EXTENSIONS

                                                                                              NEW MINE PLANNING DESIGNED TO UNLOCK RESERVES,
                                                                                                            ADDITIONAL MINE LIFE

                                                                                               CONTINUED EXPLORATION OF MACRAES GOLDFIELD

                                                                                            ROUND HILL PROJECT REPRESENTS POTENTIAL OPTIONALITY

1.   Total Measured & Indicated Resources. See OceanaGold 2017 AIF for additional details
41
                      Macraes Golden Point Drilling
                                                                                                              RECENT SIGNIFICANT
                                                                                                                 INTERCEPTS(1)

                                                                                                      ▪    15.0 metres* @ 4.3 g/t gold
                                                                                                      ▪    9.0 metres* @ 4.6 g/t gold
                                                                                                      ▪    9.0 metres* @ 3.9 g/t gold
                                                                                                      ▪    6.6 metres* @ 4.0 g/t gold
                                                                                                      *Downhole widths

                                                                                                                UNDERGROUND
                                                                                                                  POTENTIAL

1.   Refer to OceanaGold news release dated 22 October 2018 for additional details and information.
42
                    Macraes Redevelopment

                                                        ROUND HILL PROJECT RESOURCE(1)(2)

                                               M&I: 38.1 Mt @ 1.1 g/t Au  1.31 Moz
                                               Inferred: 5.8 Mt @ 1.0 g/t Au  190 koz

                                                          TECHNICAL STUDY IN PROGRESS

                                                 OBJECTIVE TO UNLOCK ROUND HILL & GOLDEN POINT
                                                    RESOURCE THROUGH RELOCATION OF PLANT

                                                    MINE LIFE EXTENSION POTENTIAL OF 10 YEARS

1.   As at 31 Dec 2017
2.   M&I Resources are inclusive of reserves
43
                 MICK
UNITED STATES
OPERATIONS

         Haile
44
               Haile Gold Mine South Carolina, United States
                                                                    MEASURED & INDICATED
          ANALYST CONSENSUS                                             RESOURCES(1)
                                                                               (KOZ)
              LOW                 AVERAGE                  HIGH

                                                                    2825
             $533M                  $728M                 $1,165M

                                                                                          495
                                                                    Open Pit           Underground

                                                                    INFERRED RESOURCES(1)
                                                                               (KOZ)

         MINE LIFE                                2033+
         AVG OP GOLD RESERVE GRADE(1)       g/t   1.61
                                                                     400
         AVG UG GOLD RESERVE GRADE(1)       g/t   4.38                                    200

                                                                    Open Pit           Underground

1.   As at 31 Dec 2017
HAILE – 2019 METRICS                                                                                                           45

                                               2019 GUIDANCE

                             GOLD PRODUCTION        oz        145,000 – 160,000
                             CASH COSTS         per oz sold       $540 – $590
                             AISC               per oz sold       $850 – $900

  2019 MINING                                        2019 UNIT COSTS (USD)

  TONNES MINED       Mt        25 – 30               OP MINING COSTS            $/t mined     2.30 – 2.40
  STRIP RATIO       W/O             5:1              PROCESSING COSTS           $/t milled   13.50 – 14.00
  GRADES MINED      AU g/t   1.45 – 1.55             SITE G&A COSTS             $/t milled    4.50 – 5.50
  2019 PROCESSING                                    2019 CAPITAL PROGRAM

  TONNES MILLED      Mt       3.1 – 3.2              GENERAL OPERATING           USDm            10 – 15
  HEAD GRADE        AU g/t   1.75 – 1.85             CAPITALISED MINING          USDm            10 – 15
  RECOVERIES        AU %       82 – 83               EXPLORATION                 USDm             3–5
                                                     GROWTH                      USDm            55 – 60

                                                 Mining unit costs are inclusive of pre-stripping & capitalised mining costs
46
                                          Opportunities for Improvement at Haile
                                                                  2018 RAINFALL AT HAILE
                                                                                                                                                                                                                                               WEATHER
18
16
14
                                                                                                                                                                                                                                               ▪   Severe storms and heavy sustained rainfall identified
12                                                                                                                                                                                                                                                 opportunities for improvement
10
8
                         Average historical monthly rainfall                                                                                                                                                                                   WORKFORCE
6
4
2
                                                                                                                                                                                                                                               ▪   Extensive recruitment campaigns in Western USA
0
                                                                                                                                                                                                                                               ▪   Addressing labour shortage
                                    February

                                                                                                                                                August
                                                       March

                                                                                                                                July
                                                                                           May

                                                                                                           June

                                                                                                                                                                   September

                                                                                                                                                                                        October

                                                                                                                                                                                                           November

                                                                                                                                                                                                                                    December
                                                                        April
            January

                                                                                                                                                                                                                                               PRODUCTIVITY
                                                                                                                                                                                                                                               ▪   Extensive maintenance program being implemented
                             SOUTH CAROLINA UNEMPLOYMENT RATE                                                                                                                                                                                  ▪   Upskilling the workforce
14

12
                                                                                                                                                                                                                                               ▪   Replacing mining fleet with larger equipment
10                                                                                                                                                                                                                                             ▪   Continued plant operator training
8

6
                                                                                                                                                                                                                                               GEOLOGY
4                                                                                                                                                                                                                                              ▪   Additional infill drilling in sparsely drilled areas
2                                                                                                                                        Lowest rate in 30 years
0
                                                                                            2001

                                                                                                                                                                                                                                       2018
     1990
            1991
                      1992
                             1993
                                         1994
                                                1995
                                                       1996
                                                               1997
                                                                      1998
                                                                             1999
                                                                                    2000

                                                                                                   2002
                                                                                                          2003
                                                                                                                  2004
                                                                                                                         2005
                                                                                                                                  2006
                                                                                                                                         2007
                                                                                                                                                2008
                                                                                                                                                         2009
                                                                                                                                                                2010
                                                                                                                                                                          2011
                                                                                                                                                                                 2012
                                                                                                                                                                                         2013
                                                                                                                                                                                                  2014
                                                                                                                                                                                                         2015
                                                                                                                                                                                                                      2016
                                                                                                                                                                                                                             2017
47
    2019 Mine Plan Summary

▪ Completing Mill Zone Q1

▪ Red Hill mining commenced

▪ Snake Pit approaching wider and
  higher grade ore zone

▪ Larger equipment fleet selected

▪ Contractor support for 2019 ramp up

▪ Core drilling in upper zones at Red
  Hill, Ledbetter and Haile
Upgrading Mining Fleet

▪ 1 PC 3000 Excavator
▪ 2 PC 4000 Shovels
▪ 13 Komatsu 730E’s over
  the next 12 months
  o Payload doubles existing
    fleet
▪ Caterpillar support gear
▪ New drills
49
Plant Performance Costs

 Costs
 ▪ Higher than anticipated labor requirement
 ▪   Extensive Regrind Maintenance
 ▪   Reagent consumption
      o Regrind Media consumption up to 8 times higher than budget
      o Detox higher reagent consumption
      o Higher Cyanide input costs (~20%)

 In 2019
 ▪ Manning - experience
 ▪   Major Shut in April 2019 (120hrs)
 ▪   Higher throughput will reduce input costs
 ▪   Addition of Tower/Isa will cut regrind maintenance/media consumption substantially ~ $0.50/t
 ▪   Improved automation will increase throughput rates and lower reagent consumptions
50
             Plant Expansion 2017 to 2020             Pebble Crusher
            Fingers/loader/grizzly

                                     Coarse ore bin                     Larger Flash
                                                                                                                               New Feedwell
                                                                        Cell

                                                                                                      Tower
 New                                                                                                  Mill
 Thickene                                                                                             Upgrade
 r

                                      Carbon Scout/Circuit Automation

Aeration                                                                Dual Screens                      Isa Mill Upgrade
Upgrade

                                                                                       New Feedwell
                                                                                                                       Additional
                                                                                                                       Tank/Reagen
                                                                                                                       t Upgrade
                Fully Automated
                Sequence

                                               Upgraded Screen
                                               Capacity
                                                                                                                       Increase Tails
                                                                                                                       Pumping
                                                                                                                       capacity
51
       Haile Plant Expansion
        HAILE PLANT EXPANSION PROJECT CONTINUES TO YIELD POSITIVE RESULTS

                                                                                          HAILE PLANT EXPANSION PROFILE(1)
                                                                             Actual Throughput     Estimated Throughput        Actual Production       Estimated Production

                                                                       5.0                                                                                                 250
                                                                                                              TARGET EXPANSION THROUGHPUT
                                                                                                              BETWEEN 3.5 – 4.0 MTPA
                                                                       4.5

                                                                       4.0                                                                                                 200

                                                                       3.5

                                            Annual Throughput (Mtpa)

                                                                                                                                                                                 Gold Production (koz)
                                                                       3.0                                                                                                 150
  INCREASE PLANT CAPACITY & ENHANCE PLANT
                                                                       2.5
               PERFORMANCE
                                                                       2.0                                                                                                 100

✅      INSTALL PEBBLE CRUSHER                                          1.5

                                                                       1.0                                                                                                 50

✅
                                                                       0.5
       INSTALL TOWER MILL
                                                                       0.0                                                                                                 0
                                                                                  2017A          2018A         2019E          2020E           2021E           2022E

 H1
2019
       INSTALL ISAMILL                                   1.              Refer to Haile 43-101 Technical Report located at www.oceanagold.com for additional details on Haile Expansion
                                                         2.              Refer to Cautionary Statements: 2019E production based on mid-point of guidance, 2020E – 2022E are
                                                                         approximate expectations and is not to be used as formal guidance
52
IsaMillTM
     TRANSITIONING TO LEADING TECHNOLOGY FOR REGRINDING

                                           ▪   Similar technology to what
                                               OceanaGold currently uses at
                                               Macraes
                                           ▪   Started commissioning – Feb 21/18
                                           ▪   3000 kW Motor
                                           ▪   2.5mm ceramic media
                                                 ▪   Large surface area
                                                 ▪   Better energy transfer
                                           ▪   Lower maintenance costs
                                           ▪   Efficient & effective
53
Upgraded Fine Grinding Circuit Construction

                           IsaMillTM

   Tower Mill
54
                Fine Grinding Enhancements
                                                                                                                                                 CYCLONE OVERFLOW
                                  FLOTATION TAIL GRADE

      1.0                                                                                                         2.0

      0.9                                                                                                         1.8

      0.8                                                                                                         1.6
                                                                                                                                                                       Tower Mill Startup
      0.7                                                                                                         1.4

      0.6                                                                                                         1.2

                                                                                                            g/t
g/t

      0.5                                                                                                         1.0

      0.4                                                                                                         0.8

      0.3                                                                                                         0.6

      0.2                                                                                                         0.4
                                                             Tower Mill Startup
      0.1                                                                                                         0.2

      0.0                                                                                                         0.0
       26-Nov   6-Dec    16-Dec     26-Dec      5-Jan   15-Jan      25-Jan       4-Feb    14-Feb   24-Feb          26-Nov       6-Dec   16-Dec   26-Dec   5-Jan   15-Jan   25-Jan     4-Feb   14-Feb   24-Feb

                                         FINAL TAIL GRADE
      0.6
                                                                                                                            ▪    Reduce top size of concentrate / lower
      0.5                                                                 Tower Mill Startup                                     product size
      0.4
                                                                                                                            ▪    Allow flash flotation to be fully utilised
                                                                                                                            ▪
g/t

      0.3
                                                                                                                                 Flotation recovery & mass pull already
      0.2
                                                                                                                                 improving
      0.1

      0.0
       26-Nov    6-Dec     16-Dec      26-Dec       5-Jan        15-Jan       25-Jan     4-Feb     14-Feb    24-Feb
55
2019 Process Plant Expansion Projects

  COMPLETE UPGRADED REGRINDING CIRCUIT – TOWER MILL & ISAMILL

  ADDITIONAL CYANIDE DESTRUCT UNIT

  ADDITIONAL PRE-AERATION THICKENER

  PUMPING & MOTORS UPGRADES

  OTHER ANCILLARY WORKS (eg. CARBON CIRCUIT AUTOMATION, TAILINGS SYSTEM
  UPGRADE)
56
                   Haile Expansion
                                                                                            HORSESHOE RESERVES

                                                                                                  Tonnes   Grade    Gold
                                                                                                    (Mt)    (g/t)   (Moz)

                                                                                Proven               -       -        -

                                                                                Probable           3.12    4.38     0.44

                                                                            TOTAL RESERVES         3.12    4.38     0.44

                                              MINING EXPANSION
                                                                                           HORSESHOE RESOURCES

                ✅             COMMENCE PERMITTING OF MINE EXPANSION                               Tonnes
                                                                                                    (Mt)
                                                                                                           Grade
                                                                                                            (g/t)
                                                                                                                    Gold
                                                                                                                    (Moz)

                                                                               Measured              -       -        -
                2021          HORSESHOE U/G
                                                                                Indicated          2.71    5.68     0.49

                                                                               TOTAL M&I
                                                                                                   2.71    5.68     0.49
                                                                              RESOURCES
                2021          EXPANDED OPEN PITS
                                                                                Inferred            1.2     5.0     0.20

1.   Refer to Haile 43-101 Technical Report located at www.oceanagold.com
2.   M&I Resources are inclusive of Reserves
UG Targets and Reserve Growth
                                                            N
                                            N

                                         1 km
Au grade (g/t)
  0.45 – 0.82
  0.82 – 1.25
                             Palomino
  1.25 – 5.00
  > 5.00                                Horseshoe UG extension
Haile Mineralisation Trends

                                                                                        Horseshoe

                                                         Ledbetter

                                                                                Snake
                                               Mustang

            Champion

                                Mill
                               Zone    Haile
                       Small                                         Palomino
                                                         Red
                                                         Hill

             601
Drilling Results Aug 2018 – Feb 2019
            New Areas of
            Mineralization

59
Snake West cross section, looking NE
61

PHILIPPINES
OPERATIONS
                     Didipio

       Manila

                Masbate

                               Davao
62
   Didipio Gold Copper Mine Luzon, Philippines
                                                                 MEASURED & INDICATED GOLD
 ANALYST CONSENSUS                                                     RESOURCES(1)
                                                                                    (KOZ)
   LOW                   AVERAGE                  HIGH
                                                           OP Cu: 85 kt
                                                           UG Cu: 81 kt

  $265M                   $492M                  $1,056M                                      1068
                                                                         327
                                                                      Open Pit              Underground

                                                                 INFERRED GOLD RESOURCES(1)
                                                                                    (KOZ)

MINE LIFE                                2032+
                                                            OP Cu: 0 kt
AVG GOLD RESERVE GRADE             g/t   1.00               UG Cu: 26 kt
                                                                                               289
AVG COPPER RESERVE GRADE           %     0.39
                                                                      Open Pit              Underground

                                                           1.   As at 31 Dec 2017
DIDIPIO – 2019 METRICS                                                                                                           63

                                                 2019 GUIDANCE

                             GOLD PRODUCTION          oz        120,000 – 130,000
                             COPPER PRODUCTION      tonnes        14,000 – 15,000
                             CASH COSTS           per oz sold       $420 – $470
                             AISC                 per oz sold       $625 – $675

  2019 MINING                                          2019 UNIT COSTS (USD)

  TONNES MINED       Mt       1.3 – 1.4                UG MINING COSTS            $/t mined        35 – 40
                    AU g/t   1.75 – 1.85               PROCESSING COSTS           $/t milled        6–7
  GRADES MINED
                    CU %     0.55 – 0.65               SITE G&A COSTS             $/t milled        5–6
  2019 PROCESSING
                                                       2019 CAPITAL PROGRAM
  TONNES MILLED      Mt             3.5                GENERAL OPERATING           USDm            10 – 15
                    AU g/t   1.25 – 1.35               CAPITALISED MINING          USDm                –
  HEAD GRADE        CU %
                             0.40 – 0.50
                                                       EXPLORATION                 USDm             2–3
                    AU %       88 – 90
  RECOVERIES        CU %
                               89 – 91                 GROWTH                      USDm            35 – 40

                                                   Mining unit costs are inclusive of pre-stripping & capitalised mining costs
64
Didipio Underground
 RAMP-UP OF UNDERGROUND PROGRESSING WELL, INCREASING MINING RATES IN 2019

                                             +19 MT OF ORE STOCKPILED FOR PROCESSING

                                                        INCREASING MINING RATES

                                             ▪   2018: 500 – 600 kt (actual: 627 kt)
                                             ▪   2019: 1.2 – 1.3 Mt
                                             ▪   2020 and beyond: 1.6 Mt

                                                 CONSTRUCTION OF PANEL TWO UNDERWAY

                                             POTENTIAL ADDITIONAL RESOURCES AT DEPTH

          Drilling at depth
65
Didipio Underground Technology
       IMPLEMENTED STATE-OF-ART TECHNOLOGY TO BOOST PRODUCTIVITY

  LIVE PRODUCTIVITY ANALYSIS             SURFACE REMOTE CONTROLLED UNDERGROUND
                                                         BOGGING
Now   Future                                   66

               Surface Electronic Tag Boards
67
Didipio Underground Technology

         Video SIMULATION
Macraes, New Zealand   68

      INVESTOR
      OVERVIEW
69
           Investor Overview
     LARGEST SHAREHOLDERS(1)
1    Van Eck (USA)                                                                 United
                                                                                   States                               EXCHANGES – TICKER
2    BlackRock (United Kingdom)                                                     49%
3    Franklin (USA)                                                                                     TORONTO (TSX)                                       OGC
4    Ingalls & Snyder (USA)
                                              Asia             Shareholder                              AUSTRALIA (ASX)                                     OGC
5    Dimensional Fund (USA)                   2%               Geographic
6    Royal Bank Investment (Canada)                           Composition(1)                            ADR(2)                                           OCANF
                                               ANZ
7    Vanguard (USA)                                                                   Canada
                                               11%
                                                                                       14%                          MARKET CAPITALISATION(3)
8    Commonwealth Bank (Australia)
9    Wellington   (USA)                                                                                 CAD 2.8 BILLION
                                                     Europe
10   Norges Bank (Norway)                             25%
                                                                                 Growth                 AUD 3.1 BILLION
11   Taylor Asset Management       (Canada)
                                                                                  28%
12   Tocqueville (USA)                         Other                                                    USD 2.1 BILLION
13   Ruffer (London)                            6%

14   Fidelity (USA)                           Hedge                                                                 TRADING LIQUIDITY (90-day)
                                               2%
15   Investec (United Kingdom)
                                                              Investor Type(1)                           TORONTO                                             90%
16   Ubique (Australia)
17   Gabelli (USA)                            GARP                                        Value          AUSTRALIA                                           10%
                                               6%                                         31%
18   Deutsche Bank (USA/Germany)
19   Sun Valley (Canada)                                                                          1.   As at 31 Jan 2019
                                                 Index                                            2.   OGC has not sanctioned or manages the ADRs associated with its company
                                                  27%                                                  common shares or CDIs
20   USAA (USA)                                                                                   3.   As at 22 Feb 2019
70

         Methodology Discrepancy TSX vs ASX
GLOBAL CONSENSUS (CDN)                               Analyst Target Prices (CAD)
                                                                             $5.75 x 2
 LOW                 AVERAGE     HIGH

                                                                             $5.40

                                                                             $5.25
 $3.64                   $4.70   $5.75                                       $5.20

CANADA CONSENSUS (CDN)                                                       $5.00

 LOW                 AVERAGE     HIGH
                                                                             $4.75
                                            $4.71

                                            $4.52                            $4.50
 $4.00                   $5.01   $5.75      $4.43
                                            $4.33
AUSTRALIA CONSENSUS (CDN)                $4.24 x 2

 LOW                 AVERAGE     HIGH
                                            $3.95                            $4.00

 $3.64                   $4.29   $4.71      $3.64
Notes for Analysts

▪   Mining units costs estimated and reported including pre-stripping & underground capitalised
    mining costs

▪   Royalties are included in cash costs

▪   Annual sustaining capital (maintenance capex, pre-stripping, UG capitalised mining) is
    general $80 to $100m a year

▪   Didipio revenue sharing is inclusive of corporate taxes, royalties, other taxes (e.g.
    withholding, VAT, business, excise, property, etc.), SDMP payments

▪   Depreciation costs as calculated on a unit of production basis
72

WRAP-UP
73
    2019 Priorities
                   GENERATE STRONG CASH FLOWS AND BUILD FOR THE FUTURE

                  OPERATIONS                                         GROWTH

▪   Continue improvement of safety leadership   ▪   Implement Martha Underground project
▪   Focus on mine and plant productivity        ▪   Advance the Haile mine & plant expansion plans
    improvements at Haile                       ▪   Continue construction of panel two at Didipio
▪   Implement innovative technologies               Underground

                  EXPLORATION                                       FINANCIAL

▪   Significantly increase reserves at Waihi    ▪   Disciplined capital allocation
▪   Increase mine life at Macraes               ▪   Maintain low leverage
▪   Sustain reserves at Haile                   ▪   Continue to deliver strong ROIC
▪   Establish ourselves in new gold provinces
    through joint ventures
Corporate Headquarters         Americas Corporate Office
Level 14, 357 Collins Street   Suite 350
                               4725 South Monaco Street
Melbourne, Victoria, 3000
                               Denver, Colorado, 80237
Australia                      United States of America
T: +61 3 9656 5300
F: +61 3 9656 5333
info@oceanagold.com

oceanagold.com
You can also read