Theoretical and Applied Fracture Mechanics - DORA 4RI
←
→
Page content transcription
If your browser does not render page correctly, please read the page content below
Theoretical and Applied Fracture Mechanics 117 (2022) 103191
Contents lists available at ScienceDirect
Theoretical and Applied Fracture Mechanics
journal homepage: www.elsevier.com/locate/tafmec
External surface cracked offshore pipes reinforced with composite repair
system: A numerical analysis
Zongchen Li a, b, *, Xiaoli Jiang a, Hans Hopman a
a
Department of Maritime and Transport Technology, Delft University of Technology, 2628 CD Delft, the Netherlands
b
Mechanical Systems Engineering, EMPA-Swiss Federal Laboratories for Materials Science and Technology, 8600 Duebendorf, Switzerland
A R T I C L E I N F O A B S T R A C T
Keywords: This paper conducts a numerical analysis on the external surface cracked steel pipes reinforced with Composite
Surface crack growth Repair System. A three-dimensional finite element (FE) model is developed to calculate the Stress Intensity
Finite element method Factor (SIF) of the surface crack, and the crack growth process is evaluated by the Paris’ law. The effect of FRP-
Composite repair system
to-steel interfacial bond condition on the SIF evaluation has been considered by incorporating the cohesive zone
Stress intensity factor
FRP-to-steel interfacial bond condition
modelling. Then the FE model is validated by the experimental results. Thereafter, major issues including
“interfacial bond condition” and “reinforcement effectiveness and influential parameters” have been discussed.
The results indicate the reinforcement effectiveness on reducing the SIF owes to the decreasing of stress
magnitude and the crack-bridging effect. Because of the crack-bridging effect, composite reinforcement performs
more efficiently on reducing the SIF at the surface point than at the deepest point of the surface crack. The
negative influence of the FRP-to-steel bond condition on the surface crack growth is not as significant as on
reinforcing through-thickness cracks. However, since the interfacial stiffness is sensitive to the adhesive thick
ness, choosing an ideal adhesive thickness to acquire a good reinforcement effectiveness and to avoid potential
interfacial bond failures is recommended.
1. Introduction structures over the past decades. The FE method assists users to better
understand the mechanism by analysing the structural mechanical
Metallic pipes act as the primary way for oil and gas transportation in behaviour (e.g., deformation, stress concentration), fatigue indicator
the offshore industry. However, they were prone to fatigue problems parameters (FIPs) such as Stress Intensity Factor (SIF) and J-integral
[1]: Under the long-term effect from dynamical loads, cracks frequently [7–10], and bond failures [11,12]. New methods such as extended-FEM
initiate from the surface of the metallic pipes and grow continually (XFEM) [13], S-version FEM [14], and the iso-geometric analysis (IGA)
[2,3]. Repairing needs to be implemented instantly on the surface method [15,16] have been developed as efficient alternatives for
cracked metallic pipes to maintain the structural integrity. In recently handling fatigue crack growth analysis. This paper chooses the tradi
decades, an advanced repairing technique—Composite Repair System tional FE method, which is although time consuming for both modelling
(CRS)—gained its popularity in the piping industry [4], by virtue of its and computation, it is still reliable and accurate for handling three-
cost-effective, time-efficient, secondary-damage free, and easy installa dimensional semi-elliptical crack analysis. Its accuracy of evaluating
tion [5]. In the separate study, external surface crack growth in offshore the FIPs has been validated, realizing the purpose of accurately pre
steel pipes reinforced with CRS has been experimentally investigated dicting the crack growth process reinforced with Fibre-Reinforced
[6]. The study has proved the effectiveness of composite reinforcement Polymer (FRP). In recent years, the effect of bond failures on crack
on improving the fatigue performance of surface cracked metallic pipes. growth when employing composite reinforcement has received
While the experimental study was restricted by the limited number of increasingly attention [17]. Cohesive zone modelling has been incor
specimens, and it was infeasible for conducting sub-structural analysis. porated into the FE model to analyse the bond condition and its influ
The finite element (FE) method has been extensively applied to the ence on the crack growth [11,12,18].
investigations of composite reinforcement on cracked metallic Though investigations on reinforcing through-thickness cracks,
* Corresponding author at: Mechanical Systems Engineering, EMPA-Swiss Federal Laboratories for Materials Science and Technology, 8600 Duebendorf,
Switzerland.
E-mail address: zongchen.li@empa.ch (Z. Li).
https://doi.org/10.1016/j.tafmec.2021.103191
Received 16 September 2021; Received in revised form 19 November 2021; Accepted 19 November 2021
Available online 23 November 2021
0167-8442/© 2021 The Author(s). Published by Elsevier Ltd. This is an open access article under the CC BY-NC-ND license
(http://creativecommons.org/licenses/by-nc-nd/4.0/).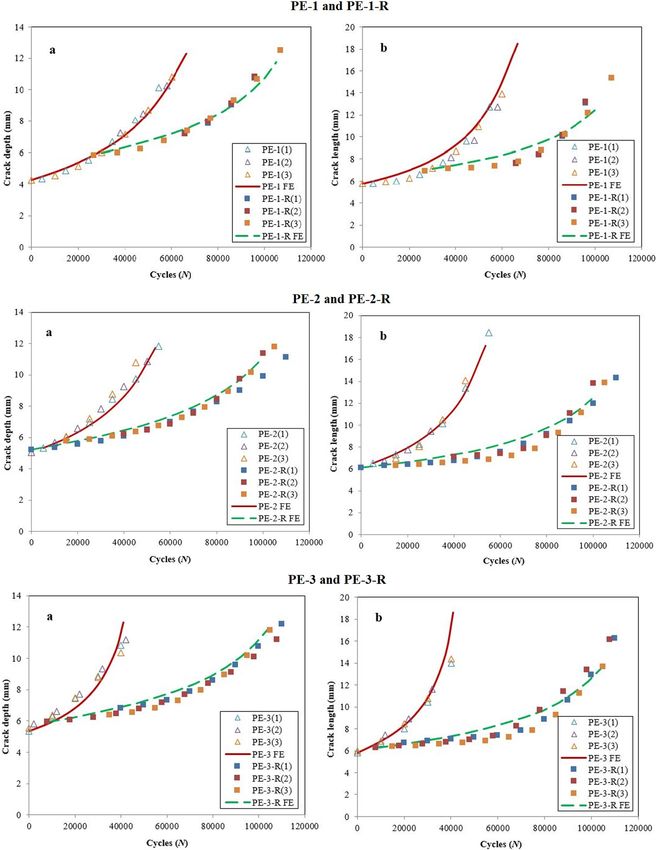
Z. Li et al. Theoretical and Applied Fracture Mechanics 117 (2022) 103191
Fig. 1. The sketch diagram of the composite reinforced surface cracked pipe specimens.
growth in steel pipes reinforced with composite is essential.
Table 1
Given those concerns, this paper conduct a FE analysis to investigate
Material properties of API 5L X65 steel.
the effect of composite reinforcement on the external surface crack
E (Pa) Y (Pa) T (Pa) v growth in metallic pipes. Section 2 develops a three-dimensional FE
206 × 109 4.48 × 10⁹ 5.3 × 10⁹ 0.3 model to evaluate the Stress Intensity Factor (SIF) of the surface crack,
followed by the experimental validation in Section 3. Section 4 analyses
Note: E is the tensile elastic modulus, Y is the yield strength, T is the tensile and discusses two major issues from the “interfacial bond condition” and
strength, v is the Poisson’s ratio.
the “reinforcement effectiveness and influential parameters” perspec
tives. Finally, Section 5 draws the main conclusions.
Table 2
Material properties of the GFRP. 2. Finite element modelling
E1 E2 E3 G12 G13 G23 v12 v13 v23
(Pa) (Pa) (Pa) (Pa) (Pa) (Pa) In this section, the FE models of surface cracked metallic pipes
reinforced with CRS are built. Within the FE model, FRP-to-steel inter
72 × 72 × 8× 4.7 × 4.7 × 3.5 × 0.28 0.28 0.08
facial bond condition is analysed by means of the cohesive zone
109 109 109 109 109 109
modelling, and its effect on the SIFs along the crack front is taken into
Note: Ei and Gij are the elastic modulus and shear modulus along different di consideration.
rections, vij is the Poisson’s ratio of the i-j plane.
2.1. Material properties and the interfacial properties
Table 3
Material properties of the CFRP. The sketch diagram of the FE model is shown in Fig. 1, indicating a
E1 (Pa) E2 E3 G12 G13 G23 v12 v13 v23
semi-elliptical surface crack embedded on the external surface of a steel
(Pa) (Pa) (Pa) (Pa) (Pa) pipe, located at the mid-span cross-section. Point A and B represent the
deepest point and the surface point of the surface crack, respectively.
230 × 25 × 25 × 5.5 × 5.5 × 3.9 × 0.33 0.33 0.054
109 109 109 109 109 109
The “a” is the crack depth, and “2c” is the crack length. The eccentric
angle “β” ranging from 0◦ to 180◦ identifies the location of point “P” on
the crack front. Composite laminates are wrapping around the pipe.
researchers believed the crack-induced debonding would occur at the Four materials are employed, which are steel, Glass-FRP (GFRP),
FRP-to-steel interface, which decreased the effectiveness on reducing Carbon-FRP (CFRP), and adhesive. The pipe substrate adopts the
the crack growth rate [11]. However, through the previous studies [19], stainless steel API 5L X65 conforming to API SPEC 5L code [20] for
we found these conclusions might not be directly applied when rein subsea scenarios. One layer of GFRP laminate, which uses the E-glass
forcing surface cracks: the debonding induced by surface crack might fibre weave fabric, is adopted as the contact inhibitor between the steel
not be as serious as that induced by through-thickness cracks, and its substrate and CFRP laminates, concerning the CFRP-to-steel galvanic
effect might be less significant on surface crack growth. However, the corrosion. The CFRP laminate applies the Toray T700S series unidirec
potential of the interfacial failure or stiffness degradation should be tional fabric, and the adhesive layer adopts the Faserverbundwerk
considered to achieve accurate evaluation of the crack growth rate and stoffe® L20 resin epoxy with hardener EPH 161 [21]. The detailed
residual fatigue life. Thus, further analysis on the interfacial bond con material properties are listed in Tables 1 to 4. Note that each corre
dition and its effect on surface crack growth is necessary. In addition, the sponding supplier provides the material properties.
investigations of composite reinforcement on surface cracked steel In addition to the material properties of the adhesive layer, we
plates [10,19] and on surface cracked pipes [6] indicated some diverse incorporate a cohesive zone model to simulate the interfacial bond
conclusions in terms of reinforcement schemes and key influential pa condition, using the mixed-mode bi-linear traction-separation law, as
rameters. Therefore, an in-depth FE analysis on external surface crack indicated in Fig. 2.
For the Mode-I case, the separation displacement δ0n when the trac
2
Z. Li et al. Theoretical and Applied Fracture Mechanics 117 (2022) 103191
Table 4
Material properties of the adhesive layer and the properties of the mixed-mode traction-separation model.
E (Pa) T (Pa) G (Pa) ft (MPa) δ0n (mm) δfn (mm) K (MPa/mm) Gc (N/mm) εf
Mode-I (tension) 3.4 × 10⁹ 70.2 × 10⁶ 1.019 × 10⁹ 70.20 0.004 0.019 17,000 0.667 0.095
Mode-II (shear, tangential) 56.16 0.011 0.16 5095 4.488
2GIIC
δfIIn = , (8)
fIIt
The interfacial properties calculated by Eqs. (1)–(8) are listed in
Table 4. The degree of the interfacial stiffness degradation is represented
by the scalar stiffness degradation variable (SDEG) from 0 to 1. Fully
debonding occurs when meeting the condition indicated in Eq. (9),
where the SDEG value evaluated by the FE model exceeds 1.0.
GI GIIs 2 GIIt 2
( )2 + ( ) +( ) = 1, (9)
GIC GIICs GIICt
where GIICs and GIICt stand for the Mode-II energy release rate in two
shear directions.
2.2. Modelling strategy
The FE modelling and analysis are conducted in ABAQUS® 2021
[23]. The reason of choosing the ABAQUS package is that it is capable of
Fig. 2. The mixed-mode traction-separation law. evaluating the interfacial stiffness degradation by implementing the
cohesive zone modelling. Fig. 3 illustrates the three-dimensional model
tion stress reaches the maximum fIt , is and its meshing condition. The size of the model conforms to the test
specimens in the previous experimental study. The length, external
δ0In =
ta ∙fIt
(1) diameter and thickness of the steel pipe are 2,000 mm, 168.3 mm, and
E 12.7 mm, respectively. Each composite laminate is 0.35 mm thick, while
the adhesive layer is 0.2 mm thick. A quarter surface crack as a semi-
where ta is the thickness of the adhesive.
elliptical shape is modelled at the mid-bottom of the pipe, locating at
The energy release rate is the triangle area surrounded by the curve
the X-Y plane, as shown in the Fig. 3b. A bending moment of 6.0385 ×
and the coordinate axis, which is
107 kN∙m is applied on the pipe, which is identical to the experimental
1 bending moment generated by the four-point bending set-up. This
GIC = fIt ∙δfIn (2)
2 bending moment generates 60% of the yield strength, i.e., 268.8 MPa,
around the cracked area. The SIF along the crack front is calculated via
f
where δIn is the separation displacement when debonding/delamination the contour integral method, which is capable to accurately evaluate the
occurs, which is SIF along a crack front. Please note the SIF is evaluated through linear
facture mechanics, therefore the plastic zone effect around the cracked
δfIn = εf ∙ta (3)
area is excluded in this paper.
where εf is the elongation ratio. The steel pipe, the five layers of composite laminates, and the ad
The slope of the ascending part equals to the shear stiffness of the hesive layer between the steel substrate and the GFRP layer composite
adhesive layer, which is the FE model together. The FE model is developed based on the physical
situation that the overall patch thickness (including adhesive layer and
k=
fIt
. (4) the composite laminates) is 1.95 mm. Since the experimental study
δ0In indicated no delamination failures within the FRP laminates occurred,
we modelled all composite laminates as a whole. The different layers of
For the Mode-II case, the variables of the traction-separation law is
composite laminates were merged together while remaining their own
calculated using the method given by Ref. [22]. GIIC is calculated as
( ) material properties and fibre directions. While each laminate remains its
fIIt 0.56 0.27 own material properties and orientation. One layer of adhesive is
GIICs = GIICt = 31∙ ∙ta . (5)
G modelled between the CFRP laminates and the steel substrate through
the cohesive zone modelling. The steel pipe excludes the crack front
where G is the shear modulus of the adhesive. The traction force is region, and the composite laminates, apply the 20-node quadratic brick
estimated as element C3D20, while the crack front area adopts the 15-node quadratic
fIIt = 0.8∙T, (6) triangular prism element C3D15. The reason of adopting quadratic brick
element, including the C3D20 and C3D15 element is they are excellent
and δ0IIn is calculated as for three-dimensional linear elastic calculations. The C3D15 element is
applied to meet the requirement of the wedge element shape at the crack
δ0IIn =
ta ∙fIIt
, (7) front when using contour integral method. The standardized 8-node
G three-dimensional cohesive element COH3D8 is used in the adhesive
f
layer, to simulate the interfacial bond condition between the steel sub
δIIn is calculated as strate and the composite laminate. Different meshing methods are
adopted to ensure a robust and accurate evaluation. The FE model
3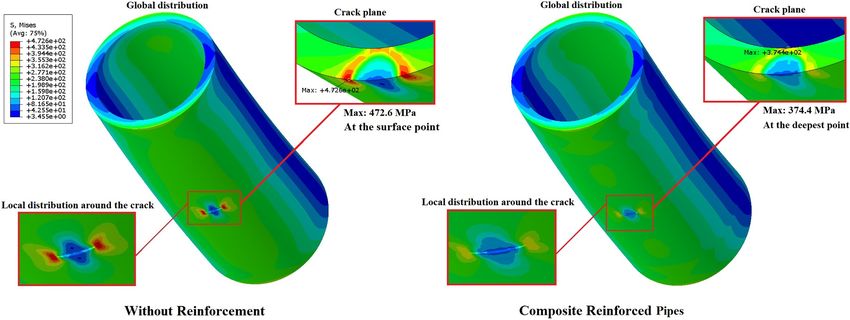
Z. Li et al. Theoretical and Applied Fracture Mechanics 117 (2022) 103191
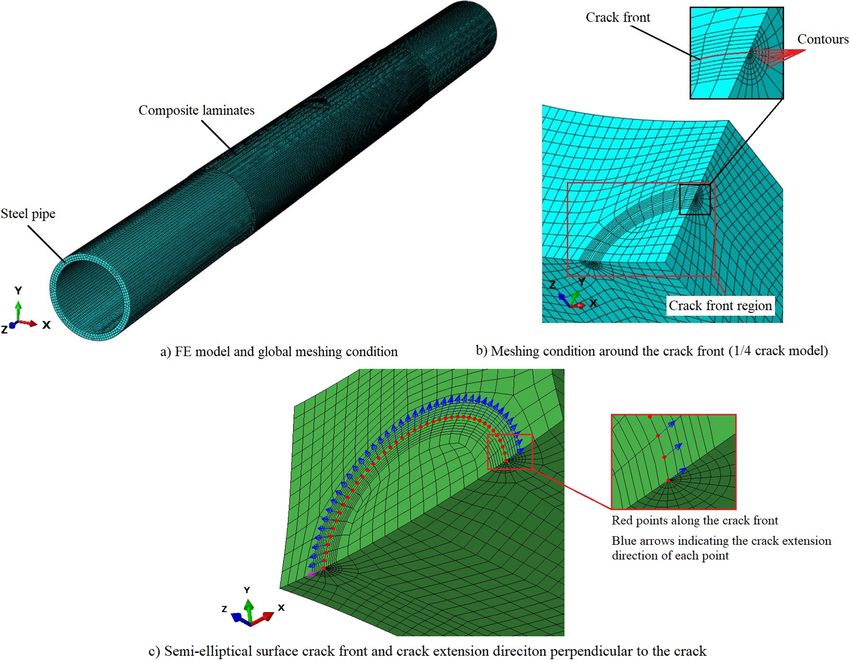
Fig. 3. The FE model and the meshing condition: (a) the whole model and global meshing; (b) model and meshing around the crack; (c) Crack front and the set-up of
crack extension direction.
excluded the crack front region and the adhesive layer adopt the hexa
hedron element by the structural meshing method. While the crack front
region and the adhesive layer applies the sweep meshing methods, using
wedge element and hexahedron element, respectively. Under the
premise of accurate evaluation, different element sizes are assigned in
different areas of the FE model to reduce the computational time. The
size of the wedged elements in the crack front region is controlled by the
six concentric contours and 24 divisions on each of those, as indicated in
Fig. 3b. The diameter of the external contour is 1.0 mm, and the crack
front has been divided into 22 pieces. The mesh size of the area in the
steel pipe adjacent to the crack front area, as well as the adhesive layer
and the composite laminates are set as 1.0 mm, while the size of the pipe
away from the crack front area is set as 5.0 mm.
2.3. SIF evaluation and verification
This SIF evaluation using the contour integral method in ANSYS has
been verified in the previous study [2]. In this paper, since ABAQUS
package is chosen for FE modelling, the accuracy of evaluating SIF of
Fig. 4. The comparison of SIF evaluation by using ABAQUS and ANSYS for a surface cracks needs to be verified by comparing the SIF results with the
small crack and a large crack in steel pipes. results simulated by ANSYS Workbench 2021 [24]. Fig. 4 shows the
comparison of the SIF results of a small crack (a = 5.98 mm, c = 7.12
mm) and a large crack (a = 10.64 mm, c = 12.15 mm) using two FEM
4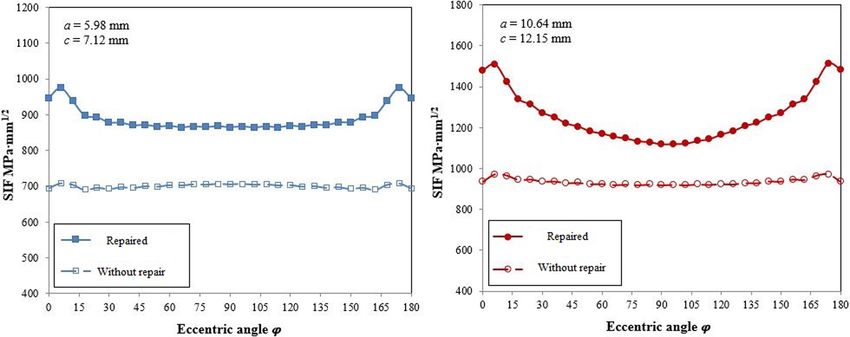
Z. Li et al. Theoretical and Applied Fracture Mechanics 117 (2022) 103191
Fig. 5. Evaluation of the Paris’ constants (C and m) from da/dN versus ΔKIa , and dc/dN versus.ΔKIc
Table 5
The configurations of the FE models for experimental validation.
Name Initial crack size (mm) CFRP wrapping Bond length
scheme (mm)
Crack Half-crack
depth a length c
PE-1 FE 4.29 5.80 / /
PE-1-R FE 5.98 7.12 L-L-L-H 1,000
PE-2 FE 5.34 6.53 / /
PE-2-R FE 5.24 6.13 L-L-L-H 1,000
PE-3 FE 5.34 5.78 / /
PE-3-R FE 5.92 6.235 L-L-L-H 1,000
PE-1-R600 6.10 7.465 L-L-L-H 600
FE
PE-1-R8 5.92 7.28 L-L-L-H-L-L-L-H 1,000
FE
PE-1-R45 4.99 6.525 Inversely diagonal 1,000
FE
3. Experimental validation
Since offshore structures are reaching their original design life,
effective fracture mechanics computational models are required, in
order to ensure continued safe operations. In this section, thus the Paris’
law was combined with numerical technique previously discussed to
analyse surface crack growth in pipes subjected to bending. First, the
Paris’ constants of the steel are evaluated based on the experimental
results of the un-reinforced steel pipe specimens. Then, the surface crack
growth in composite reinforced models is evaluated by incorporating the
SIF into the Paris’ law [25]. Hence, the FE model can be validated by
comparing the evaluated crack growth results with the experimental
data.
Fig. 6. The program of evaluating surface crack growth. The SIFs without composite reinforcement are calculated through
the validated FE model, then the surface crack growth rate along the
packages. The comparison illustrates the ABAQUS package is able to depth or length directions are evaluated through
evaluate the SIF along the crack fronts accurately, with a maximum
error of less than 1%. The detailed SIF results along the crack front of the da/dN = C∙(ΔKIa )m (10)
two cracks evaluated by ABAQUS and ANSYS are listed in Table A1 &A2
dc/dN = C∙(ΔKIc )m (11)
in Appendix A, respectively. This is to be expected because the simula
tion in both packages applied the contour integral method with the same where da/dN and dc/dN are the crack growth rate along the depth or
contour numbers and contour sizes. Technologies, the model simulated length direction. C and m are the Paris’ constants. Fig. 5 shows the
in ABAQUS package should provide slightly more accurate results on determined C and m based on the experimental results.
account of the more regular shaped elements within the areas adjacent Fig. 5 clearly shows that the values of C and m for surface crack
to the contours—the hexahedral elements, rather than using the tetra growth along the depth direction and the length direction are different.
hedral elements within the ANSYS Workbench package. Table A2. Hence the constants for the depth and length direction are Ca = 1.894 ×
5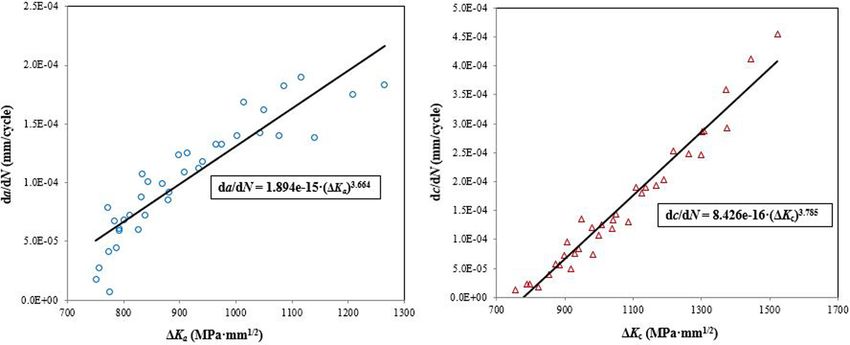
Z. Li et al.                                                                                                Theoretical and Applied Fracture Mechanics 117 (2022) 103191

Fig. 7. The comparison of theoretical results and experimental results using the default-reinforcement scheme: a) along depth direction; b) along length direction.

                                                                                 6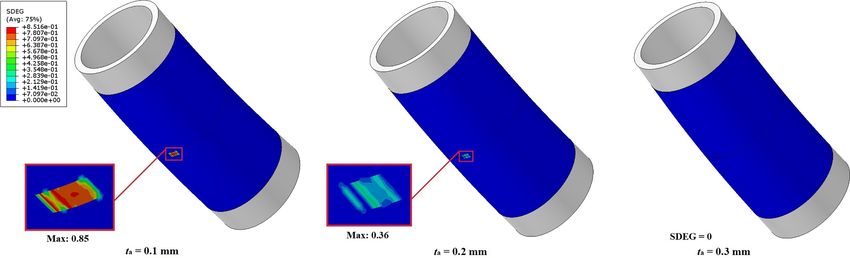
Z. Li et al. Theoretical and Applied Fracture Mechanics 117 (2022) 103191
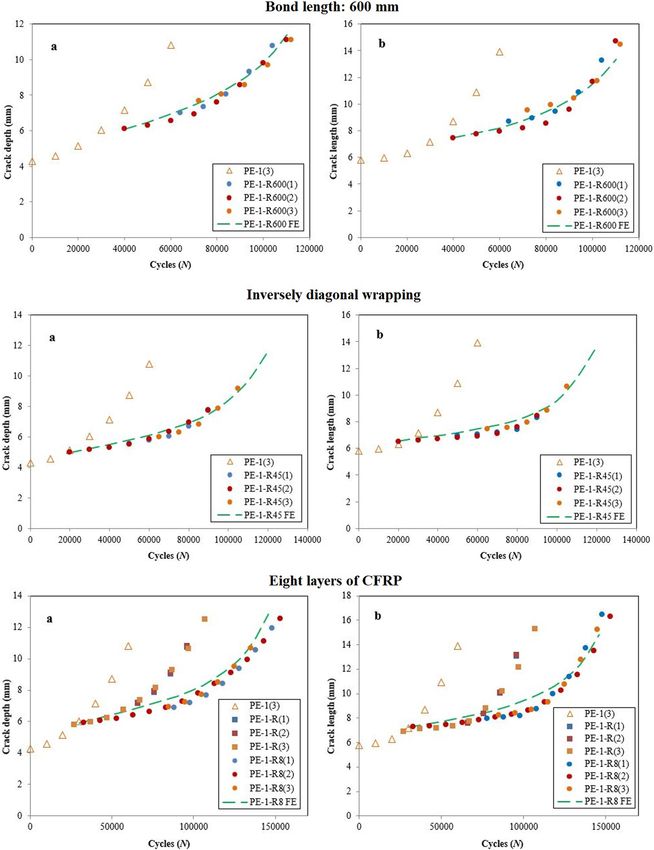
Fig. 8. The comparison of theoretical results and experimental results using different reinforcement schemes, namely 600 mm bond length (PE-1-R600), inversely
diagonal wrapping pattern (PE-1-R45), and applying eight layers of CFRP (PE-1-R8).
7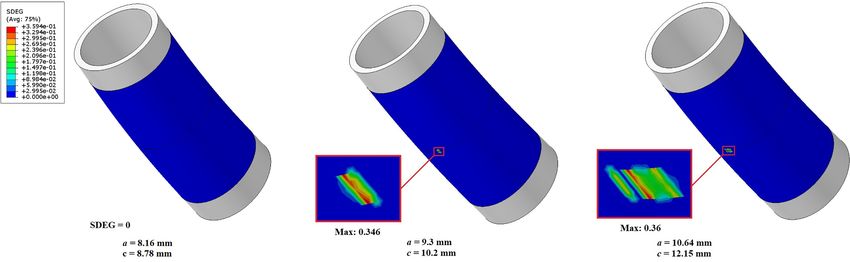
Z. Li et al.                                                                                              Theoretical and Applied Fracture Mechanics 117 (2022) 103191

Fig. 9. Global and local von Mises stress distribution of the pipe model with large surface crack (a = 10.64 mm and c = 12.15 mm) under the bending moment
of.6.0385 × 107 kN∙m

     Fig. 10. Interfacial stiffness degradation with different crack sizes along with the crack growth process under the bending moment of.6.0385 × 107 kN∙m

                   Fig. 11. Interfacial stiffness degradation with different adhesive thickness, under the bending moment of.6.0385 × 107 kN∙m

10− 15 and Cc = 8.462 × 10− 16 , respectively, and ma = 3.664 and mc =              The initial crack size of the FE models adopts the data of one test
3.785 respectively. Note that the unit for SIF is MPa∙mm1/2 , and the unit          specimen from each group. The initial crack size of each FE model and
for da/dN is mm/cycle. After that, surface crack growth of the composite            reinforcing method is listed in Table 5. Take PE-1-R FE as an example,
reinforced FE models along the depth or the length direction is evaluated           the name follows the same rule of the test specimen while adding the FE
through the process indicated by the flow chart in Fig. 6.                          as the indication of a FE model, where “PE” represents “pipe external
    FE models corresponding to the test specimens from the previous                 crack”, “1′′ means the first category of the crack size out of three
experimental study [6] (e.g., initial crack size, layers of laminates and           different sizes in total, and ”R“ means with composite reinforcement.
orientation) are built for the purpose of experimental validation. The              The ending without an ”R“ means the model is without reinforcement,
modelling process follows the strategy as described in Sub-section 2.2.             regarded as a control model. The number behind ”R“ indicates different

                                                                                8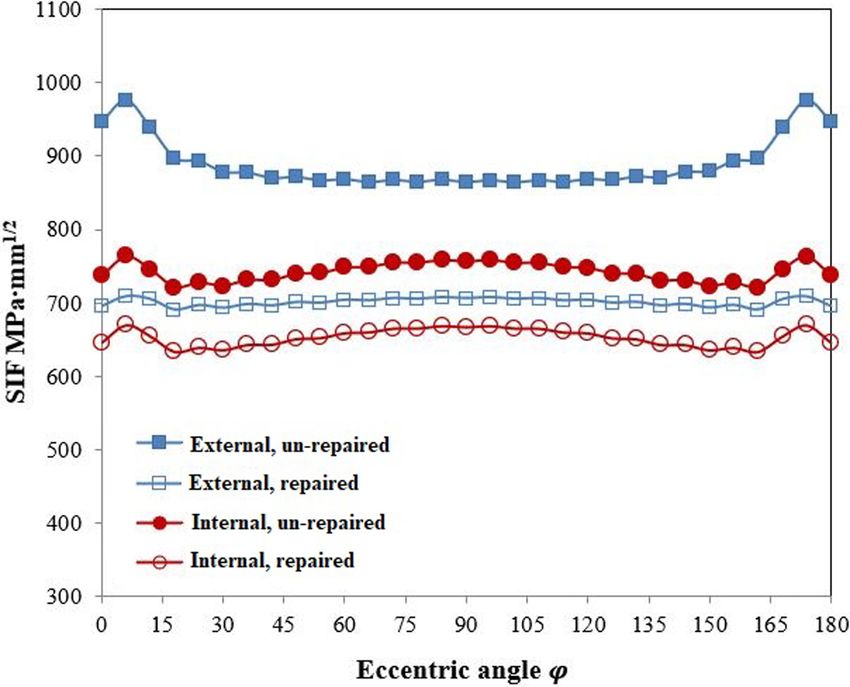
Z. Li et al. Theoretical and Applied Fracture Mechanics 117 (2022) 103191
Fig. 12. The SIF distributions along the crack front of a small crack (left) and a large crack (right), under the bending moment of.6.0385 × 107 kN∙m
Table 7
Configurations of steel pipe models with different dimensions, and the results of
the SIF decrease.
Model D t D/t SIF reduction at SIF reduction at
No. (mm) (mm) the deepest point the surface point
1 168.3 10.97 15.34 20.1% 29.5%
2 168.3 12.70 13.25 18.4% 27.3%
3 168.3 14.27 11.79 17.3% 26.0%
4 168.3 18.26 9.22 15.3% 23.8%
5 168.3 21.95 7.67 14.1% 22.6%
6 219.1 12.70 17.25 17.5% 28.2%
7 273.0 12.70 21.50 16.4% 25.3%
8 323.8 12.70 25.40 14.7% 24.6%
The SIF of surface cracks in each model, specifically KIa at the deepest
point and KIc at the surface point are evaluated by the FE analysis. The
SIF results at the deepest point and at the surface point of PE-1 and PE-1-
R model with different crack sizes during the crack propagation process
are listed in Table B1 in Appendix B, as an example. Then the program
indicated in Fig. 6 using the Paris’ law, predicts crack growth along the
Fig. 13. The comparison of the SIF results between the external surface crack depth direction and the length direction. The crack increment Δa and Δc
and the internal surface crack reinforced by composite. is calculated by the integral calculation of Eqs. (10) and (11), assigning a
range of cyclic intervals ΔN. Eventually, the surface crack size, namely
the crack depth a and the half crack length c, corresponding to their
Table 6 cyclic counts are obtained. The results can then be compared with the
Specimen configuration of steel pipes with different aspect ratios. experimental results for validation purpose. Please note the balance
Model a c a/c SIF reduction at the SIF reduction at the between the computational accuracy and the time consuming is
No. (mm) (mm) deepest point surface point important.
1 3.0 12.0 0.25 21.9% 20.8% Figs. 7 and 8 shows the comparison between the theoretical results
2 3.0 6.0 0.5 18.4% 23.2% and the experimental results of surface crack growth. The figures indi
3 4.5 6.0 0.75 17.8% 26.4% cate that the theoretical evaluations match well with the experimental
4 6.0 6.0 1.0 16.9% 27.8%
5 6.0 4.5 1.25 14.8% 22.9%
results when using composite to repair the cracked surface of the steel
6 6.0 3.0 2.0 12.3% 20.8% pipes, which means that the FE model combined with the Paris’ law can
accurately predict the residual fatigue life of surface cracked steel pipes
reinforced with composite. In addition, the results indicate that FRP
reinforcement strategy, say ”600 mm“ bond length comparing to the reinforcement has significantly decreased the surface crack growth and
default 1,000 mm, ”8′′ for eight layers of CFRP laminates comparing to prolonged the residual fatigue life of cracked models. For instance,
the default four layers, and “45′′ stands for the inversely diagonal without reinforcement, the PE-1(3) specimen only has a residual fatigue
wrapping pattern (45◦ /135◦ /45◦ /135◦ ) comparing to the default L-H-L- life of around 30,000 cycles start from the crack depth a = 6.02 mm to
H wrapping pattern (0◦ /90◦ /0◦ /90◦ ). Note that although the initial the crack depth a = 10.8 mm. While using eight layers of CFRP laminates
crack sizes of the reinforced model (e.g., PE-1-R FE) and its control to reinforce the surface cracked pipe at the same statue (a = 6.02 mm)
model (PE-1 FE) are different, they were initiated from notches with the
same size from the experimental specimens. Please refer to Ref. [6] for
detailed information.
9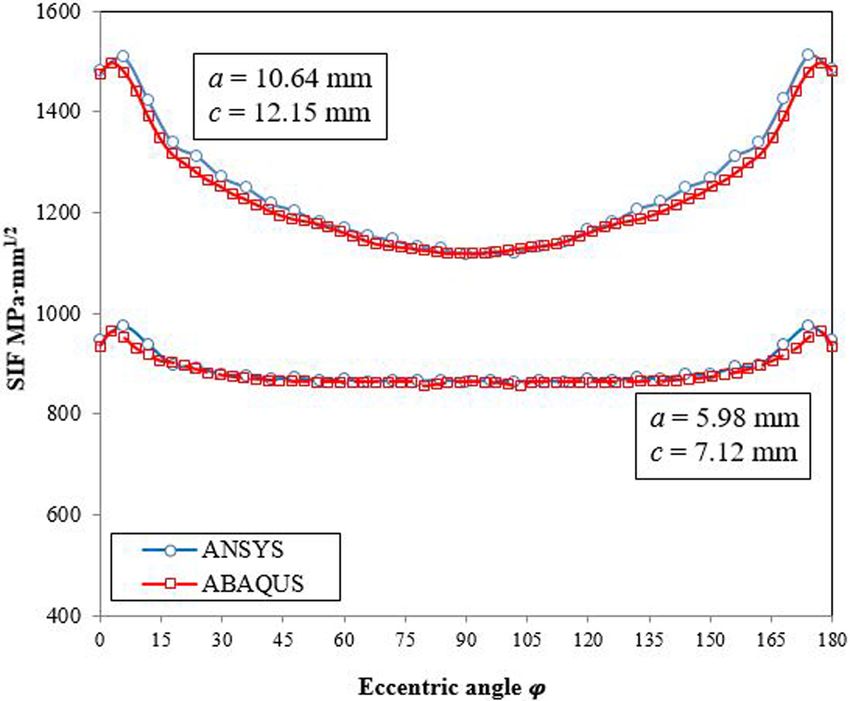
Z. Li et al. Theoretical and Applied Fracture Mechanics 117 (2022) 103191
has prolonged the residual fatigue life to 135,0001. value of the SDEG is relatively low, its negative influence on decreasing
the crack growth rate should be insignificant.
4. Results and discussions
4.2.2. Adhesive thickness
In this section, the theoretical results are presented and discussed The interfacial bond condition with different adhesive thickness is
from two main aspects: the interfacial bond condition and the rein analysed as well, as shown in Fig. 11. In this part, a large crack size of a
forcement effectiveness. Analysing the interfacial bond condition is = 10.64 mm and c = 12.15 mm is selected for the model. Three different
necessary since it acts as an important factor of influencing the effec adhesive layer thickness, namely 0.1 mm, 0.2 mm and 0.3 mm are built,
tiveness of the reinforcement. The SIF, as a fatigue indicator parameter, using the default repairing method as described in Section 2. The
determines the effectiveness of the FRP reinforcement, helping us to interfacial bond properties for each adhesive thickness is calculated by
understand the mechanism of the FRP reinforcement on external surface the Eqs. (1)–(8). The results indicate thinner adhesive layer brings more
cracks. Please note all results in Sub-section 4.1, 4.2 & 4.3 exclude Sub- risks to the failure of the interfacial bond, resulting in the maximum
section 4.3.4 are calculated based on the pipe diameter of external SDEG value of 0.85. While interfacial stiffness did not happen on the
diameter R = 168.3 mm and pipe wall thickness t = 12.7 mm, consistent model with 0.3 mm adhesive thickness.
to the FE model in Section 3. A bending moment of M = 6.0385 × 10⁷ From previous studies, we learned that a relatively thin thickness of
kN∙m is applied on all models in this section. the adhesive could promote the effectiveness of FRP reinforcement.
However, considering the interfacial stiffness degradation might cause
potential failures, choosing an ideal adhesive thickness to acquire a good
4.1. Stress distribution around the surface crack
reinforcement effectiveness and to avoid the interfacial failure is
recommended.
The von Mises stress distributed globally throughout the pipe model
and locally around the surface crack is shown in Fig. 9. The SIF results
4.3. Reinforcement effectiveness and influential parameters
along the crack front is shown in Fig. 12. The stress distribution results
indicate the composite reinforcement with four layers of CFRP laminates
In this sub-section, the FRP reinforcement effectiveness on different
has significantly decreased the stress concentration, the maximum stress
crack sizes, and comparison between external surface cracks and inter
value drops from 472.6 MPa to 374.6 MPa, by 20.7%. Moreover, the
nal surface cracks are analysed. Besides, influential parameters in terms
position that has the maximum stress value has shifted from the surface
of crack aspect ratio, dimensions of the pipe are discussed. However,
point to the deepest point along the crack front because of the composite
influential parameters such as layers of bond, bond length, and orien
reinforcement. The stress value at the surface point drops from 472.6
tation of the laminates are excluded in this paper, since they have been
MPa to 353.4 MPa, by 25.2%, while the stress value at the deepest point
discussed through the previous experimental study [6] and share similar
only drops 9.0%, from 411.3 MPa to 374.4 MPa. This phenomenon is an
conclusions with the investigations on reinforcing internal surface
evidence that the composite reinforcement performs better on
cracked pipes [9].
decreasing the crack growth along the length direction than along the
depth direction.
4.3.1. Crack sizes
Two crack sizes are applied for the analysis, namely a small one (a =
4.2. Interfacial bond condition 5.98 mm, c = 7.12 mm) and a large one (a = 10.64 mm, c = 12.15 mm).
They are both obtained from the experimental results of specimen PE-1-
4.2.1. Interfacial bond condition along with the surface crack growth R(3), as shown in Fig. 6, corresponding to the cyclic number of around
The interfacial bond condition along with the surface crack growth is 30,000 and 100,000, respectively. The purpose of analysing SIFs of two
analysed. Crack sizes were extracted from the experimental specimen of crack sizes is to better understand the mechanism of FRP reinforcement
PE-1-R(3) from the beginning of the crack growth to a larger crack size on reduction of the surface crack at different crack growth stages.
before penetrating the pipe wall. Each adjacent crack size has an interval Fig. 12 shows the SIF results of both un-repaired crack and repaired
of 10,000 cycles. The FE model in this part is in accordance with the FE crack using the default reinforcement method. It indicates the diverse
models in Section 2 using the default repairing method. The interfacial effect of composite reinforcement on different crack sizes: composite
bond conditions of models with different crack sizes, represented by the reinforcement decreases the SIFs at the deepest point and the surface
SDEG value, are shown in Fig. 10. It was only until the crack grew to a point of 18.37% and 27.32% respectively for a small crack, while de
relatively large size (a = 9.3 mm, c = 10.2 mm) did the interfacial creases 17.74% and 35.68% respectively for a large crack. The results of
stiffness began to decrease, showing the maximum SDEG value reached SIF reduction indicate that along with the crack growth, FRP rein
0.346. Then the maximum SDEG value slightly grew to 0.36 when the forcement performs slight less efficient on decreasing the crack growth
crack grew to the largest size, and the area of stiffness degradation along the depth direction, while vice versa along the length direction.
expanded with a relatively low value. The SDEG value, which is smaller This might owe to the fact the distance between the deepest point and
than 1.0, indicating no debonding have happened during the crack the FRP laminates becomes larger when a crack grows bigger, while the
growth process. Therefore, since the interface stiffness degradation did “crack-bridging effect” might offer more bond effect on the surface point
not occur until the very late stage of the crack growth process, and the with a relatively larger crack.
4.3.2. Comparison between external surface cracks and internal surface
1
Please note the fatigue phenomenon of fatigue life prolongation is analysed cracks
by the same methodology as described in the flow chat in Fig. 6, combing the In a previous study of FRP reinforcement on internal surface cracked
SIF evaluation with the Paris’ law. The initial crack sizes were obtained from pipes [9], it was concluded the reinforcement has equal effectiveness on
the test specimens, such as a = 5.98 mm and c = 7.12 mm from PE-1(3). Then,
the SIFs of the deepest point and the surface point. However, it might not
both of the un-reinforced crack and the reinforced crack were modelled based
be the case for reinforcing external surface crack pipes, due to the fact
on the same initial crack size from the un-reinforced test specimen. Thereafter,
these two FE models ran independently and evaluated the crack propagation the FRP laminate has a direct contact with the surface crack. Owing to
curves (crack size versus cyclic index) until they reached the same crack depth the crack-bridging effect, composite reinforcement may performs more
(e.g., 80% of the pipe wall thickness). Via such methods, their residual fatigue efficient on decreasing crack growth along the length direction than
life (the cyclic numbers from beginning to the end) can be obtained and along the depth direction. In this part, both un-reinforced and reinforced
compared. internal surface cracked pipe models are built, using the same crack size
10Z. Li et al. Theoretical and Applied Fracture Mechanics 117 (2022) 103191
(a = 5.98 mm, c = 7.12 mm) as the external surface cracked pipe models. validated FE model, the numerical results from the “interfacial bond
Fig. 13 shows the comparison results of the composite reinforcement condition” and the “reinforcement effectiveness and influential param
on both external and internal surface cracked pipe models. FRP rein eters” perspectives have been analysed and discussed. Hereby are the
forcement decrease the SIFs along the internal surface crack front of major conclusions.
around 12%. While the reinforcement performs more efficient on the
surface point than on the deepest point of the external surface crack, of • The FE method is able to accurately evaluate the SIF of the external
27.3% and 18.4% respectively. Therefore, the results prove the addi surface crack in the composite reinforced steel pipes subjected to
tional effect of the crack-bridging effect on decreasing the SIF at the bending.
surface point. The results can speculate that composite reinforcement • The analysis of the composite reinforcement on reducing the SIF
decrease the SIF of the external surface crack not only through indicates the reinforcement effectiveness owes to the decreasing the
decreasing the stress value around the crack, but also through the crack- stress value and the crack-bridging effect. The analysis on the SIF
bridging effect. further proves that composite reinforcement performs more effi
ciently on reducing the SIF at the surface point than at the deepest
4.3.3. SIF reduction on cracks with different crack aspect ratios point, owing to the crack-bridging effect.
SIFs of surface cracks with six aspect ratios ranging from 0.25 to 2.0 • The analysis on the FRP-to-steel interfacial bond condition indicates
are analysed. The detailed crack sizes of each FE model, as well as the the interfacial stiffness degradation only happened at a later stage of
SIF reduction results of the deepest point and the surface point are the cracking process, and the value of the SDEG is relatively low.
shown in Table 6. It illustrates that the SIF reduction of the deepest point Therefore, its negative influence on decreasing the crack growth rate
is decreasing that with the increasing of the crack aspect ratio. While should be insignificant.
there is no clear trend of the SIF response along the surface point. In light • The interfacial stiffness degradation is sensitive to the adhesive
of the models from No. 2 to No. 4, which have the same crack length, the thickness and crack sizes. In reality, we recommend to analyse the
SIF reduction proportion increases with the increasing of the surface bond condition for each individual case, to avoid any serious inter
depth. For models of No. 4 to No. 6 with the same crack depth, the SIF facial failures, under the premise of achieving a satisfying rein
reduction proportion also shows a positive correlation with the crack forcement effectiveness.
length. Since the crack growth along the depth direction has a special • From the preventing pipe leakage point of view, composite rein
significance in terms of preventing the pipe leakage, the composite forcement is more efficient on surface cracks with smaller aspect
reinforcement is more efficient on surface cracks with smaller aspect ratio. Reinforcement is also more effective on pipes with smaller
ratio. external diameter and thinner wall thickness. Using high elastic
modulus CFRP and more numbers of CFRP laminates are recom
4.3.4. SIF reduction on cracks in steel pipes with different dimensions mended for larger dimensional pipes to achieve a satisfying
API 5L series pipes for the offshore transporting usage with eight consequence.
different dimensions indicated by the D/t ratios [20] are analysed. The
configurations of the reinforced pipes with different external diameter
and wall thickness are listed in Table 7. Four different external diameter CRediT authorship contribution statement
ranging from 168.3 mm to 323.8 mm with five different wall thickness
from 10.97 mm to 21.95 mm are studied: five incremental pipe wall Zongchen Li: Conceptualization, Methodology, Validation, Formal
thickness has been discussed with D = 168.3 mm, while four incre analysis, Data curation, Writing – original draft, Writing – review &
mental external diameter has been analysed with t = 12.7 mm. These editing, Visualization. Xiaoli Jiang: Conceptualization, Supervision.
dimensions are chosen owing to their frequently usage in the offshore Hans Hopman: Supervision, Funding acquisition.
piping industry.
Table 7 illustrates that the reinforcement effectiveness decreases Declaration of Competing Interest
with the increasing of wall thickness under the same external diameter
of 168.3 mm. In light of the models of t = 12.7 mm, i.e., Model No. 2, and The authors declare that they have no known competing financial
No. 6 to No.8, the effectiveness decreases with the increasing of external interests or personal relationships that could have appeared to influence
diameter. Hence, the composite reinforcement is less effective on pipes the work reported in this paper.
with larger external diameter and thicker wall. In cases of reinforcing
pipes with large dimensions, it is recommended to employ more layers Acknowledgement
of CFRP with high elastic modulus for achieving a satisfying decrease of
crack growth rate. The authors appreciate the Department of Maritime and Transport
Technology, Delft University of Technology, the Netherlands for spon
5. Conclusions soring this research. The first author would like to acknowledge the
China Scholarship Council, P. R. China [grant number 201606950024],
This paper conducts a numerical investigation on external surface for supporting his research.
crack growth in steel pipes reinforced with composite repair system
subjected to bending. The developed three-dimensional FE model,
which considered the FRP-to-steel interfacial bond condition, is able to
evaluate the SIF of the surface crack rationally. Thereafter, based on the
11Z. Li et al. Theoretical and Applied Fracture Mechanics 117 (2022) 103191
Appendix A. . Comparison of the SIF results evaluated by
ABAQUS and ANSYS [2]
Table A1 and A2.
Table A1
SIF along the surface crack front (eccentric angle from 0 to 90◦ ) of a small crack and a large crack evaluated by ABAQUS.
Eccentric angle (◦ ) Small crack SIF (MPa∙mm1/2 ) Large crack SIF (MPa∙mm1/2 )
0 935.72 1475.35
2.95 965.16 1497.06
5.90 953.78 1479.65
8.85 932.34 1442.64
11.80 918.90 1391.72
14.75 906.80 1348.24
17.70 903.41 1316.53
20.66 896.95 1298.49
23.61 889.67 1280.74
26.56 883.00 1264.38
29.51 878.69 1252.94
32.46 874.38 1237.84
35.41 871.92 1227.93
38.36 869.36 1216.45
41.31 867.92 1204.92
44.26 866.48 1195.38
47.21 865.77 1188.09
50.16 865.05 1183.47
53.11 864.74 1178.83
56.07 864.43 1170.92
59.02 864.43 1163.25
61.97 864.33 1154.09
64.92 864.43 1145.87
67.87 864.43 1138.34
70.82 864.64 1134.65
73.77 864.74 1131.98
76.72 864.43 1129.45
79.67 855.82 1125.6
82.62 859.10 1122.36
85.57 862.38 1119.34
88.52 864.23 1120.54
Table A2
SIF along the surface crack front (eccentric angle from 0 to 90◦ ) of a small crack and a large crack evaluated by ANSYS.
Eccentric angle (◦ ) Small crack SIF (MPa∙mm1/2 ) Large crack SIF (MPa∙mm1/2 )
0 946.53 1480.0
6 974.95 1508.0
12 938.05 1422.6
18 897.11 1338.0
24 892.69 1312.3
30 878.3 1271.1
36 877.22 1250.2
42 869.93 1219.1
48 871.29 1204.5
54 866.73 1181.0
60 868.24 1170.5
66 864.57 1154.7
72 867.15 1146.4
78 864.96 1133.2
84 867.43 1127.9
90 864.74 1117.7
12Z. Li et al. Theoretical and Applied Fracture Mechanics 117 (2022) 103191
Appendix B. . SIF results of PE-1 and PE-1-R simulated during
the crack propagation process
Table B1.
Table B1
SIF results of PE-1 and PE-1-R models.
Specimen PE-1 PE-1-R
No. a c Δ Ka Δ Kc a c Δ Ka Δ Kc
0 4.29 5.795 639.09 710.1 5.98 7.12 635.301 637.722
1 4.784884 6.317235 684.3123 760.347 6.332774 7.467657 648.603 649.962
2 5.372857 6.993709 737.3025 819.225 6.713376 7.841253 663.129 665.073
3 6.092555 7.890833 803.5605 892.845 7.126153 8.248804 678.465 698.724
4 7.007028 9.133369 889.218 988.02 7.574998 8.740072 698.211 735.552
5 8.241303 10.95647 1011.933 1124.37 8.073592 9.336768 719.784 748.323
6 10.0003 13.93027 1197.423 1330.47 8.630994 9.973635 742.887 762.498
7 12.30006 18.47165 / / 9.256802 10.65738 766.314 809.289
8 / / / / 9.958009 11.51401 796.347 837.378
9 / / / / 10.76528 12.48873 841.401 883.503
10 / / / / 11.7529 13.68277 / /
References [13] T. Belytschko, T. Black, Elastic crack growth in finite elements with minimal
remeshing, Int. J. Numer. Meth. Eng. 45 (5) (1999) 601–620.
[14] J. Fish, The s-version of the finite element method, Comput. Struct. 43 (3) (1992)
[1] Z. Li, X. Jiang, H. Hopman, Surface Crack Growth in Offshore Metallic Pipes under
539–547.
Cyclic Loads: A Literature Review, J. Marine Sci. Eng. 8 (5) (2020) 339.
[15] T.N. Nguyen, C.H. Thai, A.-T. Luu, H. Nguyen-Xuan, J. Lee, NURBS-based
[2] Z. Li, X. Jiang, H. Hopman, L. Zhu, Z. Liu, An investigation on the circumferential
postbuckling analysis of functionally graded carbon nanotube-reinforced
surface crack growth in steel pipes subjected to fatigue bending, Theor. Appl. Fract.
composite shells, Comput. Methods Appl. Mech. Eng. 347 (2019) 983–1003.
Mech. 105 (2020), 102403.
[16] H. Nguyen-Xuan, G.R. Liu, S. Bordas, S. Natarajan, T. Rabczuk, An adaptive
[3] DNV, DNV-RP-F108: Assessment of flaws in pipeline and riser girth welds. 2017.
singular ES-FEM for mechanics problems with singular field of arbitrary order,
[4] N. Saeed, H. Ronagh, A. Virk, Composite repair of pipelines, considering the effect
Comput. Methods Appl. Mech. Eng. 253 (2013) 252–273.
of live pressure-analytical and numerical models with respect to ISO/TS 24817 and
[17] M. Bocciarelli, P. Colombi, T. D’Antino, G. Fava, Intermediate crack induced
ASME PCC-2, Compos. B Eng. 58 (2014) 605–610.
debonding in steel beams reinforced with CFRP plates under fatigue loading, Eng.
[5] T. Tafsirojjaman, S. Fawzia, D. Thambiratnam, X.-L. Zhao, Behaviour of CFRP
Struct. 171 (2018) 883–893.
strengthened CHS members under monotonic and cyclic loading, Compos. Struct.
[18] B. Zheng, M. Dawood, Debonding of carbon fiber–reinforced polymer patches from
220 (2019) 592–601.
cracked steel elements under fatigue loading, J. Compos. Constr. 20 (6) (2016)
[6] Z. Li, X. Jiang, H. Hopman, L. Zhu, Z. Liu, External surface cracked offshore steel
04016038.
pipes reinforced with composite repair system subjected to cyclic bending: An
[19] Z. Li, X. Jiang, H. Hopman, L. Zhu, Z. Liu, W. Tang, Experimental investigation on
experimental investigation, Theor. Appl. Fract. Mech. 109 (2020), 102703.
FRP-reinforced surface cracked steel plates subjected to cyclic tension, Mech. Adv.
[7] R. Branco, F.V. Antunes, J.D. Costa, A review on 3D-FE adaptive remeshing
Mater. Struct. (2020) 1–15.
techniques for crack growth modelling, Eng. Fract. Mech. 141 (2015) 170–195,
[20] API SPEC 5L:Specification for Line Pipe, API, WASHINGTON, D.C., 2018.
https://doi.org/10.1016/j.engfracmech.2015.05.023.
[21] Faserverbundwerkstoffe. “Technical data: Epoxy resin L 20.” https://www.swiss-
[8] M.A. Ghaffari, H. Hosseini-Toudeshky, Fatigue crack propagation analysis of
composite.ch/pdf/t-Epoxydharz-L20-e.pdf (accessed).
repaired pipes with composite patch under cyclic pressure, J. Pressure Vessel
[22] S. Xia, J. Teng, Behaviour of FRP-to-steel bonded joints, in: presented at the
Technol. 135 (3) (2013), 031402.
Proceedings of the International Symposium on Bond Behaviour of FRP in
[9] Z. Li, X. Jiang, H. Hopman, Numerical analysis on the SIF of internal surface cracks
Structures, Hong Kong, 7–9 December 2005, 2005, 419–426.
in steel pipes reinforced with CRS subjected to bending, Ships Offshore Struct.
[23] Abaqus. “Test Configurations for Abaqus 2021 Products.” Dessault System.
(2019) 1, https://doi.org/10.1080/17445302.2019.1702769.
https://www.3ds.com/support/hardware-and-software/simulia-system-informa
[10] Z. Li, X. Jiang, H. Hopman, L. Zhu, Z. Liu, Numerical investigation on the surface
tion/abaqus-2021/ (accessed).
crack growth in FRP-reinforced steel plates subjected to tension, Theor. Appl.
[24] ANSYS. “Ansys 2021 R2 Release Highlights.” https://www.ansys.com/products
Fract. Mech. 108 (2020), 102659.
/release-highlights (accessed).
[11] H. Zarrinzadeh, M.Z. Kabir, A. Deylami, Crack growth and debonding analysis of
[25] P. Paris, F. Erdogan, A critical analysis of crack propagation laws, J. Basic Eng. 85
an aluminum pipe repaired by composite patch under fatigue loading, Thin-Walled
(4) (1963) 528–533.
Struct. 112 (2017) 140–148.
[12] B. Zheng, M. Dawood, Fatigue crack growth analysis of steel elements reinforced
with shape memory alloy (SMA)/fiber reinforced polymer (FRP) composite
patches, Compos. Struct. 164 (2017) 158–169.
13You can also read


