THIS IS THARISA April 2021 - INVESTING IN SUSTAINABILITY

Page created by Elizabeth Lyons
 
CONTINUE READING
THIS IS THARISA April 2021 - INVESTING IN SUSTAINABILITY
THIS IS THARISA
                                April 2021
       INVESTING IN SUSTAINABILITY
                           THS:LSE • THA:JSE

AJ Bell Shares Investor Evening - Webinar
THIS IS THARISA April 2021 - INVESTING IN SUSTAINABILITY
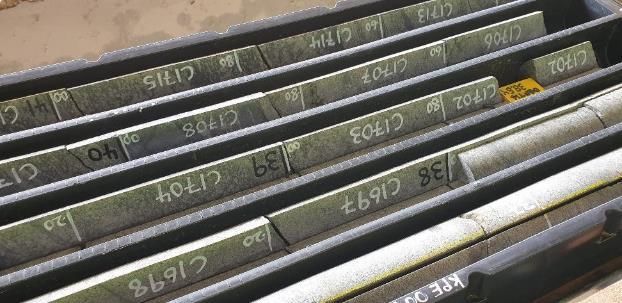
FY2020 EBITDA   YTD PGM basket
INVESTING IN THARISA                                                                                                               margin 27.8%    price growth 134%

1.    Your London exposure to the world of Platinum Group Metals (PGMs)
      Unique PGM prill split, ~12% rhodium (4E basis)
      Profitable throughout the cycle
2.    Sustainability
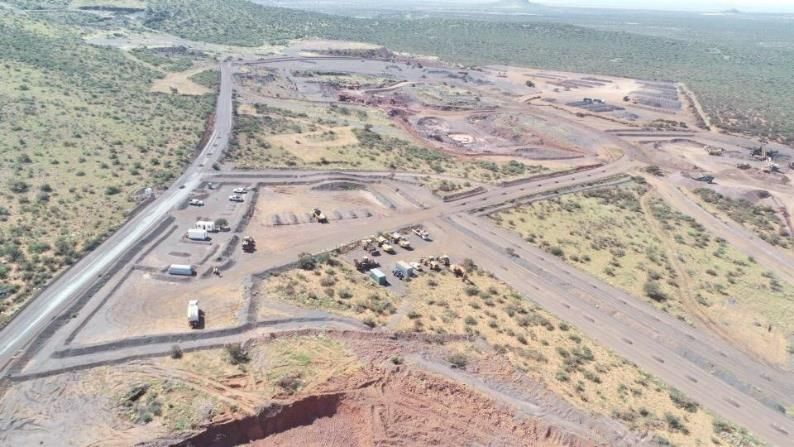
      Long life, large scale open pit mine
      Mechanised low cost operation
      Consistency of resource
3.    Control
      Operational control from pit to market
      Cost control due to in-house nature of operation
4.    Returns to Shareholders
      Dividends to shareholders
      Capital appreciation
      Growing margins and highly cash generative
5.    Value proposition
     Analyst 1         2.3x EV/EBITDA

     Analyst 2         1.7x EV/EBITDA

     Analyst 3         2.7x EV/EBITDA

                                                          Enriching lives through innovating the resources company of the future                                       2
THIS IS THARISA April 2021 - INVESTING IN SUSTAINABILITY
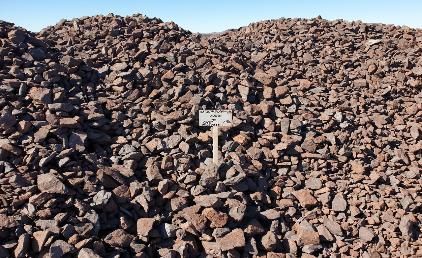
•   42.79 MOZ IN CONTAINED
                                                                                                                                                             859.58 MT IN
WHO WE ARE                                                                                                                                                   MINERAL RESOURCE     •
                                                                                                                                                                                      6PGE+Au*
                                                                                                                                                                                      172 MT IN CONTAINED Cr2O3*

  Leading PGM and chrome co-producer
  14 year LOM open pit located in the heart of PGM and chrome country
  +40 year underground mechanised life
  Close to infrastructure, road, rail and power
  Mechanised, with a highly skilled workforce
  Tharisa is a product of the new mining code - fully compliant

                                                                                                                                         South Africa hosts over two-thirds of the world’s PGMs & chrome

*Mineral Resource and Mineral Reserve Statement in 2020 annual report pages 50-55

                                                                                    Enriching lives through innovating the resources company of the future                                                         3
THIS IS THARISA April 2021 - INVESTING IN SUSTAINABILITY
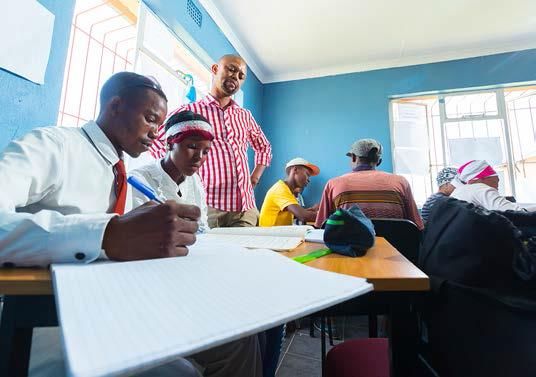
SUSTAINABLE LOW COST POLYMETALLIC BUSINESS MODEL

 Discover
   ‒ Large scale resources
   ‒ Complimentary opportunities in the resource portfolio
 Develop
   ‒ Innovative approach to mineral extraction
   ‒ New processes and technologies to enhance value further
 Deliver
   ‒ Safe production growth in both PGM and chrome concentrates
   ‒ Shareholder value across the commodities chain
   ‒ Impactful investment and social contribution
 Diversify
                                                                                                 PROFIT BEFORE TAX AND EPS
   ‒ Into a multi asset, multi commodity, multi jurisdictional business                          (US$ m) (US cents)

   ‒ Using technology as our catalyst                                                                                                    Profit before tax   EPS

                                                                                                  110

                                                                                                                                 22.0                                          20
                                                                                                                                             19.0
                                                                                                   90
                                                                                                                                                                       16.2    15

                                                                                                                                  91.0
                                                                                                                                                                               10
                                                                                                   70

                                                                                                                                                                        75.8
                                                                                                             6.0                                                               5
                                                                                                                                                              4.0

                                                                                                                                              64.9
                                                                                                   50
                                                                                                                                                                               0

                                                                                                   30                                                                          -5

                                                                                                             22.0

                                                                                                                                                               11.2
                                                                                                                                                                               -10

                                                                                                   10

                                                                                                                                                                               -15

                                                                                                  -10
                                                                                                          FY2016               FY2017      FY2018            FY2019   FY2020   -20

                                                              Enriching lives through innovating the resources company of the future                                                 4
THIS IS THARISA April 2021 - INVESTING IN SUSTAINABILITY
LTIFR 0.06 / 200 000 hours   REDUCE CARBON
SAFETY, SUSTAINABILITY AND ESG                                                                                        (Q2 FY2021)                  EMISSIONS BY 2030

       LTFIR                                         FATALITY FREE YEARS                                                  ENVIRONMENT

       0.09                                          5+
       Lost Time Injury Frequency Rate               Achieved: 28 September 2020
       30 September 2020

       58                                40                                                         209
       Engineering Learnerships          Interns and Graduates                                      Adult Education and
                                                                                                    Training learners

                                            Enriching lives through innovating the resources company of the future                                                     5
THIS IS THARISA April 2021 - INVESTING IN SUSTAINABILITY
SPOT PGM BASKET PRICE*                   FY2021 guidance
POSITIONING THARISA                                                                                                                                                            ~US$4 000/oz                             155koz to 165koz

 PGM producer                                                                                                              RESOURCES PRILL SPLIT 4E %
     ‒ 142 100 ounces of PGMs FY2020                                                                                        120

 Tharisa position in terms of global demand                                                                                100
                                                                                                                                      12                               8
                                                                                                                                              7       7        9              9      10     6      6      5      8       1
     ‒ ~1.3% of platinum demand                                                                                              80       21      28      28      29       30     30     31     42     40     45     45
                                                                                                                             60                                                                                          62
     ‒ ~0.3% of palladium demand
                                                                                                                             40
     ‒ ~2% of rhodium demand                                                                                                          67      62      62      60       60     59     57
                                                                                                                             20                                                             48     47     45     44
                                                                                                                                                                                                                         29
                                                                                                                              0
PRILL 6E FY2020
                                                                 Ir
                                    Ru                         6 127
                                   20 435                      4.3%
                                                                                                                                                           Platinum     Palladium     Rhodium      Gold
                                   14.4%
                                                                                                                            SPOT 4E BASKET PRICE
                            Au                                                                                              5000
                            271                                                                                             4500

                                                                                                                                       4802
                           0.2%                                                          Pt

                                                                                                                                               4415
                                                                                                                            4000

                                                                                                                                                       4128

                                                                                                                                                                4113

                                                                                                                                                                       4082
                         Rh                                                            78 710                               3500

                                                                                                                                                                              3834

                                                                                                                                                                                     3576

                                                                                                                                                                                            3558
                                                                                       55.4%

                                                                                                                                                                                                   3519

                                                                                                                                                                                                          3515
                       13 514                                                                                               3000

                                                                                                                                                                                                                 3274
                        9.5%                                                                                                2500

                                                                                                                                                                                                                         2458
                                 Pd                                                                                         2000
                                23 001                                                                                      1500
                                16.2%                                                                                       1000
                                                                                                                             500
                                                                                                                                  0
                                          Pt      Pd     Rh      Au      Ru      Ir

Source: Investec, prices 6 April 2021 (2) Based on analyst estimates as of Q4 2020 *as at 9 April 2021

                                                                                        Enriching lives through innovating the resources company of the future                                                                             6
THIS IS THARISA April 2021 - INVESTING IN SUSTAINABILITY
SPOT CHROME PRICE*          FY2021 guidance
POSITIONING THARISA                                                                                                                            ~US$160/t                   1.45Mt to 1.55Mt

 Chrome Producer                                                                                  Chrome is what makes steel stainless
     ‒ 1 344 800 tonnes in FY2020                                                                  South Africa hosts 72% of the global chrome reserves
     ‒ Provides China with 10% of all its chrome concentrate                                                                 GLOBAL STAINLESS STEEL CAGR       ADDITIONAL STAINLESS STEEL
     ‒ One quarter specialty and foundry grade chrome                                                                                               +5.0%                      2.7 Mtpa
     ‒ One of the largest global chemical grade chrome producers
                                                                                                                                       ADDITIONAL CHROME        ADDITIONAL FERROCHROME
     ‒ Specialty chrome market trades at a premium                                                                               ≡             1.8 Mtpa                        0.7 Mtpa
     ‒ Vulcan construction completion Sept 2021
           • Adds additional 400k tonnes per annum of concentrate
                                                                                                                                                                                    50.9MT
                                                                                                                                                                                    (2020)
                  CHROME PRODUCTION FY2020 (kt)

                                          321.6                                                                  Chinese consumption of stainless steel was
                                          23.9%                                                                   25.61mt in 2020, up by 6% from a year earlier
                                                                                                                 China is projected to produce 32mt of
                                                                                                                  stainless steel in 2021, up 6% from 2020
                                                    1023.2
                                                    76.1%

                                    Met Grade     Specialty Grade                                                                            Compound annual growth 5.7%
Source: ISSF, Argus Media *as at 9 April 2021                                                            1950                                                                                2020

                                                                    Enriching lives through innovating the resources company of the future                                                          7
THIS IS THARISA April 2021 - INVESTING IN SUSTAINABILITY
SPOT CHROME PRICE             SPOT PGM BASKET PRICE
FY2021 Q2 PRODUCTION                                                                              LTIFR 0.06 / 200 000 hours
                                                                                                                                         ~US$ 155/t*                   ~US$4 000/oz*

 Record PGM prices of US$3 290/oz                                                                 PLATINUM (oz)
 PGM production up 11.5% YoY                                                                      160 000

                                                                                                   140 000
 Chrome concentrate production (excluding third party) up 15.5% YoY
                                                                                                   120 000
 On track for FY2021 production guidance                                                          100 000
 Cash Balance and Debt Position (31/03/2021)                                                       80 000

      ‒ Cash of US$73.1 million (31/12/2020 US$49.8m)                                               60 000

                                                                                                    40 000
      ‒ Total debt of US$41.7 million (30/9/2020 US$45.0m)
                                                                                                    20 000
      ‒ Positive net cash position of US$31.4 million                                                    0
                                                                                                              FY2020 Production    FY2021 Guidance   FY2020 H1     FY2021 H1
                                                                                                                                      (midpoint)     Production    Production
                                                                                                  CHROME (t)
                                                                                                  1 600 000

                                                                                                  1 400 000

                                                                                                  1 200 000

                                                                                                  1 000 000

                                                                                                   800 000

                                                                                                   600 000

                                                                                                   400 000

                                                                                                   200 000

                                                                                                         0
                                                                                                              FY2020 Production FY2021 Guidance      FY2020 H1    FY2021 H1
*13 April 2021                                                                                                                     (midpoint)        Production   Production

                               GUIDANCE FOR FY2021 OF 155 koz TO 165 koz OF PGMs (6E BASIS) AND 1.45 Mt TO 1.55 Mt OF CHROME CONCENTRATES

                                                          Enriching lives through innovating the resources company of the future                                                               8
THIS IS THARISA April 2021 - INVESTING IN SUSTAINABILITY
GROWING THARISA

                                                                                       Complete organic growth opportunities
                                                                                                Life of mine extension
                                                                                                Vulcan Plant
                                                                                                Fulfill 200 000 ounces of PGM production target

 Expand and roll out our business sustainably                                         Commercialise downstream opportunities

 Further optimise our existing operations                                                      PGM smelting and refining

 Continue to invest in innovative thinking                                                     Stainless steel alloys

 Become a global and diversified business                                                      Battery metal technologies

 Be the investment of choice in our chosen sector                                     Consolidate external opportunities

 Responsibly enriching the lives of all of our stakeholders                                    Salene Chrome (Great Dyke, Zimbabwe)
                                                                                                Salene Manganese and Iron (Northern Cape, South Africa)
                                                                                                Karo Platinum (Great Dyke, Zimbabwe)

                                                  Enriching lives through innovating the resources company of the future                                   9
THIS IS THARISA April 2021 - INVESTING IN SUSTAINABILITY
GROWING THARISA

 Optimising the Tharisa mine                                                              PGM PRODUCTION*
                                                                                           (oz)
           200 000 oz of PGM per annum
                                                                                            190
           2 000 000 tonnes of chrome per annum                                            185                                            4%

 Capturing the downstream margin
                                                                                            180
                                                                                            175

           PGM smelting and refining FY2023 onwards                                        170                         11%
                                                                                            165
           Beneficiating our chrome                                                        160
                                                                                            155
                                                                                            150
                                                                                            145
                                                                                                           FY2021                 FY2022         FY2023

                                                                                           CHROME PRODUCTION*
                                                                                           (tonnes)
                                                                                            2000
                                                                                            1800                                            6%
                                                                                            1600                            17%
                                                                                            1400
                                                                                            1200
                                                                                            1000
                                                                                             800
                                                                                             600
                                                                                             400
                                                                                             200
                                                                                               0
                                                                                                            FY2021                FY2022         FY2023
*based on average analyst forecast

                                                   Enriching lives through innovating the resources company of the future                                 10
KARO AND SALENE CHROME PROJECT OVERVIEW

 Great Dyke of Zimbabwe holds the world’s second largest deposits of
  PGMs and chrome
 Over 550km long and up to 11km wide
 Two Mineralised Horizons
    ‒ Main Sulphide Zone (‘MSZ’)
    ‒ Lower Sulphide Zone (‘LSZ’)
 Mining operations exploit MSZ while LSZ is largely under explored
 Karo Platinum has been awarded a Special Grant in the Great Dyke in
  the Mashonaland West District for an area of 23 903 ha
 Salene was awarded three especial grants (numbers 6797, 6798 and
  6799) under the Zimbabwe Mines and Minerals Act covering an area
  of approximately 9 500 hectares (95 km2) on the eastern side of the
  Great Dyke in Zimbabwe on 15 May 2018.

Source: USGS

                                                       Enriching lives through innovating the resources company of the future   11
PROJECTS OVERVIEW

 Tharisa owns 26.8% of Karo Platinum
                                                                                                                                         Snakes

 2 phases of exploration have been completed and studies                                                                                Head

  underway, due for completion end August 2021
 Financing discussions have commenced
 Phased approach to ensure project build and cash flow
  development
 Special Economic Zone (“SEZ”) declared over the area
 Entitled to several fiscal incentives                                                                        Hartley Platinum Mine
                                                                                                            Resource of 28.2 Moz (4E)
                                                                                                                                                           Harare

                                                                                                                 4E grade of 4.03 gpt
                                                                                                                                              Karo Platinum
    including reduced tax rates                                                                                                              Estimated 96 Moz (4E)
                                                                                                                                              4E grade of 3.2 gpt

    duty free importation of raw materials and equipment                                                                  Ngezi Mine
                                                                                                            Resource of 72.6 Moz (4E)
                                                                                                                 4E grade of 3.34 gpt

    exchange control rulings.
 National Project Status application to be submitted with BFS

                                                                                                                                    Unki Mine
 Tharisa has an option for 90% of Salene Chrome                                                                                    Resource of 30.5 Moz (4E)
                                                                                                                                    4E grade of 4.19 gpt

 Trial mining commenced in FY2020 allowing for optimisation
  studies and project plan to be developed                                                                                  Mimosa Mine
                                                                                                                            Resource of 13.9 Moz (4E)
                                                                                                                            4E grade of 3.61 gpt

                                                    Enriching lives through innovating the resources company of the future                                            12
SALENE MANGANESE AND IRON

 Tharisa has an option for 70%
 Salene’s principal activity is the mining of manganese
  and iron ore on a DSO basis
 Mine is in operation and is cash generative
 Current production on an annualized basis
   ‒ Manganese at 600kt
   ‒ Iron production at 600kt
 Second phase of resource drilling and declaration
  underway to increase production to 1.2mtpa of each
  product

                                                           Enriching lives through innovating the resources company of the future   13
TURNING PRODUCTION INTO CASH FLOW

 FREE CASH FLOW YIELD                                                                                                                EBITDA MARGIN
 (%)
50
45
                                                                                                        43.5
40                                                                                            41
35
30
25
20                                                                                20.4
15           13.9                   13.3
10
 5                      5.3
                                               2.7        3.7
 0                                                                    1.5
        2015        2016       2017        2018      2019        2020       2021/Spot    2022       2023

                              SA PGM peers            Avg 2005-2020            Tharisa

• Rising exposure to FCF yield over next 3 years                                                                                   • Strong EBITDA margins throughout the cycle

Source: Rencap, historical and forecast, market cap-weighted FCF yield* per calendar year, FCF yield is determined using equity shareholders'

cash flow.

                                                                                         Enriching lives through innovating the resources company of the future                   14
A LOOK AT VALUATION

POTENTIAL SHARE PRICE UPSIDE AT SPOT                                                                                                               EARNINGS GROWTH CY20-21E
250%                                                                                                                                               250%        234%

200%
          191%                                                                                                                                     200%
                                                                                                                                                                                 165%        160%
                     157%
                               148%                                                                                                                                                                      140%
150%                                     138%                                                                                                      150%
                                                     125%
                                                                                                                                                                                                                   107%
                                                                                                                                                   100%                                                                        87%
100%                                                                          78%
                                                                                             65%
                                                                                                                                                                                                                                         48%
                                                                                                                                                   50%
 50%

                                                                                                                                                    0%
  0%
                                                                                                                                                               Tharisa           Amplats    Northam      RBPlat   Nornickel   Sibanye   Implats
          Sibanye    Tharisa   RBPlat   Nornickel   Northam               Impala           Amplats

                                                                          EV/EBITDA
                                                                          7
                                                                                                      S. Africa PGM producers                             London listed miners

                                                                          6

                                                                          5

                                                                                                                                                                                                   4.2
                                                              EV/EBITDA

                                                                          4                                                                                                                        4.0

                                                                               2.5                                           3.4
                                                                          3                                                  3.1
                                                                                     2.2
                                                                          2

                                                                          1

                                                                          0
                                                                               Tharisa             Impala   RB Plats   Sylvania             CAML    Ferrexpo   Atalaya   Kenmare Bushveld   Base
                                                                                                    Plats

                                                                                               EV/EBITDA 21E                EV/EBITDA 22E               Avg 21E              Avg 22E
Source: Rencap, PH

                                                                                           Enriching lives through innovating the resources company of the future                                                                                 15
OUR COMMODITIES

 PGMs                                                                                            WPIC PLATINUM ANALYSIS
 Structural deficit driven by supply constraint and real demand                                  Demand continued to recover from the automotive, jewellery and industrial
 Timing of new projects                                                                           sectors
 Pd and Pt substitution increasing, Rh extremely difficult to substitute                         Robust demand from the investment sector
                                                                                                  Third quarterly supply deficit in platinum and an annual deficit of 932 koz of
                                                                                                   platinum
                                                                                                  WPIC is forecasting that 2021 will remain in deficit, with demand
                                                                                                   outstripping supply by 60 koz, resulting in the third consecutive annual
                                                                                                   deficit

Source: BASF (excludes investment demand)                                                              Source: WPIC, demand for platinum

                                                                   Enriching lives through innovating the resources company of the future                                           16
OUR COMMODITIES

 CHROME                                                                                                           MAIN CR ORE EXPORTERS 2020
 Chrome is irreplaceable and makes steel stainless                                                                                                    9.5%
                                                                                                                                              2.4%
 Concentrated supply with 80% from South Africa                                                                                           3.6%
 Demand driven by Chinese domestic consumption and export
                                                                                                                                       4.3%
 Global demand to increase post COVID-19 economic slow down

                                                                                                                                                                       80.2%

                                                                                                                               South Africa         Turkey    Zimbabwe         Oman    ROW

                                                                                                                   MAIN CR ORE IMPORTERS 2020
                                                                                                                                                  2.7% 0.8%    4.3%

                                                                                                                                           2.5%

                                                                                                                                                                       89.7%

Source: Macquarie, ICDA                                                                                                            China      Indonesia       Russia   India     ROW

                                                      Enriching lives through innovating the resources company of the future                                                                 17
DISCLAIMER

These Presentation Materials are for information purposes only and must not be used or relied upon for the purpose of making any investment decision or
engaging in any investment activity. Whilst the information contained herein has been prepared in good faith, neither Tharisa plc (the ‘Company’) and its
subsidiaries (together, the ‘Group’) nor any of the Group’s directors, officers, employees, agents or advisers make any representation or warranty in respect of the
fairness, accuracy or completeness of the information or opinions contained in this presentation and no responsibility or liability will be accepted in connection
with the same. The information contained herein is provided as at the date of this presentation and is subject to updating, completion, revision, verification and
further amendment without notice.
These Presentation Materials contain forward-looking statements and information in relation to the Group. By its very nature, such forward- looking statements
and information require the Company to make assumptions that may not materialise or that may not be accurate. Such forward-looking information and
statements involve known and unknown risks, uncertainties and other important factors beyond the control of the Company that could cause the actual
performance or achievements of the Company to be materially different from any future results, performance or achievements expressed or implied by such
forward-looking information and statements. Nothing in this presentation should be construed as a profit forecast. Past share performance cannot be relied on as
a guide to future performance.
COVID-19 remains a risk to the Company and our forecasts and guidance are premised on the current level of economic activity being permitted by government
regulations

                                                         Enriching lives through innovating the resources company of the future                                    18
APPENDIX
FY2020 CHROME PRICE                  FY2020 PGM BASKET PRICE       SPOT CHROME PRICE   SPOT PGM BASKET PRICE
FY2020 HIGHLIGHTS                             US$140/t                             US$1 704/oz                   ~US$160/t           ~US$4 000/oz

REEF MINED              PGM PRODUCTION                                               CHROME CONCENTRATE PRODUCTION
                        (5PGE+Au)

4.97 Mt                 142.1 koz                                                    1.34 Mt
up 7.6%                 up 1.7%                                                      up 3.9%
(2019: 4.62 Mt)         (2019: 139.7 koz)                                            (2019: 1.29 Mt)

                         FY2021 GUIDANCE MIDPOINT 160 koz OF PGMs (6E BASIS) AND 1.50 Mt OF CHROME CONCENTRATES

REVENUE                 EBITDA                                                       EPS

US$406.0 m              US$113.4 m                                                   US 16.2 cents
up 18.4%                up 119.8%                                                    up 305.0%
(2019: US$342.9 m)      (2019: US$51.6 m)                                            (2019: US 4.0 cents)

PROPOSED DIVIDEND       RETURN ON INVESTED CAPITAL (ROIC)

US 3.5 cents            18.8%
up 367.0%               up 261.5%
(2019: US 0.75 cents)   (2019: 5.2%)

                                        Enriching lives through innovating the resources company of the future                                               20
SUSTAINABLE BUSINESS

  CO-PRODUCT AND              HEALTHY CASH                              CONTINUED                                 ROBUST BALANCE             LIQUIDITY
   EXCHANGE RATE               GENERATION                              INVESTMENT                                     SHEET                 MANAGEMENT
      BENEFITS

Multiple revenue streams    Exposure to the right                  Investment in SHE,                                   Low gearing         Capital discipline
    coupled with US$        commodities coupled                   people, infrastructure
 revenues and ZAR costs    with low operating costs               and growth projects,
                            generates strong cash                     Vulcan, Karo                                  Net cash positive   Consistent dividend payer
                                    flows

                                                                                                                                             Growing ROIC

                                               Enriching lives through innovating the resources company of the future                                            21
BALANCE SHEET AND CAPEX (FY2020)

 Total debt of US$70.4 m                                                                                      FY2020 Capex US$70.6 m
    ‒ Trade finance amounted to US$17.3 m                                                                        ‒ US$24.7 m mining fleet
    ‒ Debt to total equity ratio of 21.9%                                                                        ‒ US$22.7 m deferred stripping
    ‒ Cash and cash equivalent of US$49.3 m                                                                      ‒ US$11.4 m related to other mining assets
    ‒ Net debt to total equity ratio of 6.6%                                                                     ‒ US$11.8 m related to expansion capital
    ‒ Focus on working capital management - current ratio at 1.8 times                                           ‒ Depreciation charge of US$27.9 m
                                                                                                               FY2021 Capex US$54.4 m (excludes FY2021 deferred stripping)
                                                                                                                 ‒ Vulcan capex US$46.4 m

DEBT POSITION WITH TRADE FINANCE                         DEBT CURRENCY SPLIT                                         FY2021 PLANNED CAPEX
                                                         (EXCLUDING TRADE FINANCE)                                                         Tailing storage facility    Other
                                  Term Loan
   Trade finance                                                                                                                 Land purchases US$2.1 m              US$1.6 m
                                     8.7%
      25.0%                                                                                                                         US$8.8 m                                      Mining
                                                          USD debt                                                                                                               US$27.4 m
                                              Revolver     39.3%
                                               25.9%
                                                                                                                                                        US$100.8 m

Finane Leases
                                                                                                   ZAR debt                     Optimisation &                                    Processing
  and other
                                                                                                    60.7%                           Vulcan                                        US$14.7 m
    11.2%
                                                                                                                                 US$46.4 m
                                CAT
                               29.2%

                                                                                CONTINUED SUSTAINABLE INVESTMENT

                                                                     Enriching lives through innovating the resources company of the future                                                    22
POSITIONING THARISA
HEADWINDS FROM DEEP MINES TO MEET GROWING RHODIUM DEMAND
                                                                         PRIMARY DEMAND OUTSTRIPPED BY PRIMARY SUPPLY

                                                                          RHODIUM AUTOCATALYST DEMAND

Source: HSBC, JM

                         Enriching lives through innovating the resources company of the future                         24
PALLADIUM AND PLATINUM OUTLOOK

                                                 PALLADIUM                                                                                 PLATINUM

  GROSS DEMAND (2020)                                                                              GROSS DEMAND (2020)

                    Autocatalyst                 Jewellery   Industrial                                     Autocatalyst              Jewellery       Industrial   Investment
                        85.8%                      0.9%        15.1%                                            32.1%                   22.5%           31.9%         13.1%

         2020 net demand 6 773oz
         2020 primary supply 6 176oz
         Continuing shortages filled by
          recycling and stocks

Source: BMO, Johnson Matthey, WPIC, SFA Oxford

                                                             Enriching lives through innovating the resources company of the future                                             25
You can also read