Too Real for Comfort? Uncanny Responses to Computer Generated Faces
←
→
Page content transcription
If your browser does not render page correctly, please read the page content below
Too Real for Comfort? Uncanny Responses to
                Computer Generated Faces

                                     Karl F. MacDorman∗
                                      Robert D. Green
                                       Chin-Chang Ho
                                      Clinton T. Koch

                                     Indiana University
                                    School of Informatics

∗ Karl F. MacDorman, Ph.D. (Cambridge)
  Indiana University School of Informatics
  IT 487, 535 West Michigan Street
  Indianapolis, Indiana 46202 USA
  Tel. +1 317 215-7040
  Fax. +1 206 350-6089

                                             1
Abstract
    As virtual humans approach photorealistic perfection, they risk making
real humans uncomfortable. This intriguing phenomenon, known as the un-
canny valley, is well known but not well understood. In an effort to demys-
tify the causes of the uncanny valley, this paper proposes several perceptual,
cognitive, and social mechanisms that have already helped address riddles
like empathy, mate selection, threat avoidance, cognitive dissonance, and
psychological defenses. In the four studies described herein, a computer
generated human character’s facial proportions, skin texture, and level of
detail were varied to examine their effect on perceived eeriness, human like-
ness, and attractiveness. In Study I, texture photorealism and polygon count
increased human likeness. In Study II, texture photorealism heightened the
accuracy of human judgments of ideal facial proportions. In Study III, atyp-
ical facial proportions were shown to be more disturbing on photorealistic
faces than on other faces. In Study IV, a mismatch in the size and texture of
the eyes and face was especially prone to make a character eerie. These re-
sults contest the depiction of the uncanny valley as a simple relation between
comfort level and human likeness. This paper concludes by introducing a set
of design principles for bridging the uncanny valley.

Keywords
Anthropomorphism; Facial perception; Masahiro Mori; Social cognitive
neuroscience; Uncanny valley

                                      2
1     Introduction
1.1   The Bleeding Edge of Human Photorealism
Computer graphics (CG) characters are challenging our ability to discern what is
human. For example, the CG character Davy Jones looked so human in Pirates
of the Caribbean: At World’s End film critics assumed he was portrayed by an
actor wearing prosthetic tentacles (Zacharek, 2007). The critics did not realize
the actor, Bill Nighy, had been entirely replaced by digital artistry. Nevertheless,
this digital Davy Jones was believable, because he was meant to look supernatural
and creepy. The same principle applies to other CG villains, such as Gollum in
The Lord of the Rings trilogy. By contrast, characters designed to look like real
people have been less convincing, such as the CG heroes in The Polar Express
and Final Fantasy: The Spirits Within (Geller, 2008; Pollick, in press). Thus, the
achievement of photorealistic human character animation has remained elusive
despite its status as a holy grail of computer graphics (MacGillivray, 2007).
    The difficulty of human photorealism has been attributed to the uncanny valley
(bukimi no tani in Japanese). The term derives from a hypothetical graph proposed
in 1970 by Masahiro Mori (Fig. 1). The graph predicts that as something looks
more human it also looks more agreeable, until it comes to look so human we
start to find its nonhuman imperfections unsettling (Mori, 1970; MacDorman &
Ishiguro, 2006). The imperfections expose a mismatch between the human quali-
ties we are led to expect and the nonhuman qualities that instead follow—or vice
versa. As examples of things that lie in the uncanny valley, Mori cites corpses,
zombies, mannequins coming to life, and lifelike prosthetic hands (Mori, 1970).
According to Mori, on a dark night a woman could mistake a prosthetic hand for
a real one. If she then shook hands with it, upon feeling its coldness and hardness
she might shriek with horror.
    Concerns about the uncanny valley have taken on new urgency with the ever
increasing use of CG animation. These concerns are often reported in trade jour-
nals and the popular press because of the uncanny valley’s perceived impact on
the multi-billion dollar animation and video game industries (Gouskos, 2006;
MacMillan, 2007). The uncanny valley has even led studios like Pixar to shy
away from human photorealism, choosing instead cartoony stylization (e.g., the
characters of The Incredibles; Canemaker, 2004). The uncanny valley especially
worries video game designers, because their animations are rendered instanta-
neously, without time for careful staging or touching up.
    This paper’s goal is to take a few small steps toward bridging the uncanny

                                         3
uncanny valley

                                                                         {
          +

                                       moving
                                       still                                             healthy
                                                                    bunraku puppet
          comfort level (shinwakan)

                                                                                         person
                                                         humanoid robot

                                                            stuffed animal
                                      industrial robot

                                      human likeness        50%                    100%
                                                                     corpse       prosthetic hand

                                                                     zombie

Fig. 1: Masahiro Mori proposed a relation between human likeness and shin-
wakan, which may be roughly translated as rapport or comfort level: more human-
looking robots are perceived as more agreeable until we get to robots that look so
nearly human that subtle flaws make them look creepy. This dip in their evaluation
is the uncanny valley. The valley, Mori argued, would be deepened by movement.
The term uncanny valley is now commonly applied to animated characters in films
and video games.

                                                                 4
valley by uncovering some of its causes and proposing design principles to help
photorealistic human characters escape from the valley. The eventual fulfillment
of this goal could have an enormous economic impact and change the course of
computer graphics animation and video games.

1.2   Possible Explanations of the Uncanny Valley
Why would human beings be put-off by nonhuman features in a human-looking
character when they feel unperturbed by the same features in a more stylized char-
acter? Possible answers found in the literature (MacDorman & Ishiguro, 2006;
MacDorman, Vasudevan, & Ho, 2008) may be divided into two groups: those
that involve automatic, stimulus-driven, specialized processing that occurs early
in perception and those that involve a broader and more general range of cognitive
processing that occurs later. Both kinds of processing engage affective and mo-
tor processing and are simultaneously active in perceiving human-looking forms.
Although their behavioral components are the historical domain of perceptual and
social psychology, respectively, they are now open to exploration through brain
imaging. They may be separated through experimental procedures, such as the
subliminal and supraliminal presentation of stimuli during the measurement of
event-related potentials in the brain (Del Cul, Baillet, & Dehaene, 2007).

1.2.1 Explanations Involving Specialized Perceptual Processing
Recognition deficits caused by brain injury (e.g., prosopagnosia; Farah, Rabi-
nowitz, Quinn, & Liu, 2000), face inversion, and configurational effects and the
results of brain imaging studies and single-neuron studies in nonhuman primates
indicate that face recognition is anatomically and functionally specialized (Carmel
& Bentin, 2002), involving as many as six regions in the ventral visual pathway
(Barbeau et al., 2008). Brain imaging has revealed that the fusiform face area
(FFA) of the ventral occipito-temporal cortex responds with high selectivity to
faces (Kanwisher, McDermott, & Chun, 1997). The FFA has been shown to be
more active when the participant sees the stimulus as a face during the bistable os-
cillation of the Rubin face-vase illusion (Hasson, Hendler, Ben Bashat, & Malach,
2001; Andrews, Schluppeck, Homfray, Matthews, & Blakemore, 2002) or in near-
threshold images (Grill-Spector, Knouf, & Kanwisher, 2004). Inverted presenta-
tion more greatly hinders a person’s recall of faces than of other objects, except
in domains of exceptional expertise (e.g., the recall of show dogs by an highly
experienced judge; Diamond & Carey, 1986). Nevertheless, the degree of brain

                                         5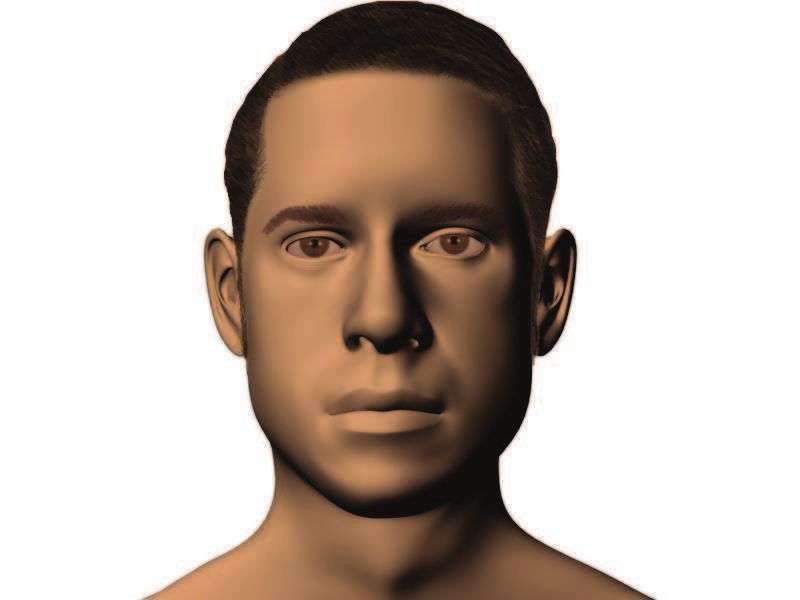
specialization for face perception is still contested (Downing, Jiang, Shuman, &
Kanwisher, 2001; Gauthier & Logothetis, 2000; Haxby et al., 2001; Spiridon &
Kanwisher, 2002).
    Threat avoidance. Mori (1970) suspected the uncanny valley arose from the
need for self-preservation. Christian Keysers elaborated this view from an evolu-
tionary perspective, drawing on Rozin’s theory of disgust (MacDorman & Ishig-
uro, 2006; Rozin & Fallon, 1987). Keysers posited that the uncanny valley is the
result of an evolved mechanism for pathogen avoidance. The more human an or-
ganism looks, the stronger the aversion to its defects, because (1) defects indicate
disease, (2) more human-looking organisms are more closely related to human
beings genetically, and (3) the probability of contracting disease-causing bacte-
ria, viruses, and other parasites increases with genetic similarity. Thus, leprosy
looks disgusting to us, but leaf spot does not. A mechanism for pathogen avoid-
ance would explain the strong tendency to be more sensitive to defects in our
own species—and to defects in CG human characters and other human-looking
entities—than to defects in distantly related species.
    Perceived defects in a human-looking entity could trigger an aversive response
automatically by activating an evolved mechanism for self-preservation. For ex-
ample, according to Rozin and Fallon (1987), disgust originated in the distaste
system of our earliest ancestors: the system that elicits mouth gape (Ekman &
Friesen, 1986), revulsion, and nausea when something tastes bitter or rotten. How-
ever, the elicitors of disgust broadened from taste to include other senses like smell
that are able to indicate objects at a distance that should be avoided. For human
beings the elicitors broadened further to include nonperceptual inferences—not
just how something is perceived but what it is interpreted as signifying. Thus,
the realization that someone has committed a moral transgression (e.g., adultery)
may also access the distaste system through preadaptation (Rozin & Fallon, 1987).
Among the strongest elicitors of disgust are reminders of the animal nature of hu-
man beings and especially their mortality (Haidt, McCauley, & Rozin, 1993). Per-
ceived defects in a human-looking entity can also elicit fear-motivated aversion by
triggering a fight-or-flight response (Ohman, 2000). Fear is commonly associated
with activation in the amygdala but may occur in its absence (Atkinson, Heberlein,
& Adolphs, 2007; Davis & Whalen, 2001).
    Shared circuits for empathy. Some research indicates that perceptual, cogni-
tive, and affective processing may work in concert during the perception of un-
canny forms (Chaminade, Hodgin, & Kawato, 2007; Krach et al., 2008). These
shared circuits in the brain are thought to support the ability to understand the
intentions of others, because they are active both when someone performs an in-

                                          6
tentional action and when that person sees someone else perform the same action
(Keysers & Gazzola, 2007). A pair of studies have shown that human-looking
entities activate these shared circuits more powerfully (Chaminade et al., 2007;
Krach et al., 2008), while other studies have found no significant difference be-
tween human beings and robots (Gazzola, Rizzolatti, Wicker, & Keysers, 2007).
Using functional magnetic resonance imaging (fMRI) of human brains, Krach et
al. (2008) discovered a linear relation between a robot’s human likeness and cor-
tical activation in the medial frontal cortex and the right temporoparietal junc-
tion. The shared circuits implicated in “mentalizing” about others’ intentions
have been referred to as the mirror system and identified with the premotor cor-
tex in macaque monkeys (Gallese, Fadiga, Fogassi, & Rizzolatti, 1996) and hu-
man beings (Grezes, Armony, Rowe, & Passingham, 2003). In a study using
positron emission tomography (PET) scans, Tai, Scherfler, Brooks, Sawamoto,
and Castiello (2004) found a significant neural response in the left premotor cor-
tex when human participants watched an action being performed by a human be-
ing but not when performed by a robot. These brain imaging results complement
behavioral evidence, which indicates that both the feeling of being understood and
the frequency of social responses increases with the human likeness of a computer
interface or virtual agent (Burgoon et al., 2000; Gong, 2008).
     While the ability to understand the intentions of others is a key element of em-
pathy, other shared circuits enable us to experience the emotions of others more
directly (Preston & Waal, 2002; Carr, Iacoboni, Dubeau, Mazziotta, & Lenzi,
2003). Jabbi, Bastiaansen, and Keysers (2008) found that experiencing disgust,
viewing someone else experiencing it, or imagining a disgusting experience have
a common neural substrate in the anterior insular cortex and adjacent frontal op-
erculum. Human appearance and emotional expressivity may heighten empathy
by enhancing the brain’s ability to simulate being in another person’s place (Cole,
2001; Preston & Waal, 2002).
     Evolutionary aesthetics. People judge the attractiveness of others at a glance;
they do not change their assessments with more time; and they have high agree-
ment with each other on who is attractive (Olson & Marshuetz, 2005; Willis &
Todorov, 2006). Members of different cultures show agreement on attractiveness
while favoring features unique to their own culture (Cunningham, Roberts, Bar-
bee, Druen, & Wu, 1995; D. Jones, 1995). Even babies and young children show
preferences towards attractive people (Langlois et al., 1987, 2000; Salvia, Sheare,
& Algozzine, 1975). Taken together, these results indicate that the perception of
attractiveness has a biological basis in specialized perceptual processing that is
automatic and stimulus-driven.

                                         7
This conclusion is further supported by evidence that human beings have
evolved to perceive as attractive potential mates who possess discernable indica-
tors of fertility, hormonal and immune system health, social desirability, and other
signs of reproductive fitness (Law Smith et al., 2006; Soler et al., 2003; Thorn-
hill & Gangestad, 1999; Tovée, Hancock, Mahmoodi, Singleton, & Cornelissen,
2002). Indeed, much of the research on attractiveness concerns the biological
markers of beauty, sex appeal, and relationship potential and their selective ad-
vantage (e.g., Conway, Jones, DeBruine, & Little, 2008; for reviews see Etcoff,
1999; Rhodes & Zebrowitz, 2002).
    Youth, vitality, skin quality, bilateral symmetry, familiarity, and nearly ideal
facial proportions all enhance attractiveness (Cunningham, 1986; Henss, 2006;
B. C. Jones, Little, & Perrett, 2004; Langlois & Roggman, 1990; Rhodes &
Tremewan, 1996; Rhodes, Proffitt, Grady, & Sumich, 1998). Bilateral symme-
try in men, for example, is correlated with running speed, resistance to disease
and parasites, sperm quality and count, healthy hormonal levels, and mental well-
being (Manning & Pickup, 1998; Manning, Scutt, & Lewis-Jones, 1998; Man-
ning, Gage, Diver, Scutt, & Fraser, 2002; Thornhill & Gangstead, 1993). People
have an especially strong preference for bilateral symmetry in human faces (Little
& Jones, 2003). Hence, it is possible that we perceive symmetrical faces as at-
tractive, because we inherited perceptual mechanisms favoring symmetry from
our ancestors who made reproductively successful mate choices. By extension,
the selective pressure to perceive as unattractive those lacking in reproductive fit-
ness may have led to the evolution of the perceptual and cognitive mechanisms
responsible for the feelings of aversion associated with the uncanny valley.

1.2.2 Explanations Involving Cognitive Processing
The cognitive dissonance of liminal objects. The focus of evolutionary aesthetics
research is on identifying aesthetic norms that are universal across cultures and
rooted in human biology (Rhodes et al., 2001). However, because Homo sapi-
ens did not evolve with robots or animated characters, it is especially important
not to overlook the ways in which our evaluative standards are socially constructed
within the constraints of human biology. What is potentially most disturbing about
artificial human forms is not how they look but what they signify: a challenge to
their maker’s uniqueness. Robots and CG characters are liminal objects, lying
on the boundary of human and nonhuman, calling into question the very distinc-
tion (MacDorman et al., 2008; Turkle, Taggart, Kidd, & Daste, 2006; Turkle,
2007). Needless to say, the ensuing dissonance is more cognitive than percep-

                                         8
tual and is likely to engage brain regions indentified with motivated as opposed
to “cold” reasoning (i.e., the ventromedial prefrontal, anterior cingulate, posterior
cingulate, insular, and lateral orbital cortices Westen, Blagov, Harenski, Kilts, &
Hamann, 2006). Thus, cognitive dissonance and certain kinds of uncanny valley
experiences may have common neural underpinnings (Pollick, in press).
    Sorites paradoxes involving personal and human identity. Ramey (2005) ar-
gues that the uncanny valley is caused by the linkage of two qualitatively distinct
categories—human and robot—by a quantitative metric (i.e., degree of human
likeness) that undermines their original separation. The same valley may appear
whenever one kind of thing changes “little by little” into a different kind of thing,
as in the transformation of an ovum into a human being. Can we determine pre-
cisely when human life begins? In the abortion debate, moral uncertainty about
what lies between the clearly cellular and clearly human is particularly disturb-
ing, because we identify ourselves with the human end of the continuum. Figures
in Mori’s graph perceived to lie between robot and human may be disturbing for
similar reasons. Moreover, our identification with these robot-machine hybrids
may beg the question, “Aren’t we all just machines?” This question may excite
unconscious fears of annihilation because, if we are just machines, then we are
also mortal machines, that is, machines without hope for continuation after death.
    Terror management theory. Terror management theory has demonstrated how
subliminal reminders of death can cause a pervasive shift in our attitudes and
preferences (Solomon, Greenberg, & Pyszczynski, 1998). In particular, these re-
minders cause us to favor those who have opinions that support our cultural world-
view. According to Becker (1973), cultural worldviews give our lives meaning
and permanence in part by offering a literal or symbolic transcendence of death to
those who live up to their standards (Pyszczynski, Greenberg, & Solomon, 1999).
Solomon et al. (1998) hypothesize that cultural worldviews reduce the anxiety
caused by our uniquely human awareness of our own mortality. But as social con-
structions, cultural worldviews are fragile compared to our more visceral fear of
annihilation and, therefore, are in need of support.
    A complementary explanation is that personal identity is socially constructed
in terms of our cultural worldview. Identifying the self with something larger
and seemingly more permanent—be it family, nation, God, or an immortal soul—
provides solace in the face of death. The presence of android robots or CG char-
acters in society, and the mechanistic view of human behavior that they engen-
der, challenges human uniqueness and consequently undermines our sense of per-
sonal and human identity (MacDorman et al., 2008). Hence, it is unsurprising
that an uncanny android can elicit the same psychological defenses as subliminal

                                         9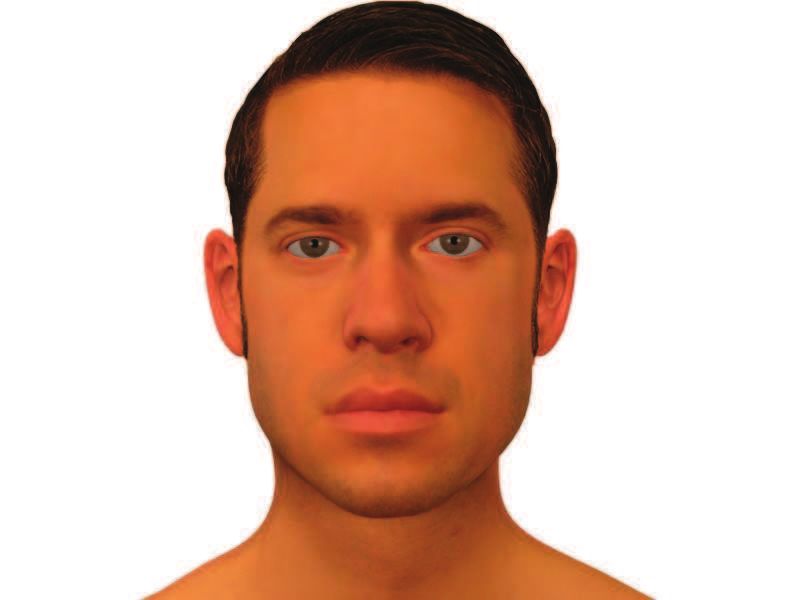
reminders of death (MacDorman & Ishiguro, 2006).

1.3   Past investigations of the uncanny valley
There are many ways to conceptualize human likeness. The independent axis
of Mori’s graph offers one method. A character’s form (e.g., shape, texture),
dynamics (e.g., motion quality, gestures, facial expressions, speech, intonation,
tone of voice), and interactivity (e.g., timing, contingency) could all be varied in
their degree of human likeness. Thus, human likeness may be operationalized
in terms of formal, quantifiable properties. Individual differences can also in-
fluence human perception of CG characters. These include differences that are
physiological (e.g., genetic, developmental, sensory acuity, age), cognitive (e.g.,
learning, habituation, traumatic experiences), social (e.g., childhood experiences,
relationships, fetishism), and cultural (e.g., techno-friendly versus technophobic
societies) in origin. All of these factors and the relations among them are crucial
to understanding the aesthetic dimensions of CG characters. Furthermore, there
are many ways to conceptualize shinwakan—the dependent axis of Mori’s graph.
Shinwakan roughly translates as a feeling of rapport, and Mori identifies negative
shinwakan with eeriness (bukimi). Human likeness, rapport, and eeriness could
also be operationalized in a number of different ways. For example, an increase
in skin conductivity as measured by galvanic skin response could potentially in-
dicate an eerie stimulus—as may neural activity in the amygdala as measured by
fMRI.
     This empirical study is limited to exploring whether an uncanny valley ex-
ists for CG characters in still images. It focuses on how facial proportions, skin
texture, and levels of detail affect the perceived eeriness, human likeness, and at-
tractiveness of CG characters as indicated on self-reported semantic-differential
scales. It also explores how skin textures and levels of detail affect human sensi-
tivity to CG facial proportions as indicated by the degree of interrater agreement.
These are important issues. Changing the lower face height or the position of
the chin, upper lip, or jaw by as little as 1 mm in a profile can make a human
face look unacceptable (Giddon, Sconzo, Kinchen, & Evans, 1996). Animators
of human photorealistic CG characters need to know which facial features have
low tolerances so that they can take precautions to keep their characters out of the
uncanny valley. The results of this study are examined in light of some possible
explanations of the uncanny valley. Because the results indicate some causes of
the uncanny valley, this study proposes a few design principles for bridging it.
     Our interest in the uncanny valley arose from the goal of building robots that

                                        10
are indistinguishable from human beings for use in social and cognitive science
experiments with people (MacDorman et al., 2005). MacDorman (2006) pro-
duced a valley in self-reported ratings on a strange–familiar scale by morphing
head-shots of a humanoid robot, an android, and a human. Eeriness ratings were
highest in the region of the valley that fell between the robot-looking humanoid
and human-looking android. In a follow-up experiment, Hanson (2006) showed
the valley could be bridged by carefully designing the steps between robot and
android. One flaw of these studies is that the formal properties of the face were
not varied systematically along clearly defined dimensions (e.g., polygon count,
texture, eye separation) to isolate the elicitors of self-reported eeriness. In addi-
tion, the morphing technique introduced visual artifacts that could have increased
eeriness ratings.
Our next study examined participants’ evaluations of a diverse range of stim-
uli, comprising 11 images of people, androids, mechanical-looking robots, and
two- and three-dimensional depictions of people and robots (Green, MacDorman,
Ho, & Vasudevan, 2008). Participants used a Flash application to modify the
proportions of each face along one of four facial dimensions: face height, cheek
width, eye separation, and jaw width. Face height (i.e., eye height) and cheek
width were selected, because Cunningham (1986) found in a regression analysis
of 21 facial proportions of 50 women that these two dimensions—in addition to
nose area and smile width—accounted for 50% of the variance in attractiveness
ratings. (Nose area and smile width were excluded, because some of the robot
stimuli lacked a discernable nose or mouth.) Grammer and Thornhill (1994) found
that different facial proportions influenced the perception of attractiveness, domi-
nance, sexiness, and health. Prominent eyes and cheekbones contributed most to
males’ evaluations of females, while jaw width and lower-face proportions con-
tributed most to females’ evaluations of males. Based on their results, we added
eye separation and jaw width to our list of dimensions along which to vary facial
proportions.
In Green et al. (2008), participants indicated a range of values for each facial
proportion that appeared acceptable for each face. Against expectations, the ac-
ceptable range did not narrow significantly across all four proportions for more
humanlike faces. Because the stimuli were derived from 11 very different faces,
facial variations other than the faces’ degree of human likeness may have pre-
vented a consistent pattern from emerging from the data. For this reason, the
present study starts with a single computer graphics based model of a human face
and systematically decreases the face’s human photorealism by reducing the skin
texture photorealism and level of detail (i.e., number of polygons or lines) or by
11moving facial proportions away from human norms. In Green et al. (2008), par-
ticipants also indicated which facial proportions looked best by adjusting the face
height, eye separation, cheek width, and jaw width of the 11 faces. The results
showed heightened participant sensitivity to the best point as human likeness in-
creased, as measured by interrater agreement. The same methodology is applied
to the base model in this study for face height and eye separation. (Cheek width
and jaw width were excluded from consideration in this study, because a change
in skin texture can affect how changes in these dimensions are perceived.)
In an experiment that morphed faces of dolls, masks, and CG characters into
human faces, Seyama and Nagayama (2007) failed to uncover evidence of an
uncanny valley for nearly human-looking characters. However, a valley became
evident when they enlarged the characters’ eyes. In particular, the combination of
a 50% increase in eye size and human texture and proportions resulted in much
greater perceived eeriness than the same proportions with a doll’s texture. These
results are important to CG animators, because they indicate that exaggerating the
size of the eyes, which artists typically do (Costa & Corassa, 2006), may backfire
when using a photorealistic facial texture.
The eeriness of oversized eyes combined with a photorealistic skin texture may
indicate that eeriness is not a product of a certain degree of human likeness, but the
result of a discrepancy between more human-looking and less human-looking ele-
ments. This mismatch hypothesis can be traced to Mori’s original article in which
he notes the eeriness of a prosthetic hand that looks natural but feels artificial. The
hypothesis is supported by our study of robot videos, which found that robots that
possessed both human and nonhuman characteristics elicited fear, disgust, anxi-
ety, dislike, and shock—the emotions associated with eeriness (Ho, MacDorman,
& Pramono, 2008). It is also supported by a study, which found that a certain mo-
tion performed by more human-looking characters is seen as more natural than the
same motion performed by animated CG characters. This negative response bias
shows a significant correlation with brain activity as detected by fMRI in shared
circuits for mentalizing, including the left temporoparietal junction and the an-
terior cingulate cortex (Chaminade et al., 2007). Studies on people’s feelings of
copresence when interacting with a character in a virtual environment also show
that copresence is lowest when there is a mismatch between the character’s per-
ceived human photorealism and perceived human behavioral fidelity (Bailenson
et al., 2005; Nowak & Biocca, 2003). Vinayagamoorthy, Steed, and Slater (2005)
note that virtual characters will be evaluated more positively when their degree of
human behavioral fidelity is consistent with their degree of human photorealism.
This paper presents four empirical studies that explore issues related to the
12uncanny valley in still images:
I. Baseline Human Likeness and Eeriness: Participants rated the eeriness and
human likeness of a 3D model of a male human head presented at three
different textures and levels of detail. The motivation for the survey was
to determine whether rendering a CG face in more detail would cause it to
look eerier. The survey also provided baseline human likeness ratings for
each texture and level of detail to be used in the next study.
II. Sensitivity to Best Proportions: Participants independently manipulated the
eye separation and face height of the 3D model to determine which pro-
portions looked best. The change from the original proportions were plot-
ted against the human likeness ratings of the baseline survey to determine
whether, as perceived human likeness increased, the proportions that looked
best converged on the human model’s original proportions.
III. Eeriest Level of Detail: For extreme facial proportions, participants se-
lected the level of detail at which the CG face looked eeriest. Our expecta-
tion was that people would be more disturbed by extreme facial proportions
on more detailed CG faces, because detailed faces more strongly enlist spe-
cialized human facial processing, which would apply more stringent human
aesthetic norms to the evaluation of the faces.
IV. Eyes-Face Mismatch: Participants rated the eeriness, naturalness, and at-
tractiveness of CG faces at five levels of eye photorealism and five levels
of skin photorealism with normal-sized eyes and eyes enlarged by 50%.
The idea was to determine whether a mismatch in the level of eye and skin
photorealism increased eeriness and whether eye enlargement increased the
eeriness of more photorealistic faces by a greater extent than less photore-
alistic faces.
2 Study I: Baseline Eeriness and Human Likeness
This study collected eeriness and human likeness ratings of photorealistic, bronze,
and line drawing renders of the base model at 11 levels of detail. More detailed
renders of more photorealistic textures were predicted to look more human. One
purpose of this study was to establish baseline eeriness and human likeness rat-
ings of the stimuli used in Studies II and III. In addition, the study was intended to
13check the prediction of the uncanny valley graph that eeriness would reach a peak
near total human likeness (Mori, 1970). Human likeness was gauged both objec-
tively, by texture photorealism and level of detail, and subjectively, by participant
ratings of human likeness.
2.1 Hypotheses
One aim of this study was to confirm whether the stimuli would function as ex-
pected. Because the original model was designed to look as photorealistic as pos-
sible, and all stimuli—including the stimuli with less detail or skin photorealism—
were derived from this model, ratings of human likeness were expected to increase
with the level of detail and texture photorealism.
H1A. Human Texture: CG faces rendered with a more photorealistic texture
are perceived as more human than those rendered with a less photorealistic
texture.
H1B. Human Detail: CG faces rendered in more detail are perceived as more
human than those rendered in less detail.
As potential explanations of the uncanny valley, theories concerning the role of
disgust in pathogen avoidance or facial and body proportions as indicators of fer-
tility in mate selection draw on evidence of specialized perceptual mechanisms for
evaluating human faces and bodies (MacDorman & Ishiguro, 2006). Presumably,
these human-specific mechanisms would provide more consistent evaluations of
stimuli than more general mechanisms for evaluating objects. Therefore, sensitiv-
ity to the human likeness of a CG face is expected to increase with the perceived
human likeness of the face. In this study, sensitivity is operationalized as interrater
agreement.
H2. Sensitivity Human: Sensitivity to human likeness increases with perceived
human likeness.
Mori’s uncanny valley graph predicts forms that are close to human appear-
ance will be most eerie. Therefore, perceived eeriness is predicted to be high when
human likeness is also high. This study operationalizes human likeness as level
of detail, texture photorealism, and self-reported ratings of human likeness.
H3A. Eerie Texture: CG faces rendered with more texture photorealism are
eerier than those rendered with less texture photorealism.
14H3B. Eerie Detail: CG faces rendered in more detail are eerier than those ren-
dered in less detail.
H3C. Eerie Human: CG faces perceived as more humanlike are eerier than
those perceived as less humanlike.
2.2 Methods
2.2.1 Participants
Participants for all studies were recruited by e-mail using a random sample from a
list of 126,425 undergraduate students and recent graduates from eight campuses
administered by a Midwestern university. In total, there were 3,294 participants
in all of the studies.
In the baseline–eerie survey, there were 458 participants: 81.2% were 18 to
25, 60.0% were female, and 95.9% were US born. The confidence level was 95%
with a ±4.57% error range. In the baseline–humanlike survey, there were 407
participants: 78.4% were 18 to 25 years old, 63.9% were female, and 92.9% were
US born. The confidence level was 95% with a ±4.85% error range.
2.2.2 Stimuli
Our previous studies on the effects of varying facial proportions used dissimilar
base figures (Green et al., 2008). To improve the experimental control of the
stimuli, a photorealistic 3D model of a male human head was developed. From
this photorealistic model two additional models with different skin textures were
derived: metallic bronze with simplified eyes and a line drawing. The top row of
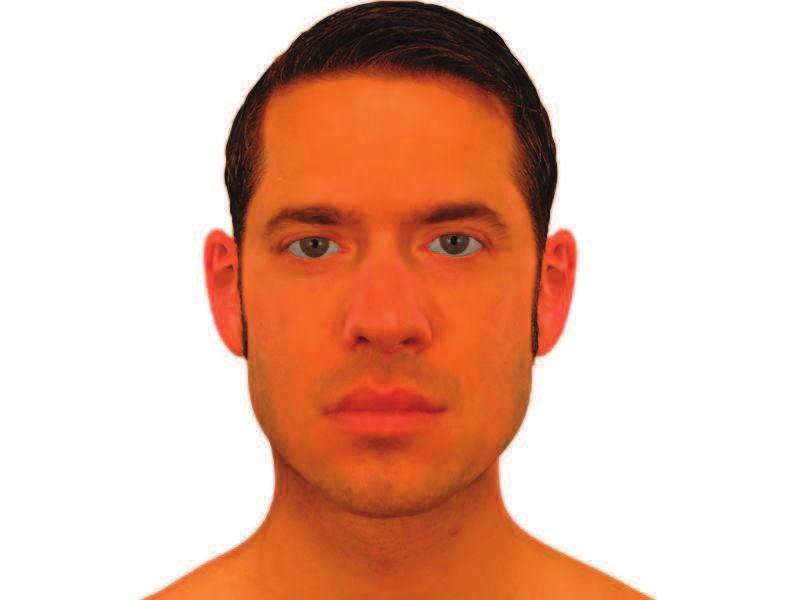
Figure 2 shows the models with these three skin textures.
The degree of photorealism in each model was varied by changing the level
of detail. To decrease the level of detail for the photorealistic and bronze models,
the number of polygons was reduced and smoothing was removed. For the line
model, the number of lines was reduced. All participants in Study I viewed a
total of 33 stimuli: the line, bronze, and photorealistic texture models at 11 levels
of detail each. For each texture the top row of Figure 2 shows the model at the
highest level of detail (level 11), the middle row shows the model at the median
level of detail (level 6), and the bottom row shows the figure at the lowest level of
detail (level 1). (Levels 2 to 5 and 7 to 10 are not pictured.)
15Fig. 2: Photorealistic, Bronze, and Line Texture Models at Varying Levels of
Detail
162.2.3 Procedures
To establish a baseline of the effects of the level of detail, a pilot study was con-
ducted. Participants were directed to a website that presented images with differ-
ing textures and levels of detail with facial features in their original proportions.
Participants rated each image on an 11-point semantic differential scale for either
eeriness (458 participants) or human likeness (407 participants). The presenta-
tion order of the 33 stimuli was randomized for each participant. The eeriness
scale was anchored at totally reassuring (−5) and totally eerie (+5). The human
likeness scale was anchored at totally nonhuman (−5) and totally human (+5).
2.3 Results and Discussion
Figure 3 shows that on average the photorealistic texture models were rated as
more humanlike than the bronze texture models, which were in turn rated as more
humanlike than the line textured models. The error bars indicate the 95% confi-
dence interval (CI). A one-way analysis of variance (ANOVA) confirmed that the
difference between the photorealistic texture and the bronze texture was highly
significant at all 11 levels of detail (F (1, 814) ranged from 168.12 to 593.33,
p = .000) as was the difference between the photorealistic texture and the line
texture (F (1, 814) ranged from 206.16 to 1138.93, p = .000). In support of H1A,
these results indicate that CG faces rendered with a more photorealistic texture
are perceived as more human. The increase in human likeness was much greater
when using a photorealistic texture in place of a bronze texture than when using
a bronze texture in place of a line texture. A one-way ANOVA confirmed that the
difference between the bronze texture and line texture only reached significance at
level 2 and 8 through 11 with F (1, 814) ranging from 6.60 to 58.20 and p ranging
from .010 to .000.
In support of H1B, ratings of human likeness increased as the level of detail
increased for the bronze and photorealistic texture CG faces. The correlation was
highly significant for the bronze (r = .16, p = .000, two-tailed) and photorealistic
texture models (r = .45, p = .000, two-tailed). The effect size was small for the
bronze texture model but large for the photorealistic texture model.
For the line texture, ratings of human likeness increased as the level of de-
tail increased only to the midpoint (level 6). From the midpoint, human likeness
decreased as the level of detail increased, which is counter to H1B. After the
midpoint, adding more lines made the line texture face look less humanlike. In
addition, the pupil and iris do not appear at the first two levels of detail in the
17Mean Nonhuman-Human Ratings with 95% CI
5
4
3
2
1
0
-1
-2
1 2 3 4 5 6 7 8 9 10 11
Level of Detail
Line Bronze Realistic
Fig. 3: Mean Human Likeness by Texture and Detail
line texture model. This could have a large effect given the importance of eyes in
social communication (Emery, 2000). Thus, it is unclear whether the low human
likeness ratings for the first two levels should be attributed to the model’s overall
level of detail or the fact that the eyes were missing. The correlation between the
level of detail and the ratings of human likeness was approaching significance for
the line texture model (r = .03, p = .051, two-tailed); however, the effect size
was almost negligible.
Interrater agreement (rwg ) (James, Demaree, & Wolf, 1993) on human likeness
for the bronze, line, and photorealistic textures was .55, .55, and .95, respectively.
Clearly, participant agreement on human likeness was much higher for the pho-
torealistic texture. Another indication of interrater agreement is the association
of the mean and standard deviation of human likeness ratings. Figure 4 shows
increased ratings of human likeness are associated with decreased standard devi-
ations for the photorealistic texture, but not for the line and bronze textures. The
correlation between the level of detail and the standard deviation in ratings of hu-
man likeness was not significant for the line texture model (r = −.02, p = .664);
however, it was significant for the bronze texture model (r = −.11, p = .032) and
highly significant for the photorealistic texture model (r = −.56, p = .000). All
three correlations were negative, and the effect size was large for the photorealis-
183.5
Standard Deviation of Nonhuman–Human Ratings
3
2.5
2
1.5
1
0.5
0
-2 -1 0 1 2 3 4 5
Mean Nonhuman–Human Ratings
Line Bronze Realistic
Fig. 4: Standard Deviation in Human Likeness by Mean
tic texture model, but small for the bronze texture model and almost negligible for
the line texture model.
Taken together, these results support H2 for the photorealistic texture model
only: sensitivity to human likeness increases with perceived human likeness only
for this model. These results indicate that only the photorealistic texture elicits the
specialized perceptual processing associated with increased agreement on human
likeness.
Figure 5 shows mean ratings of eeriness were lowest for the photorealistic tex-
ture. These results are contrary to H3A, which had predicted—in accordance with
Mori’s (1970) uncanny valley graph—that CG faces with higher texture photore-
alism would be perceived as more eerie. A one-way ANOVA confirmed that the
difference in eeriness ratings between the photorealistic texture and bronze tex-
ture was highly significant at all levels (for level 1 F (1, 914) = 11.95, p = .001
and for levels 2 through 11 F (1, 914) ranged from 14.93 to 64.20, p = .000).
Except for level 3, the difference between the photorealistic texture and the line
texture was highly significant at all levels (F (1, 914) = 9.73, p = .002 at level
4 and F (1, 914) ranged from 19.45 to 376.30, p = .000 at the remaining levels).
The difference between the bronze texture and line texture was highly signifi-
cant at level 3 (F (1, 914) = 10.30, p = .001) and levels 8 through 11 (F (1, 914)
192.5
Mean Reassuring-Eerie Ratings with 95% CI
2.0
1.5
1
0.5
0
-0.5
-1
1 2 3 4 5 6 7 8 9 10 11
Level of Detail
Line Bronze Realistic
Fig. 5: Mean Eeriness by Texture and Detail
ranged from 30.12 to 191.77, p = .000). It was significant at level 1 (F (1, 914) =
5.89, p = .015) and failed to reach significance at the remaining levels.
Figure 5 also shows mean ratings of eeriness decreased as the level of detail in-
creased for the bronze and photorealistic textures. This is contrary to H3B, which
had predicted—in accordance with the uncanny valley graph—that CG faces ren-
dered in more detail are eerier. For the line texture, ratings of eeriness decreased
initially, then increased as the level of detail increased. The initial decrease, how-
ever, could be attributed to the fact that the line model had no eyes at the first
two levels of detail, which could have contributed to their higher eeriness ratings.
The correlation between the level of detail and the ratings of eeriness was highly
significant for the line (r = .11, p = .000), bronze (r = −.19, p = .000), and
photorealistic texture model (r = −.26, p = .000). The correlation was positive
for the line texture model but negative for the bronze and photorealistic texture
model.
Figure 6 depicts an inverse relation between mean eeriness ratings and mean
human likeness ratings. This trend is contrary to H3C, which predicts—in ac-
cordance with the uncanny valley graph—higher perceived eeriness at higher per-
ceived human likeness. Increased level of detail led to ratings of increased human
likeness and decreased eeriness for the bronze and photorealistic textures (Fig. 6).
The ratings for the line textured figure almost doubled back on themselves. The
202.5
2
Mean Reassuring–Eerie Ratings
1.5
1
0.5
0
-0.5
-1
-2 -1 0 1 2 3 4 5 6
Mean Nonhuman–Human Ratings
Line Bronze Realistic
Fig. 6: Mean Eeriness by Mean Human Likeness
correlation between the ratings of human likeness and eeriness cannot be calcu-
lated, because they involve different sets of participants. However, the correlation
between the average ratings of human likeness and the average ratings of eeriness
was highly significant for the line (r = −.76, p = .006), bronze (r = −.99,
p = .000), and photorealistic texture model (r = −.99, p = .000). All three
correlations were negative, and their effect sizes were large.
An important question concerns why CG faces with higher texture photoreal-
ism, increased detail, and higher human likeness ratings tended to be less eerie,
when the uncanny valley graph seems to predict they would in fact be more eerie.
One interpretation is that the graph’s prediction is simply is false. However, there
is another, more likely possibility. The detailed, photorealistic CG face is de-
signed to resemble a human face, and a human face is in a sense the product of
evolutionary design—co-evolution involving selective processes, such as mate se-
lection and reproductive fitness, that affect both human perceptual mechanisms
and facial morphology. The various examples Mori (1970) provides of points
along his graph are the product of artistic design—humanoid robots and bunraku
puppets, for example. But in this study applying a bronze or line texture to the
model introduced perceptual artifacts that were not the product of an evolutionary
or artistic design process. In decreasing the polygon count in the less detailed CG
faces, for example, the placement of edges between polygons did not involve the
judgment of a trained artist. All images were created in Maya, and the level of
21detail was adjusted using automated tool settings. Clearly, tool settings are not a
substitute for the trained eye of an artist. This complicates the interpretation of
the results.
The outcome could be quite different, if we had started with, say, a cute, car-
toony Barbie doll and had added a photorealistic human texture. When adjusted to
human scale, Barbie’s waist is six-tenths that of a woman with anorexia (Norton,
Olds, Olive, & Dank, 1996). If a photorealistic texture elicits strong expecta-
tions of typical human proportions, a photorealistic Barbie doll could look very
eerie. The Study I results indicate the photorealistic texture had the largest effect
of any treatment. Faces with a photorealistic texture were rated as more human-
like and less eerie—with greater interrater agreement on human likeness—than
their bronze and line counterparts. The photorealistic texture may be engaging
specialized perceptual processing to a greater extent than the bronze and line tex-
tures. This processing could result in an averse reaction to an out-of-proportion
face with a photorealistic texture. The relation between extreme proportions and
the uncanny valley is explored in Studies III and IV.
3 Study II: Sensitivity to Best Proportion
MacDorman and Ishiguro (2006) and Hanson (2006) argue that acceptable norms
of attractiveness narrow as a form comes to look human. A face that looks sub-
stantially human but with nonhuman imperfections may be human enough to elicit
the perceivers’ innate or acquired model of a human other without being able to
satisfy the model’s expectancies in certain respects. If the range of what is ac-
ceptable narrows, because the stimulus has elicited specialized face processing,
it seems reasonable to assume that agreement on what is most attractive should
increase. Green et al. (2008) found sensitivity to facial proportions increased with
the human likeness of the face. But that study varied the human likeness of the
faces by using different faces, which introduces extraneous variation. It is impor-
tant to reproduce the results of that study by varying systematically the human
likeness of the same face.
An experimental apparatus was devised in the form of a Flash application
accessible from a website. Participants were able to adjust a face along a facial
dimension to determine and select which proportions looked best. As in Study I,
participants applied this procedure to CG faces that varied in texture photorealism
and level of detail.
223.1 Hypotheses
H4. Human Original: As human likeness increases, the best-looking facial
proportions lie closer to the original proportions of the human model.
The basic idea is that if a face looks human, it should elicit perceptual processing
that is specialized for faces. Given the significance of the face eliciting an affective
response that increases reproductive fitness, the range of what looks acceptable is
expected to be narrower than for objects in general. Therefore, if a human model
is chosen that already conforms to human norms, people would be likely to set
facial proportions close to their original values. However, if the face is made to
look less human—for example, by using a bronze or line texture instead of a pho-
torealistic one or by using fewer polygons—people might set the proportions to
be further from their original values. Without the strong activation of a human
model, proportions that look ideal could drift from human norms with perhaps
other aesthetic principles coming into play instead. We see this in cartoon depic-
tions of human beings, which can be beautiful despite having grossly diminutive
or exaggerated proportions (e.g., Jessica Rabbit in the film Who Framed Roger
Rabbit).
H5. Sensitivity Proportion: The more human CG faces look, the greater the
sensitivity to facial proportions, as measured by interrater agreement on
what proportion looks best.
The degree to which different people agree on what proportions look best is an-
other way of approaching the issue of whether more stringent norms are applied
to forms that look more human. If a more human-looking face is able to enlist
more specialized processing, it is reasonable to expect greater consistency in what
proportions different people judge to look best. For method triangulation, both
hypotheses are explored.
3.2 Methods
3.2.1 Participants
In the sensitivity–proportions experiment, there were 1,118 participants: 74.4%
were 18 to 25 years old, 60.1% were female, and 89.9% were US born. The
confidence level was 99% with a ±3.84% error range.
23F1
E1 E2
F2
C1 C2
F3
Fig. 7: Points Used in Measuring Facial Dimensions
3.2.2 Stimuli
The experimental apparatus sequentially presented participants with 18 faces that
varied along three dimensions. Each face varied by texture photorealism (photo-
realistic, bronze, and line drawing) and level of detail (low, medium, and high). In
addition, the participant could manually adjust the face along a third dimension:
either eye separation or face height.
Each of the 18 adjustable CG faces was implemented as a Flash video embed-
ded in a Flash application. These Flash videos were never played as such. Rather,
the video format was the internal representation used for the stimuli. When partic-
ipants manually varied a model’s facial proportions, at the implementation level,
they were stepping backwards or forwards through the frames of these videos.
Each video modified one facial proportion, eye separation or face height, from
−10% to +10% of the original value. Each video contained 41 frames with each
frame representing a 0.5% change in proportion. Thus, there were 738 stimuli in
total (18 videos × 41 frames).
Figure 7 depicts the points used for determining the facial dimensions. Eye
separation is defined as the distance between the pupils divided by the width of
the face at the cheekbones:
E2 − E1
(1)
C2 − C1
Face height is defined as the length of the lower face divided by the height of the
head. The length of the lower face is the vertical distance from the midpoint of a
line between the pupils to the chin; head height is the distance from the top of the
24head to the chin. Thus the formula for face height is
F3 − F2
(2)
F3 − F1
3.2.3 Procedures
Eighteen faces were sequentially presented, representing three textures, three lev-
els of detail, and two facial dimensions. Faces could be manually adjusted in either
its eye separation or face height. The presentation order and model’s initial facial
proportion were randomized for each participant. Participants were instructed to
use the left and right arrows to adjust the facial proportion until it looked best and
to indicate the best proportion by pressing a button. (They could either click on
the arrows using their mouse pointer or press the arrow keys on their keyboard.)
All 1,118 participants could have potentially viewed all 738 stimuli (41 frames ×
18 videos) by manipulating the arrows.
3.3 Results and Discussion
A one-way ANOVA shows a highly significant difference between the points se-
lected as best both by facial texture and level of detail (F (2, 2646) = 102.41 to
183.40, p = .000). The mean best points approach the original facial proportions
with increased human likeness (Fig. 8). The x-axis of Figure 8 is the humanlike
rating from the baseline survey.
The models are ranked from lowest to highest human likeness as follows: line–
low detail, line–high detail, bronze–low detail, line–middle detail, bronze–middle
detail, bronze–high detail, photorealistic–low detail, photorealistic–middle detail,
and photorealistic–high detail. The mean best points varied widely for the first
few stimuli, which were rated as more nonhuman than human. After that, the best
point for eye separation gradually decreased, approaching the actual proportion
for the faces rated as nearly human. A similar pattern occurred for face height,
though participants wanted the most humanlike image to have a slightly taller
face, perhaps because the hairline was placed too high in the CG model. Apart
from this, the photorealistic baseline CG models appeared to be close to the human
ideal for face height and eye separation. These results support H4: with increasing
human likeness, the facial proportions rated as best drew closer to the human
model’s original facial proportions.
The more participants agree on which facial proportion looks best, the lower
the standard deviation becomes in the proportions they determine are best. The
25Change from Original Proportion (%)
4
3
2
1
0
-1
-2
-
Human Likeness
Eyes Face
Fig. 8: Mean Best Point by Mean Human Likeness
standard deviation of the best facial proportion thus provides a measure of human
sensitivity to facial proportions (interrater agreement); however, sensitivity only
increased slightly with human likeness, and an analysis of variance of absolute
z-scores found no significant relation between human likeness and sensitivity to
facial proportions.
For facial texture a significant difference exists in the relation between sensi-
tivity and face height (F (2, 10057) = −3.99, p < .05, ω = 0.02). Tanhame post-
hoc tests indicate more sensitivity to the bronze (M D = 0.08, SE = 0.009, p =
.000) and photorealistic textures (M D = 0.10, SE = 0.010, p = .000) than to the
line texture. H5 predicted that as human likeness increased, participants would be
more sensitive to what facial proportions looked best, as measured by interrater
agreement. H5 was supported for texture photorealism but not level of detail.
Green et al. (2008) found sensitivity to facial proportions was related to the
degree of human likeness of the figure. But that study used different kinds of
stimuli (photographs of real, 3D CG, and 2D humans and robots). In this study
texture proved to be more important than the level of detail in determining sensi-
tivity to the best facial proportion. On the most photorealistic face, participants
set the eye separation very near to the model’s actual proportion. Texture could
be crucial in enlisting facial processing in the brain that applies human norms to
26facial proportions.
4 Study III: Eeriest Level of Detail
Ho et al. (2008) observed that a robot is eeriest when human elements create an
expectation of a human form that nonhuman elements fail to satisfy. Therefore,
it is worthwhile to determine whether extreme facial proportions, which are far
from human norms, would be perceived as eerier at higher levels of detail. This
would support evolutionary explanations—based on mate selection and pathogen
avoidance—that evolved or acquired perceptual mechanisms endow human beings
with heightened sensitivity to defects in human-looking faces (MacDorman &
Ishiguro, 2006).
4.1 Hypothesis
H6A. Eerie Detail, Eye Separation Off: Setting the eye separation of a CG
face to ±10% will cause the face to be perceived as eeriest at a higher level
of detail than at its original eye separation.
H6B. Eerie Detail, Face Height Off: Setting the face height of a CG face to
either ±10% will cause the face to be perceived as eeriest at a higher level
of detail than at its original face height.
4.2 Methods
4.2.1 Participants
In the sensitivity–eeriness experiment, there were 852 participants: 75.5% were
18 to 25, 62.0% were female, and 89.1% were US born. The confidence level was
99% with a ±4.40% error range.
4.2.2 Stimuli
The experimental apparatus sequentially presented participants with 15 CG faces
that varied along three dimensions. Each face varied by texture photorealism (pho-
torealistic, bronze, and line drawing) and facial proportion (original, widely-set
eyes, narrowly-set eyes, low face height, and high face height). In addition, the
participant could manually adjust the face along a third dimension: level of detail.
27Fig. 9: Facial Extremes: ±10% Eye Separation and Face Height
In selecting the eeriest level of detail, the participant had 11 levels to choose from
(as in Studies I and II), ranging from low to high.
The 15 CG faces were implemented as video data embedded in a Flash appli-
cation at a website. Five videos were created for each of the three textures, varying
the level of detail from low to high. A video was created for the original face and
two extremes (±10%) along the two facial dimensions: eye separation and face
height. Figure 9 shows these four extremes for the CG model with a photorealistic
texture and high level of detail. Each video contained 11 frames with each frame
representing a 10% step between low and high levels of detail.
4.2.3 Procedures
Fifteen CG faces were sequentially presented, representing three textures at five
facial proportions. The presentation order was randomized for each participant,
and the face’s initial level of detail was randomized for each face. Participants
were instructed to use the left and right arrows to adjust the level of detail until it
looked eeriest.
28You can also read