Tordesillas, Slavery and the Origins of Brazilian Inequality
←
→
Page content transcription
If your browser does not render page correctly, please read the page content below
Tordesillas, Slavery and the Origins of Brazilian
                     Inequality∗
   Thomas Fujiwara† Humberto Laudares‡ and Felipe Valencia Caicedo§
                                      June 4, 2021

                                         Abstract
           This article documents the long-term effect of slavery on inequality at
       the receiving end of the spectrum. We focus on Brazil, the largest im-
       porter of African slaves and the last country to abolish this institution in
       the Western Hemisphere, in 1888. To deal with the endogeneity of slav-
       ery placement, we use a spatial Regression Discontinuity Design (RDD),
       exploiting the colonial boundaries between the Portuguese and Spanish
       empires within Brazil. We find that the number of slaves in 1872 is dis-
       continuously higher on the Portuguese side of the border, consistent with
       this power’s comparative advantage in transatlantic slavery. We then show
       how this differential slave rate led to higher modern income inequality of
       0.103 points (of the Gini coefficient), approximately 20% of average income
       inequality in the country. To further investigate the mechanisms at play,
       we use the division of the former Portuguese colony into Donatary Cap-
       taincies as well as the Dutch colonization experience. Aside from the effect
       on income inequality, we find that more slave intensive areas have higher
       income and educational racial imbalances, and lower state capacity today.
JEL codes: O10, N36, O54, O43, I24
Keywords: Slavery, Inequality, Brazil, Regression Discontinuity Design, Colo-
nization, Institutions, Racial Income Gap, Education
   ∗
     We would like to thank Gani Aldashev, Jean-Louis Arcand, Matias Cattaneo, Matteo
Cervellati, Jorge Pimentel Cintra, Francisco Costa, Laura Chioda, Melissa Dell, Ellora Derenon-
court, Stanley Engerman, Ruben Enikolopov, Claudio Ferrraz, John Friedman, Oded Galor,
Camilo Garcia-Jimeno, Paola Giuliano, Andrea Ichino, Glenn Loury, Stelios Michalopoulos, Ed-
uardo Montero, Joana Naritomi, Nathan Nunn, Ugo Panizza, Luigi Pascali, Giacomo Ponzetto,
Claudia Rei, Moritz Schularick, Rodrigo Soares, Francisco Vidal Luna, Leonard Wantchekon,
David Weil, Leonado Weller, and seminar participants at Brown, Stanford, UBC, Toronto, SFU,
UC Davis, LSE, Pompeu Fabra, Bonn, ASREC Bologna, LACEA Sao Paulo, RIDGE Monte-
video, FGV-EESP, FEA-USP, INSPER, Stellenbosch, WEHC Boston, Madrid, Odense and
Los Andes for helpful comments. We thank Marcelo Sacchi and Fernando Secco for excellent
research assistance. All remaining errors are ours.
   †
     Princeton University and NBER
   ‡
     The Graduate Institute for International and Development Studies | Geneva
   §
     Vancouver School of Economics, University of British Columbia, CEPR and IZA

                                              1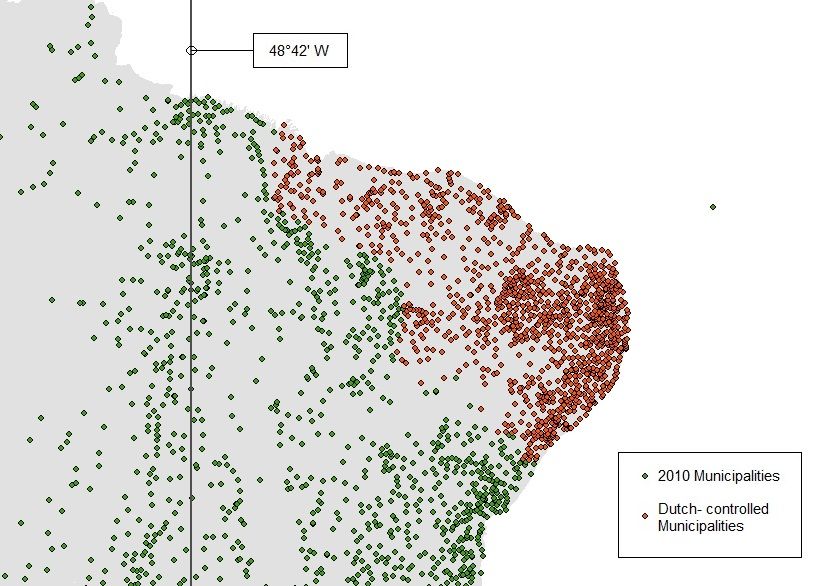
1       Introduction
The transatlantic slave trade constituted a defining demographic, social and eco-
nomic event in world history. It is now estimated that between the fifteenth and
the nineteenth centuries, more than 12 million slaves were taken from Africa of
which 10.7 disembarked in the Americas (Eltis and Richardson 2010). Although
the negative impact of this massive human trafficking has been documented for
exporting African nations (Nunn 2008b; Nunn and Wantchekon 2011), less is
known about the long-term impact of slavery as an institution on the receiving
end of the spectrum. The analysis is complicated due to the endogenous place-
ment of slaves, as well as the lack of historical data, especially at a granular
level.
    To make progress on this important question, in this paper we focus on Brazil.
This country is particularly well suited to study the aftermath of slavery, as the
largest recipient of African slaves in history. Brazil was also the last country in the
Western hemisphere to abolish this institution, in 1888. This allows us to use the
1872 Census to estimate the intensity of slavery at the municipal level.1 At the
same time, Brazil remains one of the most unequal countries in the world today
(Milanovic 2011). Hence our motivation here is twofold. First, we are interested
in evaluating the impact of slavery on income inequality at the sub-national level.
Conversely, we want to explore the historical roots of modern economic inequality
in one of the most unequal societies in the world.
    Conceptually, we perform a quantitative re-examination of the famous Enger-
man and Sokoloff hypothesis (1997). According to this thesis, the development
trajectories in the Americas can be explained by initial factor endowments and
subsequent colonial productive structures, which affected inequality and develop-
ment in the long run. In this paper we focus on the link between transatlantic
slavery and economic inequality. Even though this hypothesis has been examined
at the cross-country level (Nunn 2008a; Soares, Assunção, and Goulart 2012),
a careful sub-national analysis could help to isolate the confounding effect of
national-level institutional, historical and cultural legacies.2 We are further in-
terested in the underlying mechanisms of transmission leading to inequality and
potentially underdevelopment in the long run.
    1
     Notably, according to the 2010 Census, the majority of Brazilians defined themselves as
non-white.
   2
     Different from Lagerlöf (2005) and Fenske and Kala (2015) we do not focus here on evalu-
ating the impact of geography or climate on slavery, since these are continuous variables in our
analysis, but on the impact of slavery on inequality and income.

                                               2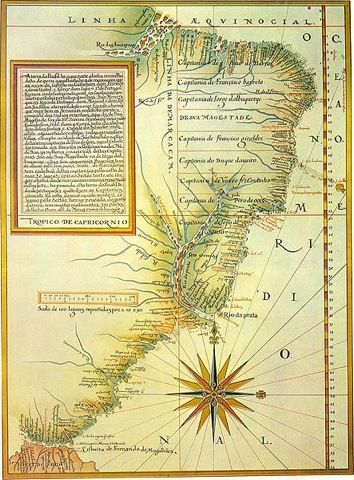
In our empirical analysis, we conduct a geographic Regression Discontinuity
Design (RDD). We exploit the historical discontinuity provided by the Treaty
of Tordesillas (1494), dividing the Spanish and Portuguese empires in the New
World. Interestingly, the drawing of the Tordesillas line pre-dated the discovery of
South America, which occurred during the third voyage of Christopher Columbus
(1498). Still, the Tordesillas Treaty provided the foundation for the eventual
Portuguese colonization of the continent (Seed 1995; Herzog 2015). Crucially,
Portugal had a comparative advantage in slave trade relative to Spain, due to its
previous exploration of the African coast as well as its plantation experience in
Sao Tomé and the Azores Islands.
    To assess the effect of slavery, we use as running variable a municipality’s
distance to the Tordesillas line. For estimation we use the non-parametric method
proposed by Calonico, Cattaneo, and Titiunik (2014) combined with the donut
RDD of Barreca et al. (2011). Empirically, we find that the number of slaves in
1872 is discontinuously higher on the Portuguese relative to the Spanish side of
the Brazilian colonial border, consistent with the historical narrative. In modern
times, we observe a discontinuous jump in income inequality. The estimates
for 2010 range from 0.104 Gini coefficient points, or 20.76% of Brazilian income
inequality, to a more conservative bound of 0.0384 points or 7.6% of the sample
average, using a local randomization approach (Cattaneo, Frandsen, and Titiunik
2015). We do not find a substantial effect on the level of income, as hypothesized
by Engerman and Sokoloff, suggesting that the effect of slavery is working in this
case on the second moment of the income distribution (as in Nunn 2008a).
    To better understand the effect of slavery on income inequality, we focus on
the racial income gap. There we find again a large and significant discontinuity, on
the former Portuguese side of the border, where more slaves inhabited historically.
Further income decompositions reveal important differences within the white and
black populations. The income of black relative to white households is on average
9% lower than for white households. The income inequality between groups, using
a Theil index, appears less pronounced. The racial income gaps parallel the racial
gaps in education. In term of mechanisms, we find around 10% lower education
for black relative to white households at the discontinuity. Additional tests reveal
negligible effects on land inequality, higher expenditures in education, but lower
institutional capacity (Naritomi, Soares, and Assunção 2012).
    We also explore regional differences within Portuguese Brazil, to study the
effect of slavery at the intensive margin. To this end, we focus on the Donatary

                                         3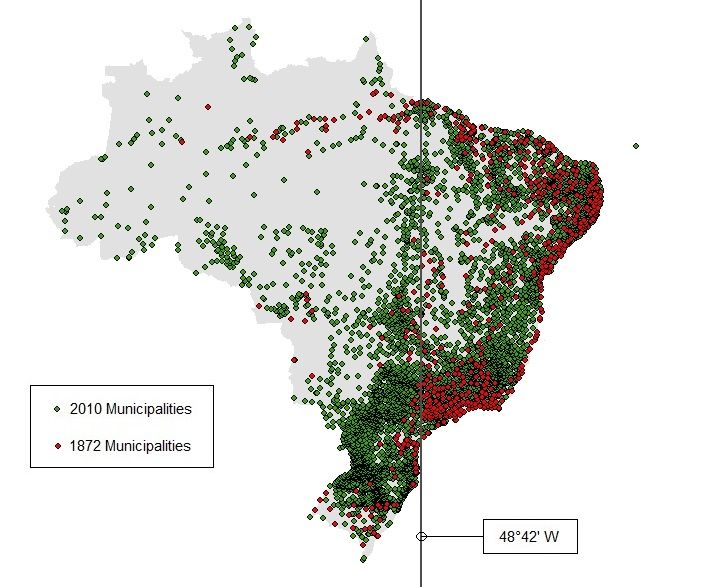
Captancy system, which the Portuguese Crown established during the early colo-
nization of Brazil. This system is tightly linked to slavery and land inequality in
Brazilian historiography (Mattos, Innocentini, and Benelli 2012). The empirical
results for Donatary Captaincies mimic those for the Tordesillas line, whereby
higher slavery during colonial times results in higher income inequality. The re-
sults for land inequality are marginally significant and those for the education
racial gap are more muted.
    To examine the potential role of colonizer identity, we look at the case of Dutch
Brazil. The Dutch had an important early colonial presence in the Brazilian
Northeast. Even though they might have been more different culturally from
the Portuguese than the Spaniards, they were also major slave traders. Hence
with this case we can distinguish between colonial cultural legacies and slavery
policies. Empirically, we find no significant differences in the number of slaves
imported, relative to the Portuguese and no corresponding differences in terms
of inequality later on. The results suggest that slavery and not colonizer identity
mattered for inequality in the Brazilian case.
    Lastly, we explore other mechanisms of persistence that have been suggested
in the literature. We mostly follow Engerman and Sokoloff (1997), finding no
significant effects on historic or modern voting. We do find significant results in-
stead for structural transformation as early as 1920, suggesting a more advanced
economy on the Portuguese side of the border. There are no significant differ-
ences on a variety of measures of institutional presence, but important ones in
self-organized racial equality councils. In terms of health, a complementary com-
ponent of the human capital function, there are no significant differences except
for violent deaths. Demographically, there are no large jumps for white, pardo,
black or international populations in modern times (cf. Fogel and Engerman
1974; Bertocchi and Dimico 2019). The effect on trust is observable, though
muted, with the exception of trust in the judiciary (as in Nunn and Wantchekon
2011).

1.1    Literature
Recent empirical research has quantified the negative economic impact of slave
trade on origin African countries. Nunn (2008b) explains part of Africa’s current
underdevelopment with slave intensity, relying on data from shipping records and
matching them to ethnicities today. Focusing on mechanisms of transmission,
Nunn and Wantchekon (2011) show a negative relationship between an individ-

                                         4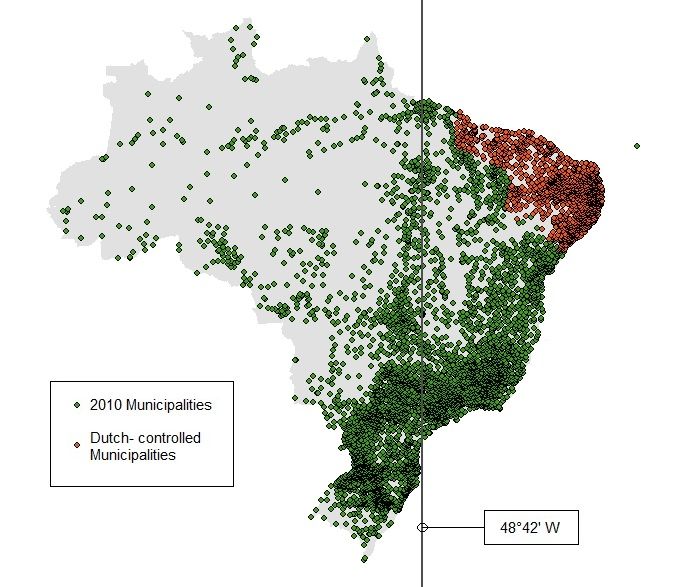
ual’s reported level of trust in others and the number of slaves taken from his
/ her ethnic group during the transatlantic slave trades. Follow up papers have
continued this line of inquiry. For instance, Fenske and Kala (2017) have related
slavery to conflict, Bertocchi and Dimico (2019) to the prevalence of HIV/AIDS,
Bertocchi and Dimico (2020) to family size, Teso (2019) to modern female labor
force participation, while Lowes and Montero (2019) look at the particular case
of the Congo.3
    The effect of slavery as an institution on receiving and trading nations is rel-
atively less well understood. Nunn (2008a) examines the Engerman and Sokoloff
hypothesis empirically, using data at the national level. He finds again that
slavery is related to underdevelopment, but that the relationship is not working
through inequality. In turn, Soares, Assunção, and Goulart (2012) document
a strong correlation between slavery and modern levels of inequality in a cross
section of countries. Derenoncourt (2018) instead documents a positive effect of
slavery on European ports involved in this trade.
    Focusing on the US, Fogel and Engerman’s watershed Time on the Cross
(1974) provided a critical historic and quantitative re-examination of the Ameri-
can slavery experience. The authors documented the relatively low levels of slave
imports, the higher than average reproduction rates and quantify the productivity
of the slave economy. This seminal piece led to many other contributions includ-
ing Smith (1984), Margo (1990), Coatsworth and Taylor (1998) and Mitchener
and McLean (2003). More recently, Lagerlöf (2005) looked at the role of geogra-
phy, Naidu (2012) at suffrage and schooling, and Bertocchi and Dimico (2014) at
education. Gouda and Rigterink (2013) and Buonanno and Vargas (2019) link
slavery to higher crime, while Acharya, Blackwell, and Sen (2016, 2018) analyze
its sweeping impact on southern politics.
    Still, our knowledge of the long-term economic impact of slavery remains rel-
atively precarious going south of the border. Dell (2010) documents the negative
long-term effect of the mita labor system in Peru and Bolivia. Though this forced
labor institution was not equivalent to slavery, this is perhaps the closest arti-
cle conceptually. In a lone exception, Acemoglu, Garcıa-Jimeno, and Robinson
(2012), document the negative impact of slavery in Colombia, using variation in
gold mines historically. Naritomi, Soares, and Assunção (2012) stress the impor-
tance of colonial booms for Brazilian economic development. Notwithstanding,
  3
    Pierce and Snyder (2018) and Levine, Lin, and Xie (2020) document the impact of slavery
on lower credit and access to finance.

                                            5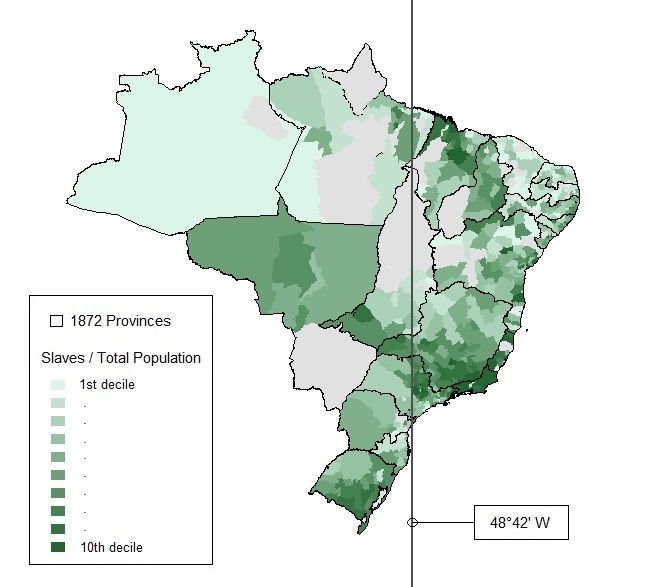
this is the first paper to quantify the effect of slavery in Brazil, the largest recipi-
ent of African slaves in world. We contribute to this literature with new data and
a novel econometric identification strategy, based on former colonial boundaries.
    We also contribute to the booming literature on historical inequality (Piketty
and Saez 2003, 2006, 2014; Piketty 2014, 2020). In particular, as is pertains
to Brazil both during historical (Milá 2015; Souza 2016; Wigton-Jones 2019)
and modern modern times (Ferreira, Leite, and Litchfield 2008; Bourguignon,
Ferreira, and Menéndez 2007; Arretche 2018).4 We focus here on the underlying
institutional structures leading to these income distributions, rather than the
political or ideological dimensions of this problem (Gethin 2018; Piketty 2020;
Small and Pager 2020). To this end we build on the historical comparative
development literature, summarized by Nunn (2009, 2014, 2020), Spolaore and
Wacziarg (2013), and Michalopulos and Papaioannou (2017).
    The rest of the paper is organized as follows. In the next section, we provide
the historical background in terms of the Tordesillas Treaty, as well as slavery in
South America and Brazil. Section 3 presents the identification strategy and esti-
mation framework, and Section 4 describes the data. Section 5 contains the main
empirical results of the paper. Section 6 presents mechanisms of transmission
and Section 7 robustness tests. Section 8 concludes.

2       Historical Context
2.1     Tordesillas Treaty: Spanish and Portuguese South
        America
The Treaty of Tordesillas was signed soon after the discovery of the New World
in 1492. After Columbus arrival from the Americas, in 1493, King Ferdinand II
of Aragon, Queen Isabella I of Castile and King John II of Portugal secured two
papal bulls - called Inter Caetera. The bulls entrusted the European monarchs
with the duty to convert indigenous people in return for rights in territories
discovered west of the meridian passing 370 leagues off the Cabo Verde and Azores
Islands (Herzog 2015). In 1494, the Spanish and Portuguese monarchs formally
signed the Treaty of Tordesillas, in the province of Valladolid, Spain.5 The treaty
    4
     We also contribute to the small literature on racial inequality in Brazil (Soares, Assunção,
and Goulart 2012; Hirata and Soares 2020; Botelho, Madeira, and Rangel 2015).
   5
     The Tordesillas Treaty replaced the 1479 Alcáçovas Treaty between Spain and Portugal.
Pope Julius II confirmed the Tordesillas Treaty in 1506.

                                                6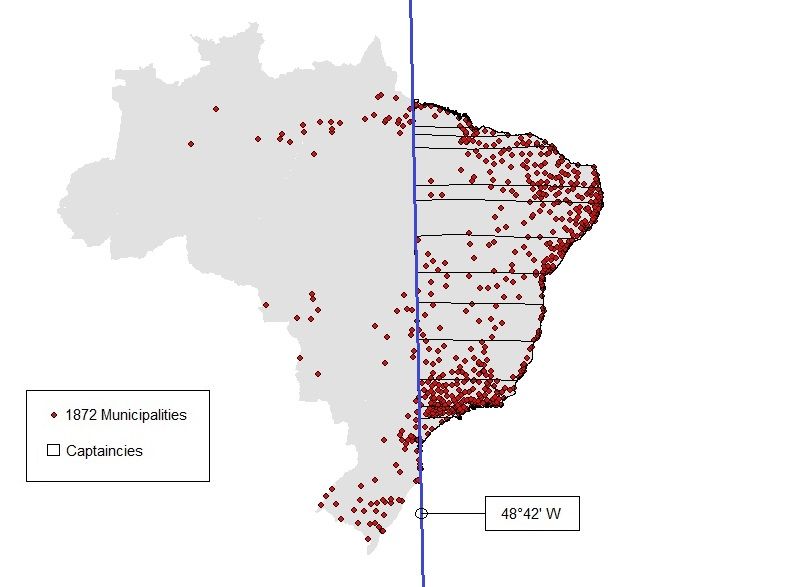
effectively separated the globe by a meridian located 370 leagues (approximately
1,850 kilometers) to the west of the Cape Verde Islands. Lands to the east of the
meridian would be Portuguese, while those to the west would be Spanish.
    The demarcation of the Tordesillas Line pre-dated the discovery of Brazil. The
northern tip of South America was only sighted during Columbus third voyage in
1498-1500. The actual discovery of Brazil by Pedro Álvares Cabral occurred on
April 22, 1500. Still, the preexisting Tordesillas Treaty dictated the borders of the
New World and provided the foundation for the Portuguese colonization of South
America (Seed 1995). The actual implementation of the Treaty was not without
controversy (Cintra 2013; Herzog 2015). Spanish and Portuguese representatives
met later in Badajoz and Elvas in 1524 and signed in 1529 the Treaty of Zaragoza.
This treaty confirmed the American boundaries and additionally demarcated the
anti-meridian, defining the Spanish and Portuguese claims in Asia settling the
claims for the Moluccas Islands.
    In the 1530s, Spain and Portugal disagreed on the territory of the River Plate,
in modern-day Argentina and Uruguay. From 1580 to 1640, Spain and Portugal
were under the same kingdom, the Iberian Union, largely ignoring the Tordesil-
las Treaty. Immediately after, in 1641, Portuguese troops invaded the Spanish
territory of Omaguas, in present-day Peru. An important flashpoint was the set-
tlement of Colonia de Sacramento, in present-day Uruguay, on the River Plate
delta, right in front of Buenos Aires. Disputes were later settled by the Lis-
bon Treaty of 1681. During the eighteenth century, disputes included territories
that are currently located in Brazil, Paraguay, Uruguay, Argentina, Venezuela,
Colombia, Ecuador, Peru and Bolivia. Again tensions were resolved with the
The Treaty of Utrecht in 1715, in the context of the War of Spanish Succession.
But it was not until the Treaty of Madrid in 1750, that the modern Brazilian
boundaries were finally established. The treaty was annulled in 1761, integrated
into the Treaty of Paris in 1763 and finally ratified by the San Idelfonso Treaty, in
1777. Still, despite the complications, for most of the Brazilian colonial era, the
Tordesillas Treaty demarcated the Spanish and Portuguese boundaries in South
America (Herzog 2015).

2.2    Slavery in South America
Modern historical scholarship, using port to port data, estimates that between
the fifteenth and the nineteenth centuries more than 12 million slaves were taken
from Africa, of which 10.7 million disembarked in their destinations (Eltis and

                                         7
Richardson 2010). 45.6% of that total number of slaves arrived to Brazil from
1501 to 1867.6 21.5% of that grand total landed in southeast Brazil, 14.7%, in
Bahia, 8.1%, in Recife and 1.3% Amazonia, as detailed later. By 1790, slaves in
Brazil outnumbered US slaves by two to one and it is estimated that as many as
4 million slaves were imported to the country, four times the US total. Overall,
Brazil was the destination for almost half of the African slaves who were shipped
across the Atlantic.
Portugal had a comparative advantage in slave trading for historic reasons.
Since the times of Henry the Navigator in the fifteenth century, Portuguese sailors
had started exploring the African coast. In 1488, Bartolomeu Dias rounded the
Cape of Good Hope and in 1498 Vasco da Gama reached India. The Portuguese
established a seaborne empire reaching all the way to India and the Moluccas
islands (Boxer 1969). In Africa, as in India and Asia, they set up a series of
factories or trading posts along the coast. Additionally, they set up plantation
economies in Madeira, Sao Tomé, the Azores and Cape Verde Islands, which
largely served as pilot projects for the eventual colonization of Brazil.
Slavery was one of the main pillars of the Portuguese colonial model estab-
lished in Brazil after 1500. Slaves played an important role in agriculture and
local societies, reflecting a key difference from previous systems. Several reasons
led to the importing of African slaves into Brazil starting in 1570. One was the
relative scarcity of Indian labor. Brazilian Indians were not used to agriculture or
taxation, unlike the Amerindians located in Mexico or Peru. Second, Portuguese
colonizers were eager to populate Brazil to avoid potential invasions from other
European powers (such as the French, English and Dutch) increasingly interested
in the Americas. As detailed later, the funds to cover the import of African slaves
would come mostly from increasing revenues of sugar exported to Europe.
In the Spanish case, transatlantic trade was mostly focused on Central Amer-
ica and the Caribbean.7 The Spaniards transported 8,000 slaves to Rio de la
Plata, while the majority of the slaves went to Cuba (600,000 out of 885,000).
Slavery was further developed in the Spanish Americas at the beginning of the six-
teenth century. In countries such as Mexico, Peru and Central America, African
slaves were employed in mining activities. But already as early as 1600, the num-
ber of slaves arriving in Brazil surpassed the total number for Spanish America.
6
The Yale transatlantic project takes this date, after the US Civil War, though slavery in
Brazil was abolished two decades later in 1888.
7
The New Laws of 1542 limited—at least in principle—the enslavement of indigenous people
in the Spanish Empire.
8Over time, the Brazilian slave plantation model became a reference for English,
French and Dutch colonies. It is estimated that the British, French, North Amer-
ican and northern European countries brought about 47,000 slaves in Rio de la
Plata. In the rest of South America, 0.6% of the slaves landed in Rio de la Plata,
0.3% French Guiana, 2.8% in Dutch Guiana and 0.7% British Guiana.
As noted before, Brazil was the last country in the Americas to end slavery
in 1888. Haiti was the first country to abolish slavery in 1804, followed by Chile
in 1823 and Mexico in 1829 (Bergad 2007). These countries followed a similar
processes starting with the end of the trading of slaves, followed by a free birth
or free womb law for newborns, finishing with the final abolition of the slavery
labor regime (Table B1).
2.3 Slavery in Brazil
Brazil received subsequent waves of African slaves as early as the sixteenth cen-
tury, closely following colonial economic booms (Bethell 1987; Klein and Luna
2009; Naritomi, Soares, and Assunção 2012). The initial wave of slavery was
channeled towards the production of sugar cane, and was mostly concentrated in
the northeast of the country (Schwartz 1974). By 1640, the number of slaves in
Portuguese America was larger than in any other American colony. The Dutch
also played an important role in the early development of Brazilian slavery with
the invasion of Pernambuco from 1630 to 1651. The Dutch transported 28,000
slaves to Recife between 1630 and 1654.
The discovery of gold and diamonds in the current state of Minas Gerais
(general mines, in Porguese) at the end of the seventeenth century started a new
type of slave economy in Brazil. The number of slaves dramatically increased in
the country. From 1716 to 1730, gold production was about 14,000 kilograms per
year in Minas Gerais and the neighboring state of Goias. The gold period was
followed by a precious stones export boom as Minas Gerais became the world’s
largest supplier of diamonds. By 1800, Brazil had one million African slaves,
more than any other country in the world (Klein and Luna 2009). The slave
population growth resulted in an important native-born slave population by the
end of the eighteenth century.
Another important economic product for slavery was cotton. In the North of
Brazil, the General Trade Company of Grao-Para and Maranhao had a monopoly
over cotton plantations in the region using slave workforce. The company ex-
ported raw cotton to England to produce textiles. By 1850, when England
9forcibly halted the maritime slave trade, internal slave trade grew substantially.
The American Civil War (1861-1865) benefited Maranhao because the south of
the United States was the largest producer of cotton at the time. At the end
of the eighteenth century, the production of cotton in the Brazilian northeast
started to decay and some plantations reverted into sugar.
The last major boom was the production of coffee in Rio de Janeiro and,
eventually, Sao Paulo states. These regions had already been connected with the
slave trade of the mining areas. By 1872, the area of Rio de Janeiro and the
neighboring region in Sao Paulo (Vale do Paraiba) had mastered the techniques
of mass coffee production. It was only around the 1880s that coffee expanded
to the west of Sao Paulo and the southern region of Minas Gerais. Brazil soon
became the largest coffee producer in the world. Coffee production relied on slave
labor at this stage, albeit not exclusively (Mello 1977).
To summarize, 53% slaves were located in the northeast of the country produc-
ing sugar as late as the 1820s, moving to 67% of slaves in the southeast producing
coffee (Engerman 2015). Table B2 shows the relative importance of the different
colonial booms in relation to slavery.
3 Data
To study the long-term effect of slavery we combine historical records with modern
economic outcomes, along with geographic and weather controls. Historical data
comes from the Brazilian imperial Census of 1872 and is matched to modern-day
Brazilian municipalities. The census records the age, sex, civil status, religion and
crucially the status (slave or free) of the respondent. We use the ratio of slaves
over the total population as a variable to capture slavery intensity at the municipal
level. We corroborate this information using the aggregate figures provided by
Eltis and Richardson (2010). Other historical controls such as the prevalence of
sugar, coffee and gold booms are from Naritomi, Soares, and Assunção (2012).
Modern outcomes come from the Brazilian IBGE and IPEA data portals. Our
main variables are income inequality, GDP per capita, income racial imbalance
and education racial imbalance. These measures are from the 1991, 2000 and
2010 censuses and are again at the municipality level. We also use individual
level data from the 2010 census, to calculate our own Gini and Theil inequality
measures and decompositions.
We also employ a host of geographic and weather controls, at a highly disag-
10gregated level, coming from Brazil’s National Institute of Geology (INGEO) or
calculated using ArcGIS. These include: rainfall, altitude, distance to the coast,
distance to Portugal, latitude, longitude, sunlight, distance to the Equator and
temperature. All variables and their sources are detailed in the Appendix.
3.1 Summary Statistics
We present the summary statistics, divided between Portuguese and Spanish
Brazil in Table 1. For this division we use the meridian 48o 420 (48.7 degrees) west
for the Tordesillas line (Cintra 2013). In total, our data contains the universe of
Brazilian municipalities: 3,367 on the former Portuguese side and 2,136 on the
former Spanish side. We can already see using this basic split that the number
of slaves over the total population of Portuguese Brazil in 1872 was 14.7% in
the Portuguese side and 10.6% in the Spanish side. The average number of black
slaves by municipality in Portuguese Brazil was 2,628, and 1,184 in Spanish Brazil.
We can also see in Table 1 that the current income inequality –measured by
the Gini coefficient– in Portuguese Brazil is 0.514 and 0.486 in Spanish Brazil.
The latter also appears richer and has a slightly lower income racial imbalance
(measured as average black income of black households over the average income
of white households). On the other hand, the educational racial imbalance ap-
pears higher in Spanish Brazil (measured as ratio of illiteracy rate of black over
white households). We explore the relationship between these variables more
systematically in the empirical analysis.
Figure 5, upper panel, shows the distribution of the municipalities around the
Tordesillas line in 1872, in the left panel. At the time, 15.9% of the municipalities
were located west of the Tordesillas and 84.1% to the east. The first city founded
in Portuguese Brazil dates from 1534, while in Spanish Brazil it dates from 1635.
Despite this general difference, there appears to be no differences in the Figures
between the number of municipalities at the two sides of the Tordesillas line in
1872 and 2010. We test this more formally using a McCrary test, where again we
do not find evidence of sorting across the threshold (in Figure 5, lower panel).
4 Empirical Strategy
The fundamental challenge in conducting an empirical analysis of the long-term
impact of slavery is the endogenous placement of slaves. Slaves were, for instance,
sent to mines (Acemoglu, Garcıa-Jimeno, and Robinson 2012) and employed in
11highly productive activities, such as cotton harvesting in the US South (Fogel
and Engerman 1974) and sugar production in the Brazilian northeast (Naritomi,
Soares, and Assunção 2012). Hence, without isolating the independent roles of
these activities, one can naively conclude that slavery resulted in higher economic
activity. To tackle this issue, we propose a new identification strategy based on
early colonial territorial boundaries. The idea is to combine the latest cartograph-
ical and historical research with standard econometric techniques. To isolate the
impact of slavery from other confounders, we use a Regression Discontinuity De-
sign (Imbens and Lemieux 2008; Angrist and Pischke 2008; and Lee and Lemieux
2010; Cattaneo, Frandsen, and Titiunik 2015).
Historically, we will focus on what Tamar Herzog (2015) calls the Frontiers
of Possession of the Spanish and Portuguese empires in the Americas. As can
be seen in Figure 1a, the Tordesillas Treaty Line of 1494 delimited the Spanish
and Portuguese empires in the New World. The territory to the right of the
line was colonized by the Portuguese, who had a comparative advantage in slave
trading, as described before (see Figure 1d). The key for identification is to
exploit econometrically this colonial discontinuity between the Portuguese and
Spanish empires, within modern-day Brazil, while holding geographic, weather
and other local factors constant (or continuous).
Moreover, as can be seen in Figure 1b, the Portuguese territories themselves
were divided into Donatary Captaincies that also followed differential colonization
patterns (Mattos, Innocentini, and Benelli 2012). In this case, the potential
differences emerge from the ideosincracies of the governing captains, within the
same de jure (royal Portuguese) framework. The idea here is to exploit these
almost geographic partitions of space to identify potential variations in slave
intensity, at the intensive margin.
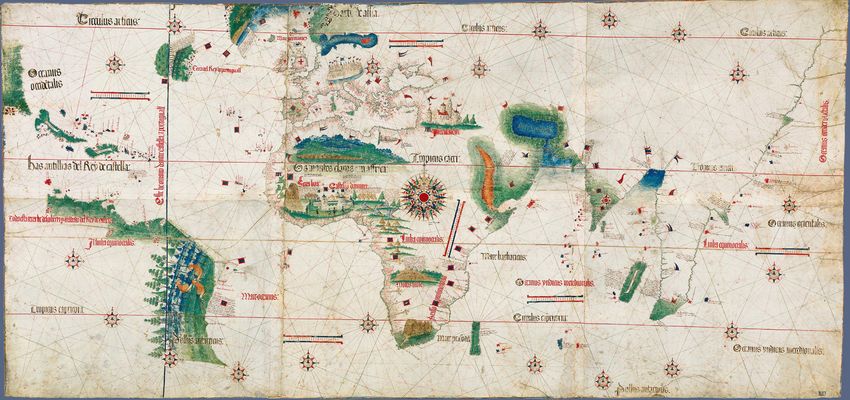
One last territorial difference emerges from the Dutch colonization of Brazil, as
can be seen in Figure 1c. Though shorter lived, this colonization wave played an
important role in northeast Brazil, leaving an imprint on the modern-day state of
Pernambuco (De Mello 2010). We explore this additional source of heterogeneity
employing a geographic RDD (as in Dell 2010).
4.1 Estimation Framework
For our main specification, we use an RDD along the Tordesillas line. The
geodesic distance to the Tordesillas line functions as an assignment variable to
measure the long-term impact of slavery. We can also relax the linearity assump-
12tion and include polynomial functions in the regression model. A polynomial
model generates global estimates of the regression function over all values of the
assignment variable. It can be a disadvantage because the RD design depends on
local estimates of the regression function at the cutoff point (Lee and Lemieux
2010; Angrist and Pischke 2008). Gelman and Imbens (2014) , for instance, ar-
gue that estimators for causal effects based on high-order (third, fourth or higher)
polynomials of the assignment variable can be misleading. The authors recom-
mend using estimators based upon smoother functions such as local linear and
quadratic polynomials, which we follow.
In its simplest form, our regression equation has the form:
Yi = α + D i τ + Xi β + ε (1)
where Yi is the outcome variable of interest for a municipality i, Di is the side
on which the municipality is located with respect to the Tordesillas line (Di =1
when the municipality is east of the Tordesillas line and Di =0 if it is located west
of this meridian), τ is the coefficient of interest and Xi is a vector of covariates.
We only follow this simple formulation when presenting the summary statistics.
In our regressions, we reinterpret Di as a distance variable from the centroid of
a municipality to the Tordesillas line. In our convention a distance to the east is
positive and to the west, negative.
For our empirical estimations, we apply the methodological framework devel-
oped by Cattaneo, Frandsen, and Titiunik (2015), which analyzes RD designs as
local randomized experiments, employing a randomization inference setup. This
method assumes exact finite-sample inference procedures, given that there might
be few observations available close to the threshold where local randomization is
more probable. This is a two-step procedure: first, we choose the window around
the cutoff where the treatment is assumed to be as good as randomly assigned;
and second, we apply the conventional randomization inference tools.
We also implement the Donut RD approach used by Barreca et al. (2011).
The authors argue that heaping can generate significant biases, including when
the data heap does not fall close to the treatment threshold. This method appears
germane to our context given the uncertainty of the Tordesillas Treaty line. The
Donut RD estimates equation 1 dropping observations right at the cutoff. Barreca
et al. (2011) argue that Donut RD results in unbiased estimates of the treatment
effect on continuous data. The conventional RD design for heaped data can be
unbiased, although it tends to reduce the bandwidth.
135 Results
Before presenting the RDD results, we estimate OLS and state fixed effects for
the whole dataset to capture broader correlations (Table 2). The results show a
correlation of slavery—measured by the ratio of the number of slaves in 1872 over
the total population—with current development outcomes (income inequality,
GPD per capita, the income and education racial imbalances). We find that
a 1% increase in slaves by municipality in 1872 increases the Gini coefficient—
our measure of income inequality-—by 0.130, estimated with state fixed effects,
clustered by region and geographical controls.8
Slavery also negatively affects the income and education imbalances between
black and white people. For each 1% increase in the number of black slaves, the
average income of a black household in relation to a white household declines
by 39.5%, while the average illiteracy rate of black households relative to white
households increases by 36.7%. Table 2 reports the OLS and municipality fixed
effects results for the whole sample.While the results show that inequality persists
between the two groups, slavery is still positively associated with current GDP
per capita, in this formulation.
Table B5 shows the state fixed effects estimates for Portuguese and Spanish
Brazil separately. The first conclusion is that current income inequality is pos-
itively correlated to the proportion of slaves in the municipalities back in 1872
for both sides of the Tordesillas line. On the Portuguese side, the current income
and education racial imbalance are also associated with slavery in the nineteenth
century. For a 1% increase in the number of slaves in a given municipality in Por-
tuguese Brazil, the income imbalance declines by 24.3% and the illiteracy rate
(education imbalance) increases by 35.1%. These results are insignificant for the
Spanish side, as are those for GDP.
5.1 Tordesillas and Slavery
As discussed before, in the historical and estimation framework sections, we per-
form a Donut RD for our baseline estimates (Barreca et al. 2011). This approach
deals with data heaps and can account for the problem of uncertainty about the
actual colonial boundary. As the parameter for the interval around the Tordesillas
line, we use the measure of 1o , approximately 73 km. The Donut RD does not vi-
8
The geographic variables used are longitude, latitude, rain, distance to the coast, altitude,
distance to the federal capital, sunlight, average monthly temperature and types of soils.
14olate the condition that variation close to the treatment threshold is randomized.
The estimation of the local linear regressions follows the bias-corrected inference
procedure, which is robust to “large” bandwidth choices (Calonico, Cattaneo, and
Titiunik 2014). We present local polynomial estimates and other specifications,
for robustness.
Figure 2 shows the RD plots for the number of black slaves over the total
population in 1872 using binned local averages. The first graph suggests that
there were indeed more slaves in the Portuguese relatively to the Spanish side,
consistent with the historical narrative. Figure 3 shows that there is no discon-
tinuity for the number of free people in 1872, while there is for the number of
black slaves.
Figure 2 shows that there is a discontinuity in income inequality - our main
outcome variable - at the cutoff. Other outcome variables also have visual dis-
continuities (Figure 6), such as GDP per capita, the income racial imbalance and
education racial imbalance.
Figure 4 shows that observed pre-determined characteristics such as the ge-
ographical variables have similar distributions on both sides of the cutoff. The
density of municipalities in the east and west side of the Tordesillas is also well
distributed in 1872 and 2010 (Figure 5). We test the observables, and we reject
the possibility of not having randomization around the cutoff.
The RD estimates are presented in Tables 3 and 4. Table 3 exhibits the linear
RD estimates, whereby the first column refers to estimates of the entire sample
and the other four columns contain the results with restricted data. In the context
of RD, we are interested in the variation around the cutoff. Therefore, we believe
that there is no substantial reason to evaluate the influence of the Tordesillas line
more than 1,000 km away from the line. Nevertheless, we report the results for
the whole sample as well.9 Table 4 exhibits polynomial and local randomization
estimates. For comparison, Table B6 reports the OLS and municipality fixed
effects results for the interval 73 to 1,000 Km distance to the Tordesillas line.
We use the number of black slaves over the total population in 1872 as an
outcome variable to verify whether there was indeed discontinuity at the cutoff,
proving our assumption that there were more black slaves in Portuguese Brazil
rather than Spanish Brazil. The second and third columns of Table 3 show
the Donut RD estimates of the average treatment effect of 1.75 to 3.3% of the
9
The maximum distance to the east of the line is 1,439.96 km. Referred as “All” in the
tables.
15total population. The second outcome variable is income inequality and all the
specifications show positive and significant treatment effects. Considering the
third column, the Donut RD estimates show that the Gini coefficient increases
on average by 0.104. We test the other three outcome variables. Based on the
estimated coefficients, the proportion of the average income of black households
in relation to white households (income racial imbalance) decreased by 9% in the
presence of treatment.
The average treatment effect on the education racial imbalance differs in dif-
ferent data settings, whereby the size of the “hollow” in the Donut RD influences
the result. Using GDP per capita as the outcome variable, we find positive and
statistically significant coefficients. The RD estimates are consistent with our
findings using OLS and fixed effects estimates (see Table 2).
The last two columns of Table 4 exhibit the local randomization results. The
idea behind this method is to approximate regression functions for control and
treatment units locally. Treatment is randomly assigned within the windows
selected, working as good as random. On the one hand, this method employs a
small window, while on the other hand it uses randomization inference methods
(Cattaneo, Frandsen, and Titiunik 2015).
We select the windows using the method based upon pre-determined covariates
presented and the bandwidth is -250 on the left-hand side of the Tordesillas line
and 187 on the right-hand side. The window that we consider in our estimation
is (-200, 200)10 . We suppress 73 km from the left and right of the Tordesillas line
in the fifth column to apply the same procedure of the Donut RD. The results
are consistent with the linear sharp RD estimates in Table 3, albeit with lower
magnitudes.
Overall, the results show that slavery increases income inequality, as well as
the current income imbalance between black and white households. Municipalities
where there were more slaves are still richer than more recent municipalities.
5.2 Donatary Captaincies
Figure 1b shows the Donatary Captaincies (DCs) map, highlighting the current
municipalities that existed in 1872. We replicated the map creating dummies for
each DC by using ArcGIS tools.
The DC Espirito Santo employed the largest number of slaves in the colony
10
The results are about the same when running the window with the same values of the
bandwidths selected.
16(30% of the total) in 1872.11 The majority of black slaves were located in the min-
ing region of the current Minas Gerais. Sao Tome and Santo Amaro—currently
part of Rio de Janeiro and Sao Paulo states—had 23% of the black slaves reported
by the census. At the end of the nineteenth century, this region had a flourishing
coffee plantation. While the sugar cane region of Bahia and Pernambuco had
11% of the slaves, Maranhao (1 and 2) accounted for 12% of the black slaves.12
To colonize Brazil, the Portuguese Crown used the Donatary Captaincies
(DCs) system as the political and administrative organization of the colony.13
The institution of DCs is tightly connected to the first imports of African slaves
to Brazil, providing us a way to see how this institution operated on the ground.14
The donataries enjoyed full authority under their territories and operated in rela-
tive independence from each other. Mattos, Innocentini, and Benelli (2012) argue
that DCs are associated with higher land inequality, lower public expenditures by
the local governments and lower political persistence. Brazilian historiography
has also linked this institution to land inequality in the country (Carvalho 2015).
Here we test whether idiosyncratic differences in the intensity of slavery in differ-
ent Captaincies had an impact in the long run. Our results for the DCs mimic
the ones for Tordesillas, whereby more slavery leads to higher levels of modern
inequality.
In Brazil, the Portuguese Crown established seventeen15 DCs between 1534-
1536, which initiated in the coast and reached the Tordesillas line. The division of
the DCs was mostly based upon natural borders such as rivers and river mouths
in areas from 35 to 100 leagues. The main goal was to go beyond the early
exploitation of brazilwood and move towards a more stable colonial productive
system. Through a “Carta Foral”, the The Portuguese Crown offered generous
privileges to affluent Portuguese families, often personally connected King Dom
Joao III. These entrepreneurs then had to raise funds to explore the new American
colony. Their mandate included settlement and the development of new economic
activities, most notably sugar. Indeed, the systematic production of sugar cane
11
According to Klein and Luna (2009), there was internal slave trade in Brazil. Therefore,
the 1872 census captures the picture at this point in time.
12
See detailed table in the Appendix.
13
The translation of “Capitanias Hereditarias” is Donatary Captaincy (DC), according John-
son (1972), and Proprietary Captaincy, according Klein and Luna (2009)
14
In 1570, the DCs started to import African slaves due to the scarcity of indigenous labor
and taking advantage of the high prices of sugar in the international markets (Klein and Luna
2009).
15
Two donataries received two DCs, namely Pero Lopes de Sousa and Martim Afonso de
Sousa.
17in Brazil only started after the establishment of the Donatary Captaincies in
1532. The first boat with African slaves arrived in the Captaincy of Bahia. Many
captaincies failed and eventually reverted back to the Crown. The donatary
system officially ended in 1821, one year prior to Brazil’s independence, whereby
the majority of DCs became states. Despite their imperfect enforcement, the DCs
provide some of the first territorial divisions of Brazil.
The Donatary Captancy system can be traced back to the Portuguese ses-
maria system. This type of feudal agricultural arrangement in the Iberian penin-
sula itself goes back to Roman times (Johnson 1972). Some of the first Donatary
Captancies based on this seignorial tradition were implemented in the Azores
Islands. The sesmaria system allowed the captain of the DC to grant someone
of his choosing with full authority over a given piece of land. A grantee was
supposed to improve the land within five years, otherwise he would lose his title.
The grantees also had the right to sell their property. In the case of Brazil, the
Portuguese Crown was more lenient regarding succession clauses, rents granted
to the donatary and monopoly power to the grantees than in other Portuguese
colonies.
We used the Regression Discontinuity approach for both the north and south
borders of the Donatary Captaincies with the highest relative population of slaves
in 1872 (Pernambuco, Sao Vicente, Bahia, Ilheus and Espirito Santo) to test our
main hypothesis. Since few of those are neighboring Captaincies, we will test for
discontinuity only the borders to the others Captaincies. They are the northern
borders of Pernambuco and Espirito Santo e the southern borders of Sao Vicente
and Ilheus Donatary Captaincies.
For each border, we calculated the distances of municipalities to the respective
border. We also used a Donut RD specification for similar reasons why we did
it in the Tordesillas specification. In this case, we used half degree, which is
equivalent of 36.5 Km. Results are presented in Figure 7 and Table B4. Where
there is a discontinuity in the relative number of slaves, there is also one in terms
of income inequality. The effect is more muted for land inequality and for the
educational racial gap, perhaps reflecting within state policy similarities.
5.3 Dutch Brazil and Colonizer Identity
The Dutch sent their first fleet to Brazil as early as 1599 (De Mello 2010). In
1604 and again in 1624 they attacked the city of Salvador, the capital of colonial
Brazil until 1763, under the auspices of the recently founded Dutch West India
18Company (WIC). Dutch merchants were interested in the commerce of Brazil
wood and sugarcane. They were also important players in the slave trade, moving
a total of more than half a million people from 1501 to 1866, mostly to the
Caribbean and the Guianas (Van Welie 2008). Dutch Brazil or New Holland,
was established officially in 1630 in the former captaincy of Pernambuco, one of
the most important areas for sugar production in the world. The Dutch West
India Company, set up its headquarters in the Brazilian city of Recife. The Dutch
expanded their area of influence to the states of Ceará and Maranhao, and the
Sao Francisco River. Dutch Brazil flourished during the governorship of Johan
Maurits van Nassau, who founded several sugar mills and other infrastructure
projects (Schwarcz 2015). To set this industry in motion, the Dutch brought
approximately 28,000 African slaves to Brazil. The number of slaves over the
total population in Dutch Brazil was as high as 20 to 30% percent. Portuguese
planters, who remained uneasy with Dutch rule, rebelled and finally captured
Salvador in 1654. In the Treaty of The Hague (1661) the Dutch recognized the
Portuguese imperial sovereignty over New Holland, officially putting an end to
Dutch Brazil. Despite their relatively short presence, the Dutch deeply shaped
ethos of northeast Brazil.16
One important confounder of the slavery effect could be colonizer identity. A
large literature in economics has explored this issue since the seminal papers of
La Porta et al. (1997, 1998).17 In the case of Brazil, Portuguese and Spanish
conquerors might have differed not only in the intensity of their slave regimes,
but also in other factors such as language and culture. To test the possible role of
colonizer identity, we use the Dutch colonization of Brazil as a historical experi-
ment. The Dutch presumably were more different culturally from the Portuguese
than the Spanish, yet they were important players in the commerce of slaves,
bringing a large quantity of them into Brazil.18
For our analysis, we digitized the map from Hettema Jr. (1920) book on
Dutch Brazil (see Figure A3). As can be seen in Figure 1c, municipalities that
were colonized by the Dutch all lie to the right of the Tordesillas line and are
then surrounded by those originally colonized by the Portuguese. The territory
is large, covering today 1,135 municipalities from nine states.
16
The Appendix presents a fuller description of the Dutch colonization of Brazil. Table B11
presents summary statistics for Dutch Brazil and its closer neighbors.
17
For a summary of this literature see La Porta, Lopez-de-Silanes, and Shleifer (2008) and
Easterly and Levine (2016) for a recent application.
18
As a matter of fact, the Portuguese and Spanish crowns were temporarily merged during
the Iberian Union from 1580 to 1640.
19For our Regression Discontinuity analysis, we compared the Dutch Brazil area
with the area up to 600 Km away from the Dutch Brazil’s border. The number
of black slaves over the total population in municipalities located in the area
occupied by the Dutch until 1649 is 22.6% lower than the municipalities located
600 Km away of the Dutch Brazil border. The number of slaves in 1872 (1,384)
is 32% lower and inequality today is 3.2% lower in the Dutch Brazil.
To test our hypothesis empirically we conduct a geographic Regression Discon-
tinuity. As can be seen in Table 5, first we do not find a significant discontinuity
between the former Dutch and the former Portuguese territories. Carrying for-
ward with the analysis, we do not find a corresponding jump in income inequality
or the income racial gap (Figure 8). We do not find a discontinuity in the GDP
per capita or in the education racial gap, our main channel of interest. Overall,
the results for Dutch Brazil are suggestive that what mattered for subsequent
distributions of income was slavery, more than colonizer identity per se. And
since the Dutch had very similar slavery regimes than the Portuguese, it is not
surprising to find similar levels of inequality in the long run.
6 Channels of Persistence
Our empirical results show a relationship between the institution of slavery in
the colonial period and the current income inequality in Brazil. In this section,
we explore the main channels through which the persistence in inequality might
be enacted. We focus on income and educational racial imbalance, as well as
institutional persistence (following Engerman and Sokoloff 1997; Engerman and
Sokoloff 2002; Small and Pager 2020).
6.1 Income Racial Imbalance
Our analysis shows that slavery not only causes income inequality between rich
and poor but also between white and black households. We present the RD esti-
mates in Tables 3 and 4 and Figure 6, showing that on average black households
have lower income than white households as a result of slavery. The RD para-
metric estimates a discontinuity of -9% on average. Furthermore, the local ran-
domization estimates a treatment effect of -3.11 to -3.75%. The IV methodology
shows that slavery reduces the ratio black household income over white household
income from 51.6% to 95.2%, thus increasing the income racial imbalance.
206.2 Education Racial Imbalance
The illiteracy rate of black households is on average 2.2 times higher than for
white households. In Spanish Brazil, this average is 1.97, while in Portuguese
Brazil it is 2.67. The lower this relationship is, the more equal the literacy rate
of black and white people would be. The estimates regarding this education
imbalance are not as conclusive as we find for the income racial imbalance. For
the linear RD estimates, when the “hollow” of the Donut RD is 73 km, the results
suggest that the education imbalance declines when the slavery in 1872 increases
(Table 4).
Table B12 presents the estimates for the ratio of black over white children
between 7-14 years old who are out of school. The treatment effect estimate is
3.511 for the full sample and 6.819 for the RD Donut estimates. Given that the
average ratio of the sample is 3.099, this data suggests that access to education
remains an issue for guaranteeing equal opportunities for black people in Brazil.
We present more formal decompositions in Figure 9.
6.3 Public Institutions
Public policies can contribute to the persistence of inequality by either not deliv-
ering public services or not managing them well. Table B12 and Figure A4 exhibit
that the treatment effect on institutional capacity19 is negative and statistically
significant for the entire sample. At the same time, we observe that municipalities
that experienced more slavery are associated with fewer human rights policies in
place, including those against racism.
7 Robustness
We described in Section 2 that there were different Tordesillas lines calculated
after the Portuguese and Spanish Crowns agreement. We tested a further east
meridian 45o 170 west calculated by the cartographer Oviedo. Table 6 shows the
RD estimates of two outcome variables (slavery and income inequality) using
the distance to Oviedo’s meridian as the assignment variable. We replicate the
methodologies used in Section 5.
Table 6 has two columns of linear RD estimates, followed by two polynomial
19
This variable is an index created by the Ministry of Planning from Brazil that balances
participation, financial and managerial capacity of the municipality.
21RDs of orders 2 and 4 and finally the randomization inference estimates. While
the coefficients confirm a positive and significant treatment effect of the number
of slaves over the total population, they have a smaller magnitude. While the
randomization inference estimate in Section 5 was 0.0161 with windows (-200,
200) and 0.0234 with windows (-500, 500), when we apply the new assignment
variable using the same randomization rule, statistic and window (-500, 500), the
treatment effect reduces to 0.0087. The result for the old specification would be
0.0349. The same phenomenon emerges with income inequality: while the treat-
ment effects in the section 5 were 0.0349 with windows (-200, 200) and 0.0362
with windows (-500, 500), the estimate of the new specification is 0.0240. Repli-
cating the empirical analysis for a different, more eastwards meridian confirm our
main results, in a more data driven approach (Figure A6).
8 Conclusions
This paper exploits discontinuities of the Tordesillas line pre-dating the discov-
ery of Brazil to show the impact of colonial slavery on modern-day inequality.
Previous research has shown a correlation between slavery and modern levels of
inequality. But to the best of our knowledge, a rigorous empirical test of the
Engerman and Sokoloff hypothesis was lacking. And so was a serious scrutiny of
the role of slavery for Brazilian underdevelopment.
Here we use an RDD, where the assignment variable is the municipalities’
distance to the Tordesillas line. We demonstrate that the number of black slaves
over the total population in 1872 was larger on the Portuguese side of the Torde-
sillas line compared with the Spanish side. Applying a Donut RD design, we
find that the treatment effect on income inequality is 0.103, which corresponds to
20.7% of the average income inequality measure of our sample. Using a local ran-
domization inference approach, the treatment effect is 0.0384, which represents
7.6% of the sample average.
The main channels of persistence that we find are the income racial imbalance,
education racial imbalance and public institutions. We show that on average black
households have a lower income than white households as a result of slavery.
Access to school seems to more strongly favor white rather than black children
around the cutoff. The treatment effect on institutional capacity is negative.
While the topic of inequality has gained increased attention in the academic
literature, these findings can expand our knowledge on its historical causes. It
22is key for academics to understand these determinants and for policymakers to
design appropriate policies that promote equality of opportunities.
References
Abadie, Alberto, and Guido W Imbens. 2015. Matching on the estimated propen-
sity score. Tech. rep. National Bureau of Economic Research.
Abreu, Capistrano de. 1953. Capıtulos de História Colonial (1500-1800).
Acemoglu, Daron, Camilo Garcıa-Jimeno, and James A Robinson. 2012. “Find-
ing Eldorado: Slavery and long-run development in Colombia”. Journal of
Comparative Economics 40 (4): 534–564.
Acemoglu, Daron, Simon Johnson, and James A Robinson. 2000. The colonial
origins of comparative development: An empirical investigation. Tech. rep.
National bureau of economic research.
Acharya, Avidit, Matthew Blackwell, and Maya Sen. 2013. Attitudes Shaped by
Violence. Tech. rep. Citeseer.
— . 2018. Deep roots. Princeton University Press.
— . 2016. “The political legacy of American slavery”. The Journal of Politics 78
(3): 621–641.
Aguirre, Álvaro, et al. 2013. Rebellions, Technical Change, and the Early Devel-
opment of Political Institutions in Latin America. Tech. rep. Central Bank of
Chile.
Anderson, Robert Nelson. 1996. “The quilombo of Palmares: a new overview of
a maroon state in seventeenth-century Brazil”. Journal of Latin American
Studies 28 (03): 545–566.
Andrews, George Reid. 2004. Afro-Latin America, 1800-2000. Oxford University
Press.
Angrist, Joshua D, and Jörn-Steffen Pischke. 2008. Mostly harmless econometrics:
An empiricist’s companion. Princeton university press.
Arretche, Marta. 2018. Paths of Inequality in Brazil: A Half-Century of Changes.
Springer.
Ashraf, Quamrul, and Stelios Michalopoulos. 2015. “Climatic fluctuations and
the diffusion of agriculture”. Review of Economics and Statistics 97 (3): 589–
609.
Astorga, Pablo, et al. 2015. Functional Inequality in Latin America: News from
the Twentieth Century. Tech. rep.
Barreca, Alan I, et al. 2011. “Saving Babies? Revisiting the effect of very low
birth weight classification”. The Quarterly Journal of Economics 126 (4):
2117–2123.
23You can also read