Retrieval of water vapor using ground-based observations from a prototype ATOMMS active centimeter- and millimeter-wavelength occultation ...
←
→
Page content transcription
If your browser does not render page correctly, please read the page content below
Atmos. Meas. Tech., 12, 1955–1977, 2019
https://doi.org/10.5194/amt-12-1955-2019
© Author(s) 2019. This work is distributed under
the Creative Commons Attribution 3.0 License.

Retrieval of water vapor using ground-based observations from
a prototype ATOMMS active centimeter- and millimeter-wavelength
occultation instrument
Dale M. Ward1 , E. Robert Kursinski2 , Angel C. Otarola1,3 , Michael Stovern4 , Josh McGhee2 , Abe Young5 ,
Jared Hainsworth6 , Jeff Hagen7 , William Sisk8 , and Heather Reed9
1 Department  of Atmospheric Sciences, University of Arizona, Tucson, AZ 85721, USA
2 PlanetIQ, Golden, CO 80401, USA
3 TMT International Observatory, LLC., Pasadena, CA 91124, USA
4 Environmental Protection Agency, Denver, CO 80202, USA
5 Department of Physics, University of Arizona, Tucson, AZ 85721, USA
6 Hill Air Force Base, A-10 Mechanical Systems, Ogden, UT 84056, USA
7 Lithe Technology, Tucson, AZ 85721, USA
8 Department of Astronomy, University of Arizona, Tucson, AZ 85721, USA
9 LASP, University of Colorado, Boulder, CO 80303, USA

Correspondence: Dale M. Ward (dward@email.arizona.edu)

Received: 19 May 2017 – Discussion started: 26 July 2017
Revised: 6 October 2018 – Accepted: 10 October 2018 – Published: 27 March 2019

Abstract. A fundamental goal of satellite weather and cli-       mosphere and around the globe, in both clear and cloudy con-
mate observations is profiling the atmosphere with in situ-      ditions, and will therefore greatly improve our understanding
like precision and resolution with absolute accuracy and un-     and analysis of water vapor. This information can be used to
biased, all-weather, global coverage. While GPS radio occul-     improve weather and climate models through constraints on
tation (RO) has perhaps come closest in terms of profiling the   and refinement of processes affecting and affected by water
gas state from orbit, it does not provide sufficient informa-    vapor.
tion to simultaneously profile water vapor and temperature.
We have been developing the Active Temperature, Ozone
and Moisture Microwave Spectrometer (ATOMMS) RO sys-
tem that probes the 22 and 183 GHz water vapor absorp-           1   Introduction (motivation)
tion lines to simultaneously profile temperature and water va-
por from the lower troposphere to the mesopause. Using an        Water vapor is an important constituent in the Earth’s atmo-
ATOMMS instrument prototype between two mountaintops,            sphere and its distribution in space and time must be known
we have demonstrated its ability to penetrate through water      to understand and predict weather and climate. Water vapor
vapor, clouds and rain up to optical depths of 17 (7 orders      is fundamental to the radiative balance of the Earth, both as
of magnitude reduction in signal power) and still isolate the    the most important greenhouse gas and indirectly through
vapor absorption line spectrum to retrieve water vapor with      clouds. Through its latent heat, water vapor is crucial to the
a random uncertainty of less than 1 %. This demonstration        formation and evolution of severe weather, transport of en-
represents a key step toward an orbiting ATOMMS system           ergy both upward and poleward in the troposphere and trans-
for weather, climate and constraining processes. ATOMMS          fer of energy between the surface and atmosphere. Further-
water vapor retrievals from orbit will not be biased by cli-     more, water vapor dominates tropospheric radiative cooling,
matological or first-guess constraints and will be capable of    which drives convection (Sherwood et al., 2010). Uncertainty
capturing nearly the full range of variability through the at-   in modeled cloud feedback results in the spread of a factor

Published by Copernicus Publications on behalf of the European Geosciences Union.
1956                                         D. M. Ward et al.: ATOMMS 183 GHz ground-based retrievals of water vapor

of 3 in predictions of the surface temperature response to a       servations about important atmospheric processes like those
doubling of atmospheric CO2 concentrations, and the cloud          associated with clouds, convection and surface exchange.
feedback depends critically on the strength of the water vapor        In this context, GPS radio occultation (RO) has provided
feedback (Held and Soden, 2000). Predicted amplification of        a welcome advance in satellite remote sensing through its
extreme precipitation with warmer temperatures is tied di-         ability to profile the atmosphere with ∼ 200 m vertical reso-
rectly to predicted increases in extreme water vapor concen-       lution, approaching that of sondes, in all-weather conditions,
trations and future extreme precipitation may be underesti-        with very small random and absolute uncertainties. As such,
mated (e.g., Allan and Soden, 2008).                               GPS RO has become an important data source for numer-
   Water vapor is challenging to measure because of the wide       ical weather prediction (NWP), despite its relatively sparse
range of concentrations and scales across which it varies. Wa-     coverage to date (e.g., Cardinali and Healy, 2014). Its high
ter vapor observations must be unbiased and capture the full       impact comes from its unique combination of ∼ 200 m ver-
range of variability in clear and cloudy conditions across the     tical resolution, all-weather sampling and very low random
globe in order to improve the understanding and analysis of        and absolute uncertainties via its direct connection to atomic
water vapor, This information is used to initialize weather        frequency standards and relatively simple and direct retrieval
prediction systems, to monitor trends and variations and to        methods. GPS RO profiles atmospheric refractivity. Two lim-
improve weather and climate models through constraints on          itations of GPS RO are (1) its inability to separate the dry-air
and refinement of processes affecting and affected by water        and water vapor contributions to refractivity and (2) its insen-
vapor (e.g., Bony et al., 2015).                                   sitivity to water vapor in the colder regions of the troposphere
   Satellite observations are required to gain a global per-       and above (e.g., Kursinski et al., 1997; Kursinski and Geb-
spective of weather prediction and climate monitoring and          hardt, 2014). The insensitivity occurs when there is so little
for constraining the critical processes at work in different re-   water vapor that the majority of the refractivity is dominated
gions across the globe. Unfortunately, present satellite obser-    by the dry-air component.
vations provide limited constraints on the water vapor field,         In recognition of the strengths and weaknesses of GPS RO
particularly when clouds are present, which in turn limits the     and radiance measurements as well as the need for better in-
capability of weather forecasts and our detailed knowledge         formation about water vapor, in 1997 research groups at the
of water vapor across the globe. For example, GOES obser-          University of Arizona and the NASA Jet Propulsion Labo-
vations provide high time and horizontal resolution but very       ratory (Herman et al., 1997; Hajj et al., 1997) identified and
limited vertical information. While hyperspectral IR on polar      began developing an RO system that is now called the Active
orbiting satellites provide more information, their temporal       Temperature, Ozone and Moisture Microwave Spectrometer
sampling is limited and their water vapor estimates are quite      (ATOMMS), which is designed to overcome these GPS lim-
noisy with fractional, root mean square (rms) differences          itations by transmitting and receiving signals between satel-
ranging from 25 % in the lower troposphere to 70 % around          lites in low Earth orbit (LEO) near the 22 and 183 GHz water
400 hPa and a tendency toward dry biases up to 30 %, de-           vapor absorption lines as well as nearby ozone absorption
pending on cloud type (Wong et al., 2015). While downward-         lines. Profiling both the speed of light like GPS RO as well
looking microwave radiance measurements are particularly           as the absorption of light, which GPS RO does not measure,
useful for determining the column water over the ocean (e.g.,      enables ATOMMS to profile temperature, pressure and water
Wang et al., 2016), they provide significantly less vertical in-   vapor simultaneously from near the surface to the mesopause
formation than IR and are inherently ambiguous over land,          with little random or systematic uncertainty (Kursinski et
snow and ice due to surface emissivity variations. The point       al., 2002). It will also profile ozone from the upper tropo-
is that present state-of-the-art, radiance-based satellite wa-     sphere into the mesosphere, scintillations produced by tur-
ter vapor remote-sensing systems have serious limitations in       bulence, slant path cloud liquid water and will detect larger
terms of performance and sampling biases associated with           cloud ice particles with approximately 100 m vertical resolu-
clouds and surface conditions, accuracy, vertical resolution       tion and corresponding 70 km horizontal resolution (Eq. 13,
and the ambiguity inherent in the conversion of radiances to       Kursinski et al., 1997). Kursinski et al. (2002) found that
the atmospheric state (Rodgers, 2000).                             such a system could provide water vapor retrievals with a
   Because of these satellite limitations, balloon-borne son-      random uncertainty of 1 %–3 % from near the surface to well
des and dropsondes continue to be the measurement of               into the mesosphere. Kursinski et al. (2009) estimated that
choice for field campaigns focused on answering key ques-          the degradation in clouds would be less than a factor of 2.
tions about the atmosphere. In fact, the globe would be cov-       A summary of LEO-to-LEO occultation measurement con-
ered with sondes if the cost to do so were not so completely       cept studies and demonstrations to date at microwave and IR
prohibitive. Operational global weather observing systems          wavelengths is given in Liu et al. (2017).
therefore rely primarily on more affordable but vertically            Regarding the sampling densities that can be achieved with
coarse satellite radiance measurements and the inherent am-        ATOMMS, Kursinski et al. (2016b) noted that a constel-
biguities in the information they provide. Unfortunately, this     lation of 60 very small satellites, carrying both ATOMMS
limits how much understanding we can gain from these ob-           and GNSS RO sensors, would produce approximately 26 000

Atmos. Meas. Tech., 12, 1955–1977, 2019                                              www.atmos-meas-tech.net/12/1955/2019/
D. M. Ward et al.: ATOMMS 183 GHz ground-based retrievals of water vapor                                                    1957

ATOMMS and 170 000 GNSS occultations profiles each day,          1.2   Weather fronts
for a fraction of the cost of a single, operational, polar-
orbiting weather satellite. These numbers of profiles are        Weather fronts are another fundamental class of severe
approximately 10 and 100 times present GPS RO and ra-            weather poorly constrained by satellite radiance measure-
diosonde sampling densities. Such an orbiting ATOMMS             ments. Unlike radiances, RO measurements can profile fronts
constellation providing dense, very high vertical resolution,    from orbit because RO profiles readily penetrate through
precision and accuracy water and temperature profiling via       clouds and the vertical and horizontal resolutions of RO are
radio occultation will complement existing observations of       well matched to the vertical and horizontal scales of weather
clouds, precipitation and energy fluxes and tie the entire       fronts. While GPS RO can profile fronts in the upper tropo-
weather and climate system together. This combination will       sphere (e.g., Kuo et al., 1998), the lack of refractivity con-
also dramatically improve the realism and utility of global      trast between the warm-wet and the cold-dry sides of fronts
analyses for climate as well as forecasting (increasingly ex-    deeper in the troposphere limits GPS RO profiling of fronts
treme) weather (Kursinski et al., 2016a).                        there (Hardy et al., 1994). ATOMMS high-precision temper-
   With regard to constraining processes, we briefly discuss     ature, pressure and water vapor profiles in clear and cloudy
three important and representative application areas: moist      conditions will readily distinguish between the warm and
convection, weather fronts and polar weather and climate.        cold sides of fronts down through the lower troposphere and
                                                                 precisely determine the location of any frontal surface that
1.1   Moist convection                                           crosses an ATOMMS profile (Kursinski et al., 2002).
                                                                    This unprecedented capability to measure fronts globally
Moist convection is ubiquitous across the globe but inad-        will also enable detailed characterization of the dynamics and
equately understood which leads to inaccurate representa-        moisture fluxes of atmospheric rivers out over remote ocean
tion in models. Environmental variables critical for under-      regions to better predict and prepare for the torrential rainfall
standing and predicting moist convection and associated se-      and flooding they produce following landfall. These obser-
vere weather include temperature, water vapor, stability, con-   vations will also guide refinements in model representations
ditional instability in particular, the level of free convec-    of atmospheric rivers to increase and extend the accuracy of
tion, convective available potential energy (CAPE), convec-      weather forecasts and the climatologically important midlat-
tive inhibition (CIN), winds and divergence. Unfortunately,      itude water vapor transport in reanalyses and climate models
coarse vertical resolution and ambiguities inherent in con-      (e.g., Guan and Waliser, 2016).
verting radiance spectra to the atmospheric state limit the
ability of satellite radiances to provide detailed constraints   1.3   Profiling in polar regions
on convection-related processes. GPS RO provides much-
needed vertical information across the globe and is partic-      Profiling in polar regions, particularly the near-surface envi-
ularly useful for determining temperatures and stability in      ronment, is critical to understanding the causes of ongoing
the upper troposphere where conditions are very dry. How-        and future climatic changes there. Reducing uncertainty due
ever, the ambiguity of the wet and dry gas contributions to      to our limited knowledge about the critical processes at work
refractivity under the warmer, moister conditions deeper in      there requires quantitative, process-resolving observations
the troposphere limit the utility of GPS RO refractivity pro-    that span the entire range of environmental conditions and
files there.                                                     behavior across these remote regions. Present understanding
   In contrast, ATOMMS will be the first orbiting remote-        comes largely from operational sondes and a small number of
sensing system to simultaneously profile temperature and         field campaigns (e.g., Esau and Sorokina, 2010). While satel-
water vapor with very high ∼ 100 m vertical resolution and       lites radiance measurements already provide dense sampling
very small uncertainties needed to tightly constrain these en-   of these remote, high-latitude regions, they have yielded rel-
vironmental quantities relevant to convection, in clear and      atively little insight due to intrinsic ambiguities associated
cloudy conditions, through the troposphere and across the        with poor vertical resolution, frequent clouds, near-surface
entire globe. While ATOMMS profiles will not resolve de-         inversions and variations in surface emissivity. As a result,
tailed horizontal structure at scales much below 70 km, they     many “global” satellite products do not extend to the poles
are sensitive to these scales via the phase and amplitude        (e.g., Chen et al., 2008). While GPS RO has much-needed
scintillations that small-scale turbulence produces on the       very high vertical resolution, cloud penetration and insensi-
ATOMMS signals (Kursinski et al., 2016b). Furthermore,           tivity to surface conditions, its impact is also limited, because
100 km, which is approximately the horizontal resolution of      of the unknown contributions of water vapor and the bulk dry
ATOMMS, is the scale most important for forecasting severe       gas to the measured refractivity profiles.
convection in the form of thunderstorms (Durran and Weyn,           In this context, precise and very high vertical resolution
2016).                                                           ATOMMS profiling of temperature, stability, water vapor,
                                                                 pressure gradients, clouds and turbulence, down to the sur-
                                                                 face, over all types of surfaces, in clear and cloudy condi-

www.atmos-meas-tech.net/12/1955/2019/                                              Atmos. Meas. Tech., 12, 1955–1977, 2019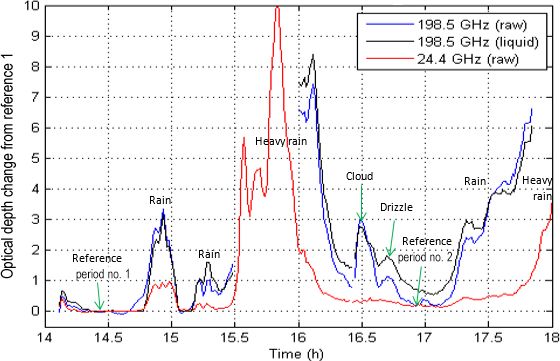
1958                                        D. M. Ward et al.: ATOMMS 183 GHz ground-based retrievals of water vapor

tions, across the diurnal and seasonal cycles, will bring un-     tions that ranged from clear to cloudy to thunderstorms with
precedented information about the high latitudes and, in par-     heavy rain. The ATOMMS mountaintop retrievals worked
ticular, the lowermost troposphere, to constrain and reduce       up to optical depths of 17. The discrepancies smaller than
presently large uncertainties in surface fluxes and the surface   1 % between the measured ATOMMS spectra and the for-
energy budget there.                                              ward modeled water vapor spectra (described in Sect. 4),
   ATOMMS will simultaneously probe through clouds to             in clear, cloudy and rainy conditions are unprecedented and
determine the gas state as well as the cloud properties them-     more than 1 order of magnitude smaller than the 25 % to
selves, including their phases (liquid, ice and mixed), which     70 % uncertainties in AIRS retrievals reported in Wong et
are critical in the surface energy budget (e.g., Klingebiel et    al. (2015). At still higher cloud and rain opacities, such as
al., 2015) and fundamental to calculating upward and down-        the conditions encountered during our ATOMMS mountain-
ward short- and long-wave radiative fluxes through the atmo-      top experiment, IR and microwave emission-based water va-
sphere. ATOMMS will profile the frequent polar boundary           por retrievals simply do not work. ATOMMS performance
layer clouds that are too close to the surface to be character-   in cloud and rain is achieved via a differential transmission
ized by CloudSat (Kay and Gettleman, 2009).                       approach using a calibration signal, in contrast to passive IR
   ATOMMS will constrain winds via horizontal pressure            and microwave sensors systems that work via emission. In
gradients to further constrain wind shear and moisture fluxes.    addition, the vertical resolution attainable via active occul-
This wind and cloud information, together with simultane-         tation observing systems is at least an order of magnitude
ous profiling by ATOMMS of stability and turbulent scintil-       better than that of passive sensors.
lations, will provide a new set of observational constraints         The structure of the paper is as follows. Section 2 sum-
over the entire high-latitude region to expose flaws and guide    marizes the ATOMMS concept for satellites operating at low
improvements to presently inaccurate and poorly constrained       Earth orbit (LEO) and Sect. 3 describes this mountaintop ex-
model parameterizations of sensible and latent heat fluxes.       periment. In Sect. 4, we discuss the water vapor retrievals
The ability to estimate turbulence and radiative cooling at       from the measured mountaintop data. Sources of uncertainty
cloud top are also critical to determining cloud lifetimes and    are covered in Sect. 5, while Sect. 6 examines validation
the radiative budget because turbulent entrainment rates in-      of the water vapor retrievals with available in situ measure-
fluence droplet size and therefore albedo (Esau and Sorokina,     ments. Finally, in Sect. 7, the encouraging results from the
2010). ATOMMS global perspective would provide critical           ATOMMS ground-based system lead us to a discussion of
information for understanding why the two poles are evolv-        the unique capabilities of a future ATOMMS satellite oc-
ing so differently.                                               cultation system for improving numerical weather forecasts,
   The preceding examples reveal inadequacies in our present      monitoring climate changes and improving our understand-
observing system that limit our understanding and in the          ing and model representation of processes related to water
substantial increase that ATOMMS promises in our obser-           vapor.
vationally based knowledge and understanding. The perfor-
mance of ATOMMS profiles approaches that of sondes and,
when implemented as a constellation such as in Kursinski          2   ATOMMS concept
et al. (2016b), would provide far denser coverage across
                                                                  ATOMMS is a natural extension of the GPS RO concept.
the globe. For example, the vast Amazon rainforest which
                                                                  It extends the capabilities and overcomes several limitations
is presently profiled twice a day by only 8 sondes (It-
                                                                  of GPS RO by simultaneously measuring atmospheric bend-
terly et al., 2016), would be sampled by approximately 300
                                                                  ing and absorption at several essentially monochromatic sig-
ATOMMS profiles and 1800 GNSS RO profiles each day via
                                                                  nal frequencies in two frequency bands centered on the 22
the ATOMMS satellite constellation noted above. Thus, an
                                                                  and 183 GHz water absorption lines, referred to as low-band
ATOMMS constellation would create a continuous, dense,
                                                                  and high-band, respectively. The high-band includes sev-
global data set, with performance approaching that of sondes,
                                                                  eral ozone absorption lines used to profile ozone. During
which researchers could divide up as they like into smaller
                                                                  ATOMMS satellite-to-satellite occultations, signals transmit-
domains (creating essentially their own regional (field) cam-
                                                                  ted from one satellite are received by the other, which yields
paigns) to better understand and model key processes and
                                                                  measurements of the signal phase and amplitude during the
reduce weather and climate prediction uncertainty across the
                                                                  occultation. From these, occultation profiles of bending angle
globe.
                                                                  and absorption are derived and then used to derive radial pro-
   Our work here is focused on a mountaintop demonstration
                                                                  files of refractivity and the extinction coefficient using Abel
of the ability of ATOMMS to measure water vapor through
                                                                  transforms (Kursinski et al., 2002). These are then combined
rain and clouds. Using ground-based ATOMMS prototype
                                                                  with knowledge of spectroscopy, together with the equations
instrumentation, we demonstrate the ability of ATOMMS
                                                                  of refractivity and hydrostatic equilibrium, to derive profiles
to retrieve changes in the path-averaged water vapor be-
                                                                  of air temperature, pressure, water vapor, ozone and some
tween the instruments operating between two mountaintops
                                                                  properties of condensed water.
in Southern Arizona to within 1 %, during weather condi-

Atmos. Meas. Tech., 12, 1955–1977, 2019                                             www.atmos-meas-tech.net/12/1955/2019/
D. M. Ward et al.: ATOMMS 183 GHz ground-based retrievals of water vapor                                                                    1959

   ATOMMS functions as a precise, active spectrometer                 merator represents the ratio of the amplitude of the tuned sig-
over the propagation path between the transmitter and re-             nal to the amplitude of the calibration signal at measurement
ceiver. Retrievals of water vapor from radiance measure-              time, t, during the occultation. Taking the natural logarithm
ments are inherently ambiguous because both the unknown               of R and multiplying by two yields the change in the differ-
signal source emission and attenuation along the path are un-         ence between the optical depths at frequencies f and fCAL ,
known and must be solved for, creating an ill-posed prob-             from the reference time, t0 , to time, t.
lem (e.g., Rodgers, 2000). In comparison to radiance re-
trievals, ATOMMS has the advantage that the transmitted               2 log (R) = τ (f, t) − τ (fCAL , t) − τ (f, t0 ) − τ (fCAL , t0 )      (3)
signal strength is well known and the observed quantity is
simply the attenuation along the path, which makes the re-            If the signal path is entirely above the atmosphere at refer-
trievals much more direct and less ambiguous. The active ap-          ence time, t0 , as will be the case in a LEO–LEO occulta-
proach also enables retrievals with small random and system-          tion geometry, then the optical depths at time t0 are zero and
atic uncertainty under conditions of large path optical depths,       Eq. (3) simplifies to
which is not possible for passive retrievals.
                                                                      2 log (R) = τ (f, t) − τ (fCAL , t) .                                  (4)
   Because ATOMMS uses phase coherent signals to mea-
sure Doppler shift and bending angle like GPS RO, we write
                                                                      The frequency separation between f and fCAL is chosen
the signal attenuation in terms of amplitude rather than inten-
                                                                      such that R retains most of the absorption signature while
sity as follows:
                                                                      canceling unwanted common sources of error such as gain
                                                                      variations due to pointing errors, scintillations due to at-
A(f ) = A0 (f )e−τ/2 ,                                         (1)
                                                                      mospheric turbulence and attenuation due to scattering by
where A is the measured signal amplitude after the absorp-            hydrometeors. This ratio of ratios approach enables precise
tion, A0 is the amplitude of the signal that would be mea-            measurements of water vapor in the presence of clouds and
sured in the absence of atmospheric attenuation and τ is the          rain with very small random and systematic uncertainty as
optical depth at the signal frequency, f . The factor of 0.5          we demonstrate below.
multiplying the optical depth comes about because intensity
is proportional to amplitude squared. The total optical depth
                                                                      3   Overview of the ATOMMS mountaintop experiment
is due to the gas-phase optical depth plus the attenuation due
to hydrometeors. The gas-phase optical depth includes water           We designed and built a ground-based, prototype ATOMMS
vapor and dry-air absorption, which depend on temperature             instrument and then used it to demonstrate some key aspects
and pressure. The hydrometeor attenuation also depends on             of ATOMMS capabilities and performance in several fixed
temperature (Kursinski et al., 2009).                                 geometries in southern Arizona with path lengths ranging
                                                                      from 800 m to 84 km. The prototype ATOMMS high-band
Differential absorption
                                                                      system transmits and receives two simultaneous continuous-
A key to ATOMMS performance is its double differential                wave (CW) signals tunable from 181 to 206 GHz. The proto-
absorption approach (Kursinski et al., 2002). First, the am-          type low-band system consists of eight CW transmitters and
plitude observable is the change in signal amplitude over             receivers at fixed frequencies from 18.5 to 25.5 GHz spaced
an occultation relative to the amplitude measured at time,            approximately 1 GHz apart, centered approximately on the
t0 , when the signal path between the two spacecraft is en-           22 GHz water vapor absorption line. Below we summarize
tirely above the atmosphere. Second, the amplitudes of two            the content of previous published work based on field exper-
(or more) signals are measured simultaneously during each             iments with the ATOMMS ground-based prototype.
occultation. The frequency, f , of one signal is placed on the           In terms of ATOMMS water vapor retrievals, Kursinski
absorption line of interest, while the frequency of the second        et al. (2012) demonstrated agreement at the 2 % level be-
signal, fCAL , is farther from the line center, so that signal can    tween water vapor measurements derived along an 820 m
function as an amplitude calibration signal.                          path using the ATOMMS high-band instrument and a nearby,
    The quantity used in the ATOMMS retrievals is the ratio           capacitive-type hygrometer. High-band mountaintop mea-
of two amplitude ratios,                                              surements yielded the first detection by ATOMMS of H18    2 O
                                                                      via its 203 GHz absorption line (Kursinski et al., 2016b).
                                                                      Such measurements in the upper troposphere will determine

                        A (f, t)         A (f, t0 )
R (f, fCAL , t, t0 ) =                               .          (2)   isotopic ratios to constrain the hydrological cycle (Kursinski
                       A (fCAL , t) A (fCAL , t0 )
                                                                      et al., 2004).
The amplitude ratio in the denominator represents the ratio of           Accurate knowledge of spectroscopy is key to interpret-
the amplitude of the tuned signal to the amplitude of the cal-        ing the ATOMMS measurements. ATOMMS itself is per-
ibration signal at reference time, t0 , when the signal is nom-       haps the best 183 GHz spectrometer ever implemented. Its
inally above the atmosphere. The amplitude ratio in the nu-           measurements of the line shape near the 183 GHz line center

www.atmos-meas-tech.net/12/1955/2019/                                                     Atmos. Meas. Tech., 12, 1955–1977, 2019
1960 D. M. Ward et al.: ATOMMS 183 GHz ground-based retrievals of water vapor
match that of the HITRAN model to within 0.3 % (Kursin- In the satellite-to-satellite occultation geometry, the major-
ski et al., 2012), which agrees 8 times better than the best ity of the signal attenuation occurs along the lowest altitude
prior estimates of Payne et al. (2008). These same measure- portion of the signal path centered at the ray tangent point,
ments revealed that the line shape of the popular Liebe et which is 100 to 500 km in length. The attenuation contributed
al. (1993) model is incorrect (Kursinski et al., 2012). Far- at higher altitudes along the ray path is comparatively much
ther from the line center, 5 to 25 GHz above the line center, smaller than the contribution near the ray path tangent alti-
ATOMMS measurements revealed significant discrepancies tude due to both the limb-sounding geometry and the expo-
with the HITRAN line shape (Kursinski et al., 2016b). These nential decay in water vapor concentrations with altitude. We
discrepancies may help explain inconsistencies between 183 note that the Abel transform isolates the contribution from
GHz derived water vapor estimates discussed in Brogniez et the lowest altitude portion of the signal path. For a vertical
al. (2016) that may be associated with atmospheric turbu- resolution of 100 m, the horizontal length of the path through
lence (Calbet et al., 2018). the lowest layer is approximately 70 km (Eq. 13, Kursinski
In terms of sensing hydrometeors, Kursinski et al. (2012) et al., 2002). Because the large water vapor concentrations
derived cloud liquid water content (LWC) by combining in the lower and middle troposphere produce impenetrably
ATOMMS high-band measurements with precipitation radar high opacities near the 183 GHz line when integrated over
measurements along the ATOMMS signal path. Kursinski et such long signal paths, this portion of the troposphere must
al. (2016b) further demonstrated the ability to derive both be profiled using the weak 22 GHz absorption line and the
cloud LWC and rainfall rates by combining the ATOMMS ATOMMS low-band system from space. This is also the alti-
low-band and high-band measurements. ATOMMS also acts tude region where liquid water clouds are most common. To
as a scintillometer to sense atmospheric turbulence. Kursin- achieve our goal of an all-weather observing system, the ob-
ski et al. (2016b) derived the strength of atmospheric turbu- servations must provide enough information for the inversion
lence from scintillations of the ATOMMS signal amplitudes routine to be able to separate the signal attenuation due to liq-
and further demonstrated how these turbulent amplitude vari- uid water absorption from that due to water vapor absorption.
ations can be reduced via amplitude ratioing, as needed to de- Kursinski et al. (2009) showed that the spectral shape of the
rive accurate water vapor estimates in turbulent conditions. cloud liquid water absorption at the low-band frequencies de-
On 18 August 2011, we collected approximately 4 h of pends primarily on the cloud liquid water path and cloud tem-
data with the instruments located on Mt. Lemmon Ridge perature. Simultaneously measuring the amplitudes of four
(2752 m altitude) and Mt. Bigelow (2515 m altitude), sep- low-band signals, with at least one of the signal frequencies
arated by approximately 5.4 km. The observing geometry on the high side of the 22 GHz line, in addition to refractiv-
is shown in Fig. 1. The Mt. Lemmon instrument con- ity plus application of a hydrostatic constraint, enables water
tained the 183 GHz transmitter and 22 GHz receiver and vapor, cloud liquid water path and effective cloud tempera-
the Mt. Bigelow instrument contained the 22 GHz transmit- ture to be estimated simultaneously. Thus, with absorption
ter and 183 GHz receiver. The water vapor pressure derived information from at least four low-band frequencies, we can
from these ATOMMS measurements represents an average isolate liquid water clouds from water vapor and unwanted
over the 5.4 km path, which runs above a valley between the variations due to instrumental noise and turbulence. Simula-
mountaintops on which the instruments sit. tions in Kursinski et al. (2009) showed that the uncertainty in
cloudy conditions should increase by no more than a factor of
3.1 Differences between mountaintop and LEO 2 relative to clear-sky conditions. We also note that Kursinski
measurements et al. (2009) recommended using at least five signal frequen-
cies in order to expose spectral modeling errors and provide
The mountaintop-to-mountaintop geometry differs from the the quantitative information needed to refine the modeling of
satellite-to-satellite geometry in several important aspects. In both the water vapor and liquid water spectra.
the satellite-to-satellite occultation geometry, the ATOMMS In this mountaintop demonstration, the atmospheric path
differential absorption measurements yield absolute water from transmitter to receiver took place over a narrow altitude
vapor concentrations because the reference signal strength is range from 2752 to 2515 m above sea level and was only
measured above the atmosphere where there is no absorption. 5.4 km in length. Over this short path, the water vapor atten-
Since we cannot evacuate the path between the two moun- uation due to absorption by the weak 22 GHz line was too
taintops, mountaintop-to-mountaintop observations are lim- small to measure accurately. Therefore, in this experiment,
ited to measuring changes in water vapor relative to a se- we used the ATOMMS high-band signals to probe near the
lected reference period as defined in Eq. (3). In the satellite stronger 183 GHz water line to retrieve changes in water va-
geometry, a profile of water vapor is retrieved as a function por along the path. Below we show that the liquid attenuation
of altitude via an Abel transform (Kursinski et al., 2002). In has a relatively flat spectral response across the high-band
the mountaintop experiment, the signal path is fixed and the frequencies utilized for the mountaintop retrieval of water va-
retrieved quantity is the change in the average water vapor por and essentially ratios out. In the satellite case, at altitudes
along the fixed path as a function of time. where liquid clouds commonly occur, the combined attenua-
Atmos. Meas. Tech., 12, 1955–1977, 2019 www.atmos-meas-tech.net/12/1955/2019/D. M. Ward et al.: ATOMMS 183 GHz ground-based retrievals of water vapor 1961
Figure 1. Geometry for the ATOMMS ground-based prototype instrument tests. The high-band transmitter was located on Radio Ridge near
Mt. Lemmon at an altitude of 2752 m, and the high-band receiver was located 5.4 km away at the Steward Observatory Catalina Station near
Mt. Bigelow at an altitude of 2515 m. The signal propagation path lies along a northwest-to-southeast line.
tion from liquid water and water vapor will make the atmo- rived changes in liquid optical depth at 198.5 GHz (black
sphere too opaque to probe with the high-band frequencies line), which was computed by subtracting the optical depth
and ATOMMS will therefore profile these conditions with changes due to variations in the retrieved vapor pressure and
the low-band signals near the 22 GHz line as noted above. temperature from the total observed optical depth change.
Another difference is that in the LEO–LEO geometry, pro- The change in optical depth relative to reference period 1 will
files of atmospheric refractivity and temperature are derived always be positive for liquid (rain and clouds), because there
from a Doppler shift proportional to atmospheric bending was no rain or clouds during the reference period. However,
(e.g., Kursinski et al., 1997). In a fixed geometry, there is no the change in optical depth due to changes in vapor pressure
equivalent Doppler shift and we therefore had to determine and temperature can be negative, which means that the over-
the air temperature via another method which is described in all change in optical depth relative to the reference period can
Sect. 4. be less than the optical depth change due to liquid alone.
A final point relates to instrument stability. The duration The instruments were housed in tents to protect them from
of a typical LEO–LEO occultation is approximately 100 s, weather conditions that spanned from clear to cloudy to thun-
which allows little time for instrument drift, while mountain- derstorms with heavy rain, as indicated by the annotations in
top measurements can continue for hours or days. Therefore, Fig. 2. This wide range of conditions and associated optical
to maintain instrument stability over the 4 h mountaintop ob- depths provided an excellent field test to evaluate and demon-
servation period, we used water chillers to minimize tem- strate several key ATOMMS capabilities. In situ measure-
perature variations in critical portions of the transmitters and ments of temperature, pressure and water vapor were made
receivers. at each tent. Web cameras in each tent pointed at the oppo-
In spite of the differences noted above, this ground-based site ATOMMS instrument site, providing periodic images of
experiment clearly demonstrates the ability of an ATOMMS- weather conditions and visible opacity.
type system to probe through and accurately retrieve changes Figure 2 indicates that when the ATOMMS observations
in water vapor under conditions of large total optical depths began, a light rain was falling. The rain ended prior to the
with liquid water present along the path. first reference period. A brief rain shower was observed from
about 14:43 to 15:02. The sharp peak in the 198.5 GHz liquid
3.2 Observed optical depths optical depth just before 15:00 and absence of a peak in the
24.4 GHz liquid optical depth likely indicates an increase in
The measured changes in optical depth at 198.5 GHz (blue the number of smaller raindrops. This was followed by a brief
line, raw) and 24.4 GHz (red line, raw) are shown in Fig. 2. clear period before the next rain shower began at 15:10. This
198.5 GHz was the frequency of the high-band calibra- rain was initially light, but became a heavy thunderstorm at
tion signal during this experiment. Also shown are the de-
www.atmos-meas-tech.net/12/1955/2019/ Atmos. Meas. Tech., 12, 1955–1977, 20191962 D. M. Ward et al.: ATOMMS 183 GHz ground-based retrievals of water vapor
erodyne receiver with a second local oscillator that was si-
multaneously swept through its matching tuning sequence.
The frequency of the other signal was fixed at 198.5 GHz
in order to function as the amplitude calibration signal for
measuring differential absorption. There were 122 tuning fre-
quencies in the sweep, separated by 0.25 GHz, except for a
gap between 191.5 and 193.5 GHz. This gap is due to the lim-
ited receiver response for intermediate frequencies (IF) less
than 1 GHz and the first-stage local oscillator (LO) being set
to 192.5 GHz.
When executing the tuning sequence, the tuned transmit-
ter tone dwelled at a particular frequency in the tuning se-
quence for 100 ms before moving to the next frequency in the
sequence. The timing of the transmitter-receiver tuning was
Figure 2. Blue and red lines show observed changes in optical depth synchronized using GPS receivers. Each received ATOMMS
at 198.5 and 24.4 GHz relative to reference period 1. The black line signal was filtered, down converted in frequency, digitized
shows changes in optical depth at 198.5 GHz due to changes in liq- and recorded. The signal frequency in the final receiver stage
uid water after removing the contribution from changes in vapor ranged from 8 to 35 kHz for each of the 122 tuned frequen-
pressure and temperature. cies. The frequency and power of the down-converted signals
were determined using a fast Fourier transform (FFT), calcu-
lated over a 50 ms integration time. The reason that only half
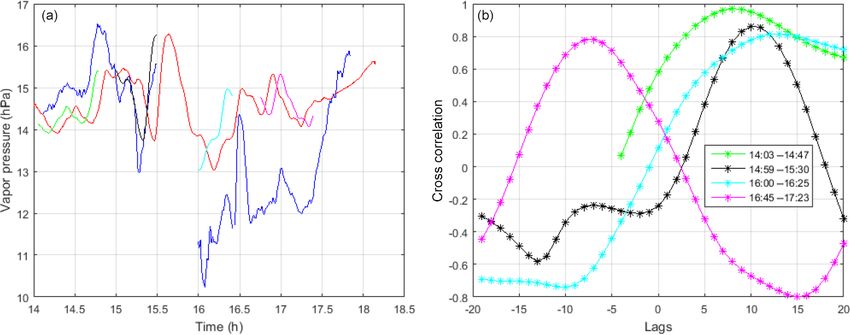
15:30. From 15:30 to 16:00, the 198.5 GHz tone was too at- of the 100 ms tuning dwell time was used was to allow time
tenuated to be observed at the receiver. During the heavy rain, for each synthesizer tune to settle. Each FFT-derived signal
the 24.4 GHz liquid optical depth reached a peak value of 10. power estimate was then converted to an amplitude by tak-
The 198.5 GHz signal was detected again at 16:00 as the rain ing the square root. The calibration signal amplitudes were
lightened. By 16:30, the rain was considerably lighter. The computed using the same method.
radar data from the Tucson WSR-88D radar (Crum and Al- One sweep through the frequency tuning sequence took
berty, 1993) and field observations indicated that rain was 12.2 s. The instrument cycled through the four combinations
still falling over portions of the path between the two instru- of the two transmitters and two receivers before repeating
ments. Note that the liquid optical depths did not return to the tuning cycle in order to help isolate any transmitter or
zero before the next heavier rain shower began, around 17:15. receiver issues. Thus, a full tuning cycle was completed ev-
Between 16:28 and 16:31, a cloud advected through the ery 48.8 s. The observations from the four combinations of
observation path. Field notes and images taken every 30 s transmitter-receiver pairs were then averaged together such
show a cloud moving into and through the field of view. Ini- that new estimates for the ATOMMS signal amplitude ra-
tially the cloud extended only part way across the observation tios at all of the 122 tuning frequencies were generated every
path. It then apparently spanned the entire path for a brief 48.8 s (Eq. 2). As a result, the integration time used to esti-
period of less than 2 min before gradually clearing out of mate the signal amplitude and frequency for each of the 122
the observation path. The presence of smaller cloud droplets frequencies in the tuning sequence was 4 times 50 or 200 ms.
caused the 198.5 GHz liquid optical depth to increase around
16:30, while little if any change was apparent in the 24.4 GHz
liquid optical depth. The fact that the 24.4 GHz optical depth
did not drop to 0 indicates some light rain was present as 4 Interpretation of measurements
well. The decrease in 198.5 GHz liquid optical depth after
the peak at 16:30 likely indicates that cloud droplets or driz- ATOMMS observations of R, defined in Eq. (2), are sensi-
zle obscured only part of the observation path. tive to changes in the integrated water vapor along the path
between the instruments. The retrieval algorithm discussed
3.3 Signal tuning and detection below determines changes in water vapor pressure relative to
a reference period. We selected two reference periods that
The high-band portion of the ATOMMS ground-based pro- are identified in Fig. 2. The first period spanned 14:23 to
totype instrument simultaneously transmits and receives 14:31, shortly after data acquisition began, and the second
two continuous-wave signals that are tunable from 181 to spanned 16:51 to 16:56, approximately 2.5 h later. These are
206 GHz. For this mountaintop experiment, the frequency of periods of relatively constant amplitude spectra due to rela-
the signal generated by one transmitter was swept through tively constant vapor pressure and temperature and relatively
a tuning sequence that spanned the instrument’s tunable fre- low optical depth, which maximizes the number of usable
quency range. This signal was received by a narrowband het- frequencies nearest the line center. Comparing solutions de-
Atmos. Meas. Tech., 12, 1955–1977, 2019 www.atmos-meas-tech.net/12/1955/2019/D. M. Ward et al.: ATOMMS 183 GHz ground-based retrievals of water vapor 1963 rived using the two different reference periods provides some vapor pressure varied from 10.2 to 16.5 hPa over the nearly assessment of instrumental drift. 4 h observation period. The measured vapor pressure peaked The retrieval algorithm determines the change in vapor in association with the rainy period before 15:00. Following pressure relative to the reference period by finding the best that rain shower, there was a brief intrusion of drier air cen- forward-calculated fit to each observed ATOMMS amplitude tered near 15:15 before the vapor pressure rapidly increased ratio spectrum (Eq. 2) using a least squares method. To for- prior to the thunderstorm at 15:30. Immediately following ward model the clear-sky atmospheric attenuation, we used the heavy rain after reacquisition of the high-band signals, an atmospheric propagation tool known as the atmospheric the vapor pressure dropped to its lowest value. In Sect. 6, we model (am), version 7.2 (Paine, 2011), which we will re- note that similar advection of dry air following summertime fer to as am7.2. This model was shown to fit the ATOMMS thunderstorms in this region have been observed in previ- measurements to the 0.3 % level in previous work with the ously published work (Kursinski et al., 2008) and show that ground-based ATOMMS prototype system (Kursinski et al., our estimation of the minimum vapor pressure was consis- 2012). In operation, the ATOMMS ratio, R in Eq. (2), is de- tent with the nearby radiosonde observations from Tucson. termined from measurements at times, t and t0 , for a range of During the brief cloud passage at 16:30, there was a sharp frequencies, f , which produces a frequency spectrum of the increase and peak in the vapor pressure that brought the rela- ratio. In forward calculations of Eq. (2), we assume that the tive humidity up to approximately 100 %. The vapor pressure vapor pressure, air temperature and air pressure are known fell sharply following the passage of the cloud. There was at the reference time, t0 , and the air pressure and tempera- one more peak in vapor pressure at 17:00 before the sharp ture are known at time, t. The solution is determined by find- rise associated with the rain that began at 17:30. ing the change in vapor pressure from the reference value that provides the best least squares fit between the forward- 4.1 Determining temperature calculated and observed ATOMMS ratio spectra. During this experiment, we were able to accurately determine signal am- Retrieving changes in water vapor vs. time from the mea- plitudes up to total optical depths due to gas plus liquid water sured absorption spectra requires knowledge of atmospheric of 17. temperature and pressure. In the eventual LEO–LEO occul- For the purposes of determining the average water va- tation measurements, ATOMMS will profile both the atmo- por along the path, we used 15 tuning frequencies spanning spheric Doppler shift and attenuation of the occulted signals, 187.861 to 191.361 GHz for the water vapor retrievals. Since from which profiles of temperature, pressure and water va- the greatest sensitivity to changes in vapor pressure occurs por will be derived (Kursinski et al., 2002). In the static at the line center, it is desirable to utilize frequencies as mountaintop-to-mountaintop geometry, there is no Doppler close to the line center as possible. For this field test, tun- shift and only the attenuation portion of the ATOMMS ing tones with frequencies lower than 187.861 GHz were too measurements is available. Pressure was determined using attenuated to be measured accurately even during clear skies. barometers on each mountaintop. Determining the atmo- During periods of lighter rain and clouds, the additional at- spheric temperature along the signal path was more challeng- tenuation by liquid water caused the retrieval frequencies ing. nearest the line center to become too opaque to be mea- During this experiment, three nearby thermometers mea- sured accurately, reducing the number of frequencies avail- sured the surface air temperature. An Arduino weather sta- able for the fit. The liquid optical depth in Fig. 2 is the liq- tion was located next to each ATOMMS instrument and an uid optical depth measured by the calibration signal, fCAL = automated weather station was located in the town of Sum- 198.5 GHz. The liquid optical depth was computed by sub- merhaven, about 300 m below Mt. Lemmon and 700 m to the tracting the forward-calculated change in gaseous extinction north. Unfortunately, these surface temperature observations relative to the reference period from the observed change in were not entirely representative of the air temperature aloft optical depth relative to the reference period, which includes along the ATOMMS signal path because of their close prox- changes in both liquid and gaseous extinction. During the imity to the surface and a high bias in the Arduino tempera- heaviest rain period, none of the high-band signals could be tures due to heat generated by the ATOMMS instrumentation measured due to strong liquid attenuation. inside the protective tents. The retrieved path-averaged vapor pressure between the To better estimate the temperature along the signal path, instruments is shown in Fig. 3a. The figure shows 12 differ- we derived the average air temperature along the path from ent solutions that were used to estimate the random uncer- the pressure scale height using the hypsometric equation tainty in the retrieval of vapor pressure. The methodology and time-varying barometric pressure measured at the two used to compute the 12 solutions is described in Sect. 5. The ATOMMS instruments: half range of the 12 solutions shown in Fig. 3b is generally less than 0.1 hPa. Most of the fractional uncertainties are well below 1 % of the vapor pressure, indicating that the solution is highly constrained by the observations. The path-averaged www.atmos-meas-tech.net/12/1955/2019/ Atmos. Meas. Tech., 12, 1955–1977, 2019
1964                                              D. M. Ward et al.: ATOMMS 183 GHz ground-based retrievals of water vapor

Figure 3. (a) Retrieved vapor pressure for the 12 retrieval test cases described in the text. Each line is a different color. (b) Blue line and left
axis indicate the half range, which is half of the maximum minus minimum vapor pressure from the 12 retrieval cases; green line and right y
axis is the half range divided by the absolute vapor pressure at each retrieval point expressed in percent. The strong peaks near 14.6 h are due
to momentary noise in the calibration signal.

                  −1
       g1Z     PBig
TV =        ln           ,                                         (5)
        Rd     PLem

where g is gravitational acceleration, 1Z is the altitude dif-
ference between Mt. Lemmon and Mt. Bigelow, Rd is the
gas constant for dry air, PBig and PLem are the measured air
pressures on Mt. Bigelow and Mt. Lemmon respectively, and
TV is the layer mean virtual temperature. The air tempera-
ture is obtained from the virtual temperature, e.g., Wallace
and Hobbs (1977).
   While Eq. (5) ideally provides the desired layer mean tem-
perature needed for spectral calculations of R, there are is-
sues with this approach. The sensitivity of Eq. (5) to small
dynamic pressure variations made short-term temperature es-
timates noisy. The horizontal separation between Mt. Lem-
mon and Mt. Bigelow caused the estimated temperature to be
sensitive to propagating pressure perturbations. Finally, the               Figure 4. Observed and derived air temperatures during the
assumption of hydrostatic balance in Eq. (5) is not true dur-               ATOMMS ground-based experiment.
ing thunderstorm activity. To alleviate these issues, we used
a 1 h running mean of the air pressure.
   Temperatures derived in this manner are biased by small
biases in barometric pressure. To minimize this bias, we                    modeled spectra is immediately evident, in that most of
shifted the entire temperature time series by 2.15 K so that                the individual ATOMMS amplitude ratio spectra fall within
the relative humidity was 100 % at 16:30, when the cloud                    ±0.15 hPa (which is ±1 %) of the calculated spectra. This is
was present. Figure 4 shows the derived air temperature be-                 true for most of the individual retrievals.
tween the instruments that was used in the retrievals in black,                Figure 5a shows a retrieval made during the clear period
as well as the nearby in situ thermometer observations, which               around 15:08, following the first rain period. All 15 frequen-
are shown in red, green and blue. The uncertainty associated                cies spanning 187.861 to 191.361 GHz were available and
with this temperature estimation is discussed in Sect. 5.                   closely fit the forward-calculated ATOMMS ratio. Figure 5b
                                                                            shows a retrieval made during the first rain period at 14:51.
4.2    Water vapor spectra                                                  While the two frequencies nearest the line center were lost
                                                                            due to the increase in optical depth caused by rain, the re-
Figure 5 shows four examples of fitted ATOMMS ratio spec-                   maining 13 ATOMMS frequencies yielded accurate vapor
tra. The outstanding agreement between the measured and                     pressure retrievals during the rain.

Atmos. Meas. Tech., 12, 1955–1977, 2019                                                          www.atmos-meas-tech.net/12/1955/2019/
D. M. Ward et al.: ATOMMS 183 GHz ground-based retrievals of water vapor 1965
Figure 5. Examples of fitting the observed ATOMMS amplitude ratio, Eq. (2) (black asterisks), to the forward calculated ATOMMS ratio
using am7.2. Blue line is the best-fit line for the indicated vapor pressure. Red line is am forward calculation for a vapor pressure 0.15 hPa
greater than the best-fit vapor pressure. Green line is forward calculation for a vapor pressure 0.15 hPa less than the best-fit vapor pressure.
The solutions shown in panels (a), (b) and (c) used reference period 1, while the solution in (d) used reference period 2.
Figure 5c and d show retrievals made at 16:29, during the the Reference 2 solutions by only 0.03 hPa (0.2 %), indicat-
cloudy period. The solution in Fig. 5c uses the first refer- ing the level of robustness of these vapor pressure retrievals.
ence period, while the solution in Fig. 5d uses the second
reference period, which is closer to the time of the cloudy
period. The difference between the shapes in the ATOMMS 5 Sources of uncertainty and validation of results
ratio spectrum in Fig. 5c and d is due to the use of the two
There are a number of sources of uncertainty in the
different reference periods, which change the amplitude ra-
ATOMMS mountaintop water vapor retrievals that include
tio in the denominator of Eq. (2). The increased liquid op-
tical depth due to the cloud eliminated the three frequencies 1. measurement errors including signal-to-noise-ratio
nearest the line center. Although scatter about the best-fit for- (SNR) and instrument drift,
ward calculation line is larger than that in Fig. 5a and b, the
fitted forward calculations constrain the water vapor solution 2. undesired environmental effects such as scintillations
quite well, despite the presence of the cloud and some light due to turbulence,
rain. The better fit that results when using the second refer- 3. errors in modeling including gaseous spectroscopy and
ence period indicates that there was some subtle instrumental particulate scattering,
drift over the 2.5 h between reference periods. Near the cloud
peak, the Reference 1 water vapor solutions are greater than 4. biases due to errors in the reference period air tempera-
ture and water vapor estimates,
www.atmos-meas-tech.net/12/1955/2019/ Atmos. Meas. Tech., 12, 1955–1977, 20191966 D. M. Ward et al.: ATOMMS 183 GHz ground-based retrievals of water vapor
5. errors in the estimated time-varying, path-averaged, air
temperature, and
6. uncertainty in spectral fitting.
In terms of measurement errors (Category 1), the high SNR
that enabled penetration and water vapor retrievals up to opti-
cal depths of 17 is not a significant source of error, except, of
course, when optical depths exceeded 17 and became impen-
etrable. As noted, we did see signs of subtle instrument drift
over approximately 2.5 h, which is 9000 s, which shifted the
retrieved water vapor amount by 0.2 %. However, because
the duration of a LEO occultation is only about 100 s, errors
due to instrument drift in LEO should be very small.
Turbulence-induced amplitude scintillations (Category 2)
were quite significant during the periods of strong convec-
tion. These were reduced by almost an order of magnitude
via amplitude ratioing with the calibration signal (Kursin-
ski et al., 2016b). The strong peaks near 14.6 h in Fig. 3b Figure 6. ATOMMS ratio for four changes in the atmospheric con-
are caused by momentary noise in the calibration signal, ditions along the 5.4 km observation path relative to reference con-
which influences the frequency ratioing. Outside of this peak ditions: vapor pressure decreased by 1 hPa (blue), temperature in-
the largest fractional uncertainty is about 1.8 % of the vapor creased by 5.9 K (red), vapor pressure decreased by 3 hPa (green)
pressure (green line). We attribute most of this to turbulent- and air pressure increased by 10 hPa (black). The reference condi-
induced scintillations that remain after the frequency ratio- tions were air pressure = 743 hPa, air temperature = 20 ◦ C and va-
ing. Thus, for the conditions of this field experiment, the up- por pressure = 15 hPa.
per bound for the random error in the vapor pressure retrieval
due to turbulence is about 1.8 % of the vapor pressure.
In terms of spectroscopic errors (Category 3), we again was approximately −0.17 hPa ◦ C−1 . Examples of the sensi-
note that ATOMMS is itself a very high spectral resolution tivity of the ATOMMS ratio, Eq. (2), to changes in vapor
spectrometer such that the ATOMMS data can be used to pressure, temperature and air pressure relative to the refer-
refine the spectroscopic models and make them as accurate as ence conditions for this experiment are shown in Fig. 6. The
the ATOMMS observations. Along these lines, we also note figure plots the forward-computed ATOMMS ratio spectrum
that, in order to diagnose and reduce spectroscopic errors, for four different changes relative to the reference conditions.
Kursinski et al. (2009) recommended increasing the required For the conditions of the field experiment, we were able to
number of low-band signals from 4 to 5 to make the solutions measure amplitudes for signal frequencies of 187.861 GHz
systematically overdetermined in order to identify systematic and higher. Lower frequencies closer to the line center were
errors in spectroscopic models and then refine those models. too attenuated to track. The figure shows the change in the
Errors in the reference period temperature and water vapor ATOMMS ratio spectrum resulting from a change in air pres-
estimates (Category 4) create unknown biases in our moun- sure of 10 hPa, which is much larger than the ±2 hPa changes
taintop estimates. These biases are not relevant to the even- in air pressure that were observed during the experiment.
tual LEO system because, in the LEO–LEO occultation ge- Therefore, the sensitivity of the ATOMMS ratio to changes
ometry, the reference period occurs when the signal path is in air pressure is quite small relative to changes in vapor
above the detectable atmosphere, where the atmospheric den- pressure. As the figure shows, for frequencies greater than
sity is essentially zero. 187.861 GHz, a 1 hPa decrease in vapor pressure produced
The primary cause of temperature-related uncertainty is in approximately the same ATOMMS amplitude ratio spectrum
the change in temperature between the reference period and as a 5.9 ◦ C increase in air temperature. Larger changes in va-
the observation time (category 5). Errors in the absolute tem- por pressure, such as the −3 hPa line in the figure, are eas-
perature are relatively insignificant; i.e., temperature biases ily distinguished from changes in air temperature. Based on
are not a significant source of uncertainty in the water vapor Fig. 4, the uncertainty in the change in temperature relative
retrievals in comparison to errors in estimating the change in to the reference period temperature during this experiment
temperature relative to the reference periods. For the condi- was less than 3 ◦ C, which places an upper bound of a 0.5 hPa
tions of this particular experiment, based on forward calcula- water vapor uncertainty due to the temperature uncertainty.
tions made with am7.2 for the range of temperature and va- The misfit between the measured ATOMMS amplitude
por pressure conditions observed during the experiment, the spectral ratios and the forward calculation of those spec-
sensitivity of the change in derived water vapor due to a tem- tral ratios (category 6) are sensitive to all of the error types
perature change relative to the reference period temperature noted above. To understand and characterize the robustness
Atmos. Meas. Tech., 12, 1955–1977, 2019 www.atmos-meas-tech.net/12/1955/2019/You can also read