Drivers of nitrogen and phosphorus dynamics in a groundwater-fed urban catchment revealed by high-frequency monitoring - HESS
←
→
Page content transcription
If your browser does not render page correctly, please read the page content below
Hydrol. Earth Syst. Sci., 25, 69–87, 2021
https://doi.org/10.5194/hess-25-69-2021
© Author(s) 2021. This work is distributed under
the Creative Commons Attribution 4.0 License.

Drivers of nitrogen and phosphorus dynamics in a groundwater-fed
urban catchment revealed by high-frequency monitoring
Liang Yu1,2 , Joachim C. Rozemeijer3 , Hans Peter Broers4 , Boris M. van Breukelen5 , Jack J. Middelburg6 ,
Maarten Ouboter2 , and Ype van der Velde1
1 Faculty of Science, Vrije University Amsterdam, 1181 HV, Amsterdam, the Netherlands
2 Waternet  Water Authority, 1096 AC, Amsterdam, the Netherlands
3 Deltares, 3508 TC, Utrecht, the Netherlands
4 TNO Geological Survey of the Netherlands, 3584 CB, Utrecht, the Netherlands
5 Department of Water Management, Faculty of Civil Engineering and Geosciences,

Delft University of Technology, Stevinweg 1, 2628 CN, Delft, the Netherlands
6 Department of Earth Sciences, Faculty of Geosciences, Utrecht University,

P.O. Box 80 021, 3508 TA, Utrecht, the Netherlands

Correspondence: Liang Yu (xiaobaidrawing@gmail.com)

Received: 24 January 2020 – Discussion started: 26 February 2020
Revised: 1 October 2020 – Accepted: 5 October 2020 – Published: 5 January 2021

Abstract. Eutrophication of water bodies has been a prob-       dissolved NH4 in spring suggests uptake by primary pro-
lem causing severe degradation of water quality in cities. To   ducers, consistent with high concentrations of chlorophyll a,
gain mechanistic understanding of the temporal dynamics of      O2 , and suspended solids during this period. Total P and
nitrogen (N) and phosphorus (P) in a groundwater-fed low-       turbidity were high during winter (range 0.5–2.5 mg P L−1
lying urban polder, we applied high-frequency monitoring in     and 200–1800 FNU, respectively, where FNU represents For-
Geuzenveld, a polder in the city of Amsterdam. The high-        mazin Nephelometric Unit) due to the release of P and re-
frequency monitoring equipment was installed at the pump-       duced iron from anoxic sediment to the water column, where
ing station where water leaves the polder. From March 2016      Fe2+ was rapidly oxidized and precipitated as iron oxides
to June 2017, total phosphorus (TP), ammonium (NH4 ), tur-      which contributed to turbidity. In the other seasons, P is re-
bidity, electrical conductivity (EC), and water temperature     tained in the sediment by sorption to precipitated iron oxides.
were measured at intervals of less than 20 min. This paper      Nitrogen is exported from the polder to the receiving waters
discusses the results at three timescales: annual scale, rain   throughout the whole year, mostly in the form of NH4 but in
event scale, and single pumping event scale. Mixing of up-      the form of organic N in spring. P leaves the polder mainly
welling groundwater (main source of N and P) and runoff         during winter, primarily associated with Fe(OH)3 colloids
from precipitation on pavements and roofs was the domi-         and as dissolved P. Based on this new understanding of the
nant hydrological process governing the temporal pattern of     dynamics of N and P in this low-lying urban catchment, we
the EC, while N and P fluxes from the polder were also regu-    suggested management strategies that may effectively con-
lated by primary production and iron transformations. In our    trol and reduce eutrophication in urban polders and receiving
groundwater-seepage controlled catchment, NH4 appeared to       downstream waters.
be the dominant form of N with surface water concentrations
in the range of 2–6 mg N L−1 , which stems from production
in an organic-rich subsurface. The concentrations of NH4 in
the surface water were governed by the mixing process in        1   Introduction
autumn and winter and were reduced down to 0.1 mg N L−1
during the algal growing season in spring. The depletion of     Eutrophication is one of the most notorious phenomena of
                                                                water quality impairment in cities, caused by excess in-

Published by Copernicus Publications on behalf of the European Geosciences Union.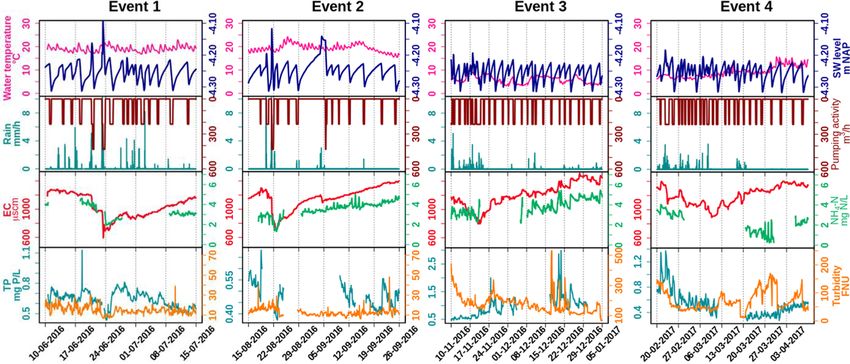
70                     L. Yu et al.: Drivers of nitrogen and phosphorus dynamics in a groundwater-fed urban catchment

puts of N and P. The identified sources of nutrients are           (Audet et al., 2020). The retained P compounds are either be-
from wastewater treatment plants, storm runoff, overflow of        ing permanently buried in the sediment or temporarily stored
sewage systems, manure and fertilizer application in urban         and acting later on as an internal nutrient source (Kleeberg
green areas, and atmospheric deposition (Walsh et al., 2005;       et al., 2007; Filippelli, 2008; Zhang et al., 2018). Multiple
Kabenge et al., 2016; Toor et al., 2017; Yang and Toor, 2018;      researchers have highlighted the influence of iron chemistry
Putt et al., 2019). Recently, groundwater has been identified      on the dynamics of P in pH-neutral environments (Chen et
as another important source of N and P in cities situated in       al., 2018; Van der Grift et al., 2018). This is especially rele-
low-lying deltas, where dissolved NH4 and PO4 in ground-           vant when iron-rich groundwater interacts with surface wa-
water seep up into urban surface water (Yu et al., 2018,           ter (Griffioen, 2006; Rozemeijer et al., 2010a; van der Grift,
2019). The upwelling nutrients in groundwater, originating         2014; Yu et al., 2019), in which P is immobilized by the for-
from the organic-rich delta subsurface, reach the surface wa-      mation of iron (oxy)hydroxides during groundwater aeration.
ter of cities and are transferred to downstream waters and         However, changes in chemistry or temperature may lead to
eventually reach the coastal zones, where they may induce          the release of P and reduced iron. For instance, under anaer-
harmful algal blooms or cause hypoxia along coastlines (He         obic conditions, Fe and P can be mobilized by sulfate reduc-
and Xu, 2015; Beusen et al., 2016; Le Moal et al., 2019).          tion, but this can be counteracted by the presence of NO3 as
Hence, it is of pivotal importance to understand N and P dy-       electron acceptor (Smolders et al., 2006).
namics in the urban freshwater bodies in order to mitigate the        Most studies of eutrophication are based on discrete sam-
input of nutrients into the oceans (e.g., Nyenje et al., 2010;     pling events which can give a general pattern of nutrient dy-
Toor et al., 2017; Paerl et al., 2016, 2017; Le Moal et al.,       namics but can easily miss important nutrient transport and
2019).                                                             processing phenomena (Rozemeijer et al., 2010b; Rode et al.,
   Nutrient dynamics are governed by biological, chemical,         2016; Toor et al., 2017). The countermeasures to control eu-
and physical processes as well as their interactions. Assimi-      trophication have been hampered because of limited knowl-
lation by primary producers is a major biological factor reg-      edge of N and P dynamics, e.g., their response to changing
ulating N and P concentrations in the aquatic environment.         weather conditions and land use (van Geer et al., 2016). In
Aquatic micro- and macroorganisms assimilate P as PO4 and          the past few years, the development of new sensors and sam-
N mainly in fixed forms, such as nitrate (NO3 ) and ammo-          pling technologies allows us to obtain data with substantially
nium (NH4 ), but for some specific organisms also in the form      shorter intervals. In this paper, the high-frequency monitor-
of N2 . In estuaries, NH4 is the preferred N form for mi-          ing technology is referred to as an automatic monitoring pro-
crobes (Middelburg and Nieuwenhuize, 2000), but the uptake         gram with sampling and analyzing frequencies that are suffi-
rate for both NH4 and NO3 can achieve maximum rates un-            cient for obtaining detailed water quality variation informa-
der sustained exposure of NH4 or NO3 (Bunch and Bernot,            tion. High-frequency technology has proved to be a way to
2012). Moreover, the nitrogen species are also involved in         understand nutrient dynamics (Rode et al., 2016; van Geer
redox transformations (Soetaert and Herman, 1995). Under           et al., 2016; Bieroza et al., 2018). Due to the abundant in-
anaerobic conditions, NO3 can be reduced to NH4 , in partic-       formation offered by this technology, combined methodolo-
ular with high organic matter contents. It may also be deni-       gies have been developed to quantitatively understand the
trified to N2 and N2 O under such conditions (Mulder et al.,       in-stream hydrochemistry of nutrients (Miller et al., 2016;
1995); the latter is a climate-active gas. Under aerobic con-      van der Grift et al., 2016; Duncan et al., 2017).
ditions, NH4 can be oxidized to NO3 through nitrification             In our previous study on the water quality of Amster-
by nitrifying microbes, which is an O2 -consuming and acid-        dam (Yu et al., 2019), the transport routes of N and P from
generating process. Nitrification even occurs under cold con-      groundwater to surface water through seepage and drains
ditions (below 10 ◦ C) (Painter, 1970; Wilczak et al., 1996;       were identified. In addition, spatial and temporal concen-
Cavaliere and Baulch, 2019).                                       tration patterns from discrete sampling campaigns showed
   The mixing of water from different flow routes is an im-        a clear dilution pattern of other water quality parameters
portant hydrological process that controls nutrient dynam-         such as electrical conductivity (EC). However, the tempo-
ics (Rozemeijer and Broers, 2007; Rozemeijer et al., 2010a;        ral patterns of N and P were still poorly understood, prob-
van der Grift et al., 2014; Yu et al., 2019). As nutrient con-     ably due to their reactive nature and more complex bio-
centrations and speciation differ among different flow routes      geochemistry. In order to obtain insight into the controlling
(Wriedt et al., 2007; Rozemeijer et al., 2010a; Yu et al., 2019;   mechanisms of N and P transport and their fate in urban
Yang and Toor, 2018), the mixing process results in dilution       delta catchments affected by groundwater, we performed a
or enrichment of nutrients in surface water bodies during pre-     year-round high-resolution N and P concentration monitor-
cipitation events (Wang et al., 2016).                             ing campaign. A deep understanding of the water quality dy-
   Retention is another factor that determines nutrient con-       namic drivers would be a great asset for controlling eutroph-
centrations and transport (McGlathery et al., 2001; Zhu et         ication and improving aquatic ecological status (Fletcher et
al., 2004; Henry and Fisher, 2003), especially for phospho-        al., 2015; Díaz et al., 2016; Eggimann et al., 2017; Nizzoli et
rus, most of which is retained in inland water body sediments      al., 2020). We conducted a 1-year high-frequency monitor-

Hydrol. Earth Syst. Sci., 25, 69–87, 2021                                             https://doi.org/10.5194/hess-25-69-2021
L. Yu et al.: Drivers of nitrogen and phosphorus dynamics in a groundwater-fed urban catchment                                71

ing campaign in 2016–2017. Measured parameters were EC,           Table 1. Pumping scheme of polder Geuzenveld.
NH4 , total phosphorus (TP), turbidity, and water tempera-
ture. The temporal patterns of these parameters were studied       Time                   Settings              Pump 1   Pump 2
at three timescales: the annual scale, rain event scale, and       05:00:00–19:00:00 LT   Start point (m NAP)   −4.20    −4.16
pumping event scale.                                                                      End point (m NAP)     −4.26    −4.24
                                                                   19:00:00–05:00:00 LT   Start point (m NAP)   −4.23    −4.18
2     Methods                                                                             End point (m NAP)     −4.31    −4.29

2.1    Study site
                                                                     There are two pumps (Pump 1 and Pump 2) in the pump-
The Geuzenveld study site is part of an urban lowland polder
                                                                  ing station, and they have different start and end pumping
catchment, which is characterized by groundwater seepage
                                                                  threshold points (Table 1).
that constantly determines the surface water quality, being
                                                                     The two pumps are activated when the surface water level
the main source of solutes in the water system. The ground-
                                                                  exceeds the triggering level, which are furthermore separated
water seepage is a continuous source of slightly brackish,
                                                                  into day and night triggering levels (Table 1). The capac-
anoxic, and iron- and nutrient-rich water. Yu et al. (2019)
                                                                  ity of each pump is 3.6 m3 min−1 . Most of the time, only
presented the results of a 10-year monitoring program de-
                                                                  one of the two pumps works and the surface water level is
scribing the main processes determining the water quality in
                                                                  maintained between −4.31 and −4.23 m NAP, which are the
the catchment, which is dominated by mixing of runoff water
                                                                  night inactive and active pumping levels, respectively. Nor-
and seepage water. A high-frequency monitoring campaign
                                                                  mally, the surface water level drops immediately when the
was set up to further unravel the temporal patterns of the nu-
                                                                  pump(s) starts working. Once the pump(s) stops, the surface
trient N and P, of which N is typically present in the form of
                                                                  water level will steadily rise due to the continuous inflow of
NH4 from groundwater.
                                                                  groundwater seepage. During rainfall events, the surface wa-
   Geuzenveld is a newly built urban polder on the west side
                                                                  ter level rises faster (Fig. 2a).
of the city of Amsterdam (Fig. 1). Since the 1990s, when it
was converted from agricultural to urban land, it has devel-
oped into a highly paved area. Similar to other new neigh-        2.2     Monitoring network setup
borhoods, Geuzenveld is equipped with a separated drainage
system. A rain-harvesting system was installed on all the         2.2.1    High-frequency monitoring
buildings and houses in the polder, leading rain water from
the roof and the street directly to the ditches, which results    A high-frequency monitoring network was built on a tem-
in fast and large amounts of runoff during storm events.          porary floating platform in front of the pumping station.
Geuzenveld is a groundwater-fed catchment due to the con-         The water flowed around and underneath this platform to
stantly higher groundwater head (−2.5 to −3 m NAP, where          the pumping station when the pumps started working. One-
NAP represents Normaal Amsterdams Peil, i.e., Amsterdam           year time series of NH4 -N (mg L−1 ), TP (and orthophos-
Ordnance Datum) in the main aquifer relative to the surface       phate) (mg L−1 ), turbidity (Formazin Nephelometric Unit,
water level in the polder ditches (∼ −4.25 m NAP) (Fig. 2).       FNU), electrical conductivity (EC, µS cm−1 ), and water tem-
To keep the foundations of the buildings dry, there is a          perature (◦ C) were collected by the following equipment:
groundwater drainage system placed under an artificial sandy      a Sigmatax sampler combined with a Phosphax sigma auto
layer, right on top of a natural clay layer. The drain eleva-     analyzer for total phosphorus (TP), Amtax for NH4 -N com-
tions range from −4.84 to −4.61 m NAP, which is below             bined with a Filtrax automatic sampler, a “Solitax t-line sc”
the phreatic groundwater level throughout the year, making        for turbidity (manufactured by Hach Lange GmbH, Düs-
sure that groundwater seepage either discharges through the       seldorf, Germany), and CTD-Diver for electrical conductiv-
drains or the ditches.                                            ity (EC) and water temperature (manufactured by Van Es-
   The water system of Geuzenveld is connected to the sec-        sen Instruments, Delft, the Netherlands). The monitoring fre-
ondary water channel to its east and then connected to the        quencies were set to 20, 10, 5, 5, and 5 min intervals for TP,
adjacent primary channel (boezem in Dutch) that is called         NH4 -N, turbidity, EC, and water temperature, respectively.
the Boezem Haarlemmerweg. The boezem water level is                  The Phosphax sigma is an analog analyzer for the high-
−2.10 m NAP. It is much higher than the target surface water      precision determination of total phosphorus concentration
level of Geuzenveld, −4.25 m NAP. The surface water level         in accordance with the EN 1189 phosphomolybdenum blue
in polder Geuzenveld is controlled by a pump station, which       method. Samples are automatically taken through a Sigmatax
is the main outlet of this polder, situated in the northeastern   sampling probe and include suspended solids. Subsequently,
corner.                                                           the sample is ultrasonically homogenized before delivery
                                                                  to the Phosphax sigma. It is digested by the sulfuric acid–
                                                                  persulfate method (APHAAWWA-WPCF, 1989) and ana-

https://doi.org/10.5194/hess-25-69-2021                                             Hydrol. Earth Syst. Sci., 25, 69–87, 2021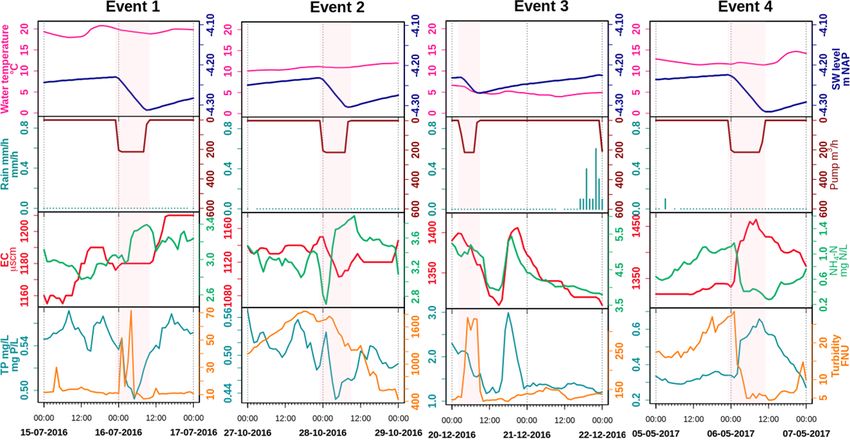
72                     L. Yu et al.: Drivers of nitrogen and phosphorus dynamics in a groundwater-fed urban catchment

Figure 1. Location of polder Geuzenveld (source: © Google Maps) and its landscape cross section as well as rain water and groundwater
drainage system.

lyzed with an LED photometer (at 880 nm) (Hach, user man-            to Amtax sc for analysis. The ammonium in the sample
ual of Phosphax sigma, 2016).                                        is first converted to gaseous ammonia. Only the NH3 gas
    Samples for NH4 are prepared by a filtration system (Fil-        passes through the gas-permeable membrane of the electrode
trax). It continuously extracts samples through two ultra-           and is detected. This method guarantees a wide measuring
filtration membrane (0.15 µm) plates. Particles get dispersed        range and is less sensitive to other compounds compared to
by a continuous aeration system near the surface of the              methods that make use of an ion-selective electrode (ISE).
membranes. (The aeration caused severe build-up of iron              The Amtax sc in our study was calibrated automatically at
precipitants on the plates.) The samples are then delivered          22:00 LT every 24 h before September 2016 and every 48 h

Hydrol. Earth Syst. Sci., 25, 69–87, 2021                                                https://doi.org/10.5194/hess-25-69-2021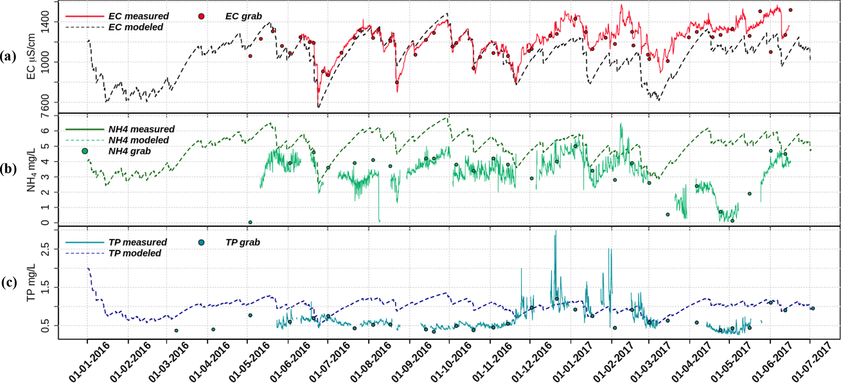
L. Yu et al.: Drivers of nitrogen and phosphorus dynamics in a groundwater-fed urban catchment                                              73

Figure 2. Time series of (a) surface water level (SW level) and groundwater level (m NAP), (b) net rainfall (daily water surplus (+) (light
blue) and deficit (−) (dark blue), mm d−1 ) and daily pumping volume (m3 d−1 ), (c) hourly time series of EC (µS cm−1 ) and NH4 -N
(mg N L−1 ), (d) hourly TP and turbidity, and (e) discrete samples of Fe (total iron in water column) and O2 concentrations (mg L−1 ). The
dots in (c) and (d) are the corresponding discrete sampling data, which are plotted to show their close match to the continuous time series
data, as well as to fill in the gaps. All data were monitored at the pump station. The transparent pink blocks are the selected rain events for
further analysis in Sect. 3.3. See Tables S1–S3 for the correlation tests performed on the dataset.

thereafter. Maintenance work was conducted weekly as the                  was also applied in this network. It worked for all equipment
tubes were easily blocked by iron precipitates (Hach, user                except for the Phosphax, which had to be restarted manually
manual of Amtax sc, 2013).                                                after a blackout.
   The Solitax t-line sc sensor is a turbidity sensor with dual-             Precipitation (hourly) and evapotranspiration (daily) data
beam optics and added backscatter. The measuring principle                were downloaded from the Schiphol KNMI (Royal Nether-
is based on a combined infrared absorption scattered light                lands Meteorological Institute) station which is about 2 km
technique that measures the lowest turbidity values in accor-             away from Geuzenveld. Hourly pumping activity and surface
dance with DIN EN 27027 just as precisely and continuously                water level data were obtained from Waternet, the water au-
as high sludge contents. Using this method, the light scat-               thority of Amsterdam.
tered sideways by the turbid particles is measured over an
angle of 90◦ (Hach, user manual of Solitax sc, 2009).                     2.2.2   Low-frequency monitoring
   The monitoring period of NH4 and turbidity is from
10 May 2016 to 16 June 2017. Time series of phosphorus                    Since 2006, Waternet has monitored the water quality with a
were obtained from 23 May 2016 to 16 June 2017. Electrical                frequency of 12 times per year by sampling at the pumping
conductivity and temperature data are from 10 June 2016 to                station of Geuzenveld. Between 2016 and 2017, the sampling
15 June 2017. The NO3 analyzer, Nitratax, time series con-                frequency was increased to twice per month. We selected the
sistently showed an artificial drift and proved to be unreliable          following parameters from the routine monitoring campaign:
in our field setting, possibly due to biofilm accumulation in             (1) EC, NH4 -N, and TP to fill in the gaps in the continu-
combination with iron oxide precipitation (see the Discus-                ous time series and to verify and monitor the potential drift
sion section). All the equipment outputs were integrated into             and offset of the high-frequency data and (2) pH, O2 , HCO3 ,
one wireless station. The monitoring station was shut down                NO3 , TN, Kjeldahl N, suspended solids (details of methods
several times by lightning, so an electricity restart program             are described by Yu et al., 2019), chlorophyll a, and trans-
                                                                          parency for further understanding of the biogeochemical pro-

https://doi.org/10.5194/hess-25-69-2021                                                       Hydrol. Earth Syst. Sci., 25, 69–87, 2021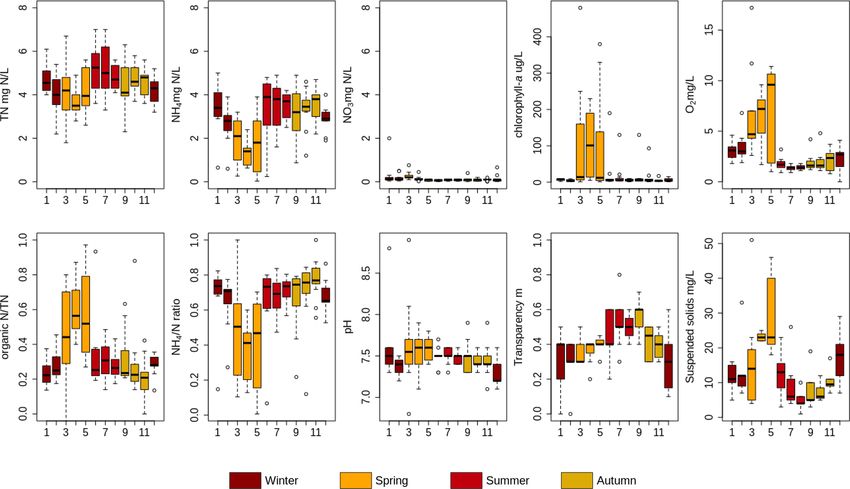
74                     L. Yu et al.: Drivers of nitrogen and phosphorus dynamics in a groundwater-fed urban catchment

cesses. Organic N was estimated by subtracting NH4 -N from          ence between groundwater head in the first aquifer and the
Kjeldahl N.                                                         surface water level (Fig. 2a) to estimate a range of the seep-
   Biweekly total iron in the water column was analyzed sep-        age. The actual rate of 2 mm d−1 was chosen based on the
arately using ICP-AES (inductively coupled plasma atomic            behavior of the mixing model and calibrated using the mea-
emission spectrometry). Total Fe was analyzed from sam-             sured surface water levels (Fig. S1 in the Supplement).
ples to which HgCl2 was added for preservation and that                A complete mixing of solutes was assumed in the model,
were stored in a dark and cool environment. To release all          which means that seepage, ditch water, and precipitation mix
Fe that may have sorbed or precipitated during storage, we          instantaneously when they enter the surface water. A delay
added 1 or 0.5 mL of HCl in the water samples to dissolve           from precipitation to runoff or drainage and to ditches was
eventual flocs. Then the samples were homogenized in an ul-         not specifically considered.
trasonic bath for 24 h and mixed again to break down all the
                                                                    d(V C)
flocs. For extraction of all the Fe, we transferred 10 mL of               = S · Apolder · Cgw + P (t) · Apolder · CP − Pump(t) · C(t) (3)
                                                                      dt
the homogenized sample into a Teflon bottle, added 3.2 mL
of HCl−HNO3 3 : 1, and stored it in a stove at 90 ◦ C for 24 h.     V is the ditch water volume given by Eq. (1), C(t) is solute
The final solutions were analyzed by ICP-AES. Blanks were           concentration at time t, Cgw is the average groundwater con-
included and treated identical to samples.                          centration, and CP is the average concentration in runoff.
                                                                       In our study area, the EC is a useful water quality param-
2.3   Data processing and analysis                                  eter for describing the mixing processes between groundwa-
                                                                    ter and runoff water, as the EC represents the end-members
A correlation analysis between the high-frequency and dis-          of the mixing: groundwater with a high EC (1750 µS cm−1 )
crete monitoring data was applied to illustrate the reliabil-       and runoff water (100 µS cm−1 ) with a low EC (see also Yu
ity of the high-frequency time series. Furthermore, the time        et al., 2019). Moreover, we assume that EC behaves as a
series data were analyzed at three timescales: annual scale,        conservative tracer as the EC is highly correlated with the
rainfall events (several days), and single pumping events           Cl concentration (R 2 = 0.71, p value < 0.05) and the tem-
(several hours). The relationships among the monitored pa-          poral patterns of EC and Cl are very similar (see Fig. S2).
rameters was explored by testing their correlations at each         In the model, seepage rate was adapted to get the best fit
timescale. At the annual scale, a correlation analysis was ap-      between the modeled and the measured EC. The calibrated
plied to the complete time period and the wet and dry pe-           seepage rate was 2.0 mm d−1 . Compared to EC, nutrients are
riods (definition in Sect. 3.1.1). To discern the hydrological      highly reactive solutes and thus can vary a lot along their flow
and chemical or biological attributes to the observed dynam-        routes due to biogeochemical processes. The model provided
ics, a linear mixing model was introduced at the annual scale,      a tool to simulate hourly concentration dynamics under the
assuming that precipitation and groundwater seepage are the         assumption that EC, NH4 , and TP were conservative. The
only water inputs, pumping and evapotranspiration are the           simulated EC, NH4 -N, and TP were plotted together with
only outputs, and pumping activity is the only way solutes          the high-frequency time series and the grab sampling data in
leave the water system. In this model, we assumed a constant        Fig. 3. As in Fig. 2, the high-frequency measurements were
seepage rate. Accordingly, surface water level was calculated       aggregated from 5 min (EC), 10 min (NH4 ), and 20 min (TP)
from                                                                intervals into an hourly interval. The grab sampling results
dV                                                                  were all set to be measured at 10:00 LT as that coincides with
    = (P (t) + S − E(t)) · Apolder − Pump(t),                (1)    the usual grab sampling times. Additionally, a comparison
dt
L(t) = V (t)/Aditch .                                        (2)    between the modeled and the measured results to the annual
                                                                    scale was performed by using correlation analysis and ag-
V is total water volume in the ditches, P is precipitation,         gregating the model, the high-frequency results, and the grab
S is a constant seepage, E is potential evapotranspiration,         sampling results at a 4 d average.
Apolder is area of the polder, Pump(t) is water volume being           The average concentration of EC in groundwater was set
pumped out with a maximum capacity of 216 m3 h−1 , and              equal to the average of the sampling survey, which was
Aditch is the area of the ditches in the polder. L is surface wa-   1750 µS cm−1 (including both deep and shallow groundwa-
ter level in the ditches. Water level L determines the activa-      ter; Yu et al., 2019). For the NH4 and TP concentration
tion of pumping activity. Once L(t) exceeds the upper ranges        data, we chose the measurement from a drain sampling point
of water level (start point, Sect. 2.1), the pumps will start to    (Drain 3; Yu et al., 2019) in the middle of the polder as the
pump until L goes below the stopping point (Sect. 2.1) in the       nondisturbed groundwater collected by the drains in this area
pumping scheme. Given the year-round seepage conditions             of the polder. They were 8.1 mg N L−1 and 1.6 mg L−1 , re-
throughout the polder, combined with an artificially drained        spectively. The starting (1 June 2015) concentrations were
subsurface, we assumed that the potential evapotranspiration        1200 µS cm−1 , 4 mg L−1 , and 2 mg L−1 for EC, NH4 , and TP,
was close to the actual evapotranspiration as no water short-       respectively. The model was not sensitive to the selected end-
ages occur in our situation. In this study, we used the differ-     member values.

Hydrol. Earth Syst. Sci., 25, 69–87, 2021                                                https://doi.org/10.5194/hess-25-69-2021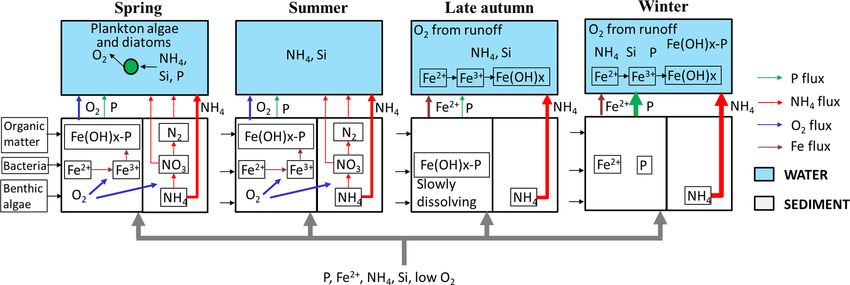
L. Yu et al.: Drivers of nitrogen and phosphorus dynamics in a groundwater-fed urban catchment 75
Figure 3. Plots of fixed-end-member mixing model predicted (a) EC, (b) NH4 , and (c) TP with their measured time series data and the
discrete sampling results. See Tables S4–S6 for the correlation tests performed on the dataset.
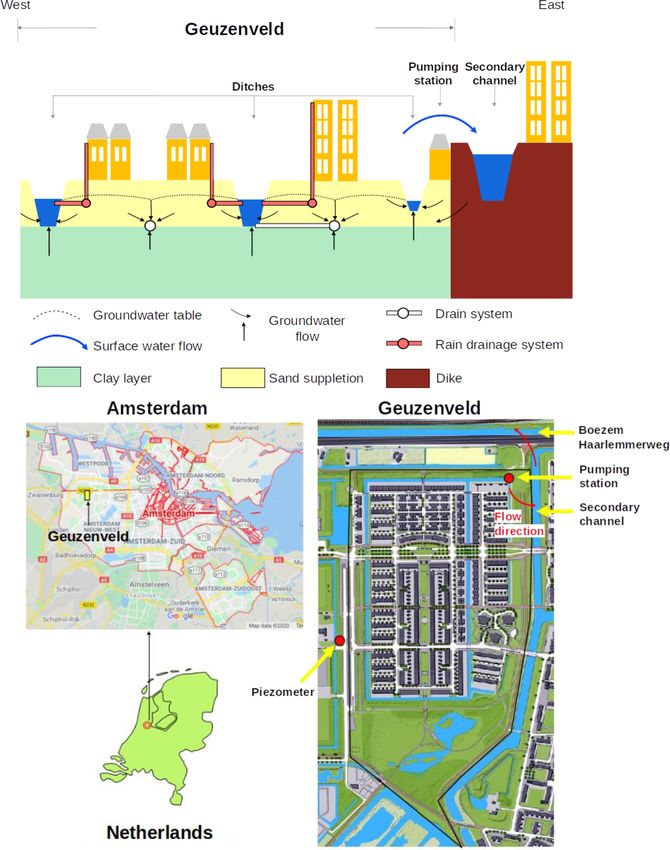
The time series data were further analyzed at shorter tion < daily precipitation) or a water deficiency (dark blue in
scales: rain event scale and pumping event scale. Four rain Fig. 2b, daily evapotranspiration > daily precipitation). We
events were selected according to the dilution extent of EC, defined the wet and dry seasons based on water surplus and
defined as an EC value reduced by over 35 %, they were deficit. The average net rainfall (the water surplus/deficit in
10 June–15 July 2016, 15 August–26 September 2016, Fig. 2) is 1.4 mm d−1 for the period of 1 October 2016–
10 November 2016–5 January 2017, and 20 February– 15 March 2017 and −0.8 mm d−1 for the rest. Subsequently,
10 April 2017. These four events covered both EC dilu- we statistically analyzed the difference between these two
tion during rainfall and the recovery afterwards in differ- periods for multiple parameters. Table 2 shows the mean of
ent seasons. We selected four representative pumping events each parameter for the wet and dry seasons and their signifi-
to present the response of EC, NH4 , TP, and turbidity cance test results. The wet and dry season means are signifi-
to the pumping activities. Those events were during 15– cantly different for all parameters except the EC.
17 July 2016, 27–29 October 2016, 20–22 December 2016, Over the whole monitoring period, the water temper-
and 5–7 May 2017. Correlation analysis was as well applied ature ranged between 2 and 26 ◦ C. From June to mid-
to each event at the two corresponding timescales, averag- September 2016, the temperature remained above 18 ◦ C and
ing over whole days for precipitation events and over hours then declined to become lower than 10 ◦ C at the end of Oc-
for pumping events. Data processing and analyzing were per- tober. The following 4 months (November to February) were
formed using Rstudio (R version 4.0.2) and time series pack- the coldest, especially in January and February 2017, during
age “xts”. which the water temperature dropped to below 3 ◦ C. By the
end of February, temperatures started to rise again to reach
10 ◦ C by the end of March 2017.
3 Results The surface water level in Geuzenveld has been main-
tained between −4.31 and −4.1 m NAP, strictly regulated by
3.1 Annual pattern of meteorological, hydrological, pumping (Fig. 2a). After the pumps stopped, the surface wa-
and water quality time series ter level recovered faster during the wet season (between Oc-
tober 2016 and March 2017) than during the dry season. Sim-
3.1.1 Meteorological and hydrological conditions in
ilarly, the shallow groundwater level positively corresponded
polder Geuzenveld
to the precipitation and negatively to the daily accumulative
pumping volume. The phreatic groundwater level in Fig. 2a
To explain the time series (Fig. 2), we distinguish between
(light blue) was from one of the piezometers, which lies right
dry and wet periods and dry and wet seasons. The wet
outside of the polder (Fig. 1; 52◦ 220 46.000 N, 4◦ 470 15.600 E).
and dry periods (days to weeks) are represented by a wa-
In contrast to the constant surface water levels (Fig. 2a, dark
ter surplus (light blue color in Fig. 2b, daily evapotranspira-
https://doi.org/10.5194/hess-25-69-2021 Hydrol. Earth Syst. Sci., 25, 69–87, 2021
76                             L. Yu et al.: Drivers of nitrogen and phosphorus dynamics in a groundwater-fed urban catchment

Table 2. The mean of each parameter and the significance for the wet and dry seasons.

           Net rainfall∗        Pump volume∗            Water temperature∗               EC           NH4 ∗              TP∗      Turbidity∗    Fe∗      O2 ∗
               mm d−1                 m3 d−1                           ◦C             µs cm−1        mg N L−1          mg P L−1        FNU     mg L−1   mg L−1
  Wet                 1.4                    1050                            6.7        1212              3.7              0.8          197     3.4      4.3
  dry                −0.8                     712                             17        1252              3.0              0.5           15     1.5      3.3
∗ p < 0.05 Wilcoxon rank-sum test. The tests were performed in Rstudio (version 3.6.1), i.e. wilcox.text( ) in package “stats”.

blue), the shallow groundwater had relatively low levels in                                   samples. During the same period in 2016, the high-frequency
the wet season compared to the dry season. This is related                                    monitoring had not yet started; a single NH4 discrete mea-
to the water level regulation of the Boezem Haarlemmer-                                       surement is available for 2 May that seems to reveal a similar
weg with higher levels in summer than in winter (https:                                       pattern in the spring of 2016.
//www.rijnland.net/actueel/water-en-weer/waterpeil, last ac-                                     Both TP and turbidity showed contrasting patterns during
cess: 23 December 2020). Phreatic water levels were con-                                      the wet and dry seasons (Fig. 2b). Turbidity stayed below
sistently 20–40 cm higher than the surface water level in the                                 60 FNU during the dry season until October and rapidly in-
polder, which confirms the continuous groundwater seepage                                     creased after a first rain event to 500 FNU (for more details
into the surface water system.                                                                refer to Fig. S3). A drop to about 200 FNU occurred right af-
                                                                                              ter this first peak, which seemed to correspond to excessive
3.1.2     Annual water quality patterns                                                       precipitation and a large pumping volume (Fig. 2b). Soon af-
                                                                                              ter, turbidity went up again and peaked at 1800 FNU. Turbid-
The Pearson’s coefficients of determination (R 2 ) between                                    ity leveled off towards values around 200 FNU for the rest of
the high-frequency data and the routine discrete sam-                                         the wet season and dropped below 60 FNU from April 2017
pling data from the water authority are 0.88 for EC                                           onwards.
(p‘value < 0.05), 0.92 for NH4 (p value < 0.05), and                                             TP concentrations were significantly higher during the pe-
0.97 for TP (p value < 0.05). The scatter plots between the                                   riod between 15 November 2016 and 1 March 2017 than
high- and low-frequency measurements are shown in Fig. S7.                                    the rest of the time (p value < 0.001, Fig. S5), during
   During a rainfall event, rain and runoff from pavements                                    which TP fluctuated around 0.5 mg L−1 but always below
and roofs, which were collected by a separate drainage sys-                                   1 mg L−1 . During the wet season with the low temperatures
tem, directly fed the surface water (Fig. 1). Distinct rainfall                               (Table S2, R 2 = −0.68), TP almost constantly stayed above
events cause a strong dilution pattern of both EC and NH4                                     1 mg L−1 and even reached values of about 3 mg L−1 in De-
(in Fig. 2c). The EC ranged from 600 to 1500 µS cm−1 . In                                     cember. Although there were large gaps in the TP time se-
general, during rainfall events, the EC declined because of                                   ries during this period, the high TP concentrations appear to
dilution, while, after the events, EC gradually rose back up                                  have been diluted by rain events, e.g., the event at around
to around 1500 µS cm−1 . The duration of this process, i.e., re-                              10 January 2017. Most discrete sample measurements of TP
covery time, was longer in the wet season than in the dry sea-                                matched well with values from the high-frequency time se-
son. A similar pattern of dilution and recovery is also visible                               ries (Fig. 2d, Table S1 in the Supplement, R 2 = 0.88).
for NH4 , especially for the period August 2016–March 2017,                                      Total Fe concentrations were most of the time lower than
where NH4 shows a very similar response as EC (Table S2,                                      2 mg L−1 (Fig. 2e), but for the wet season concentrations
wet season, R 2 = 0.73), although with somewhat larger day-                                   were higher and reached up to about 6 mg L−1 . The initia-
to-day fluctuations. However, a contrasting pattern without                                   tion of Fe increases at the beginning of the wet season co-
NH4 recovery occurred twice: from the middle of June to the                                   incided with that of turbidity (Fig. 2d and Table S2, R 2 =
end of August 2016 and from the middle of March to the                                        0.72). Upon the increasing temperature in March 2017, total
middle of May 2017. During these periods, concentrations                                      Fe concentrations dropped back to below 2 mg L−1 (a nega-
of NH4 were considerably lower and deviated from the slope                                    tive correlation between temperature and Fe is shown in Ta-
of the EC pattern. NH4 decreased from around 4 mg L−1 to                                      ble S1). Dissolved O2 concentrations were generally low in
around 2 mg L−1 between the middle of June to the end of                                      the water column, i.e., usually below 5 mg L−1 . Concentra-
August 2016, but the continuous NH4 measurements are not                                      tions of over 3 mg L−1 were only found in March, April, and
supported by the discrete samples which follow the EC pat-                                    May.
tern more closely. During the second period from March to
the middle of May, the deviation from the recovery pattern
is more pronounced, and NH4 concentrations dropped to al-
most 0 mg L−1 and started recovering from the beginning of
May. This pattern is fully supported by the available discrete

Hydrol. Earth Syst. Sci., 25, 69–87, 2021                                                                                https://doi.org/10.5194/hess-25-69-2021
L. Yu et al.: Drivers of nitrogen and phosphorus dynamics in a groundwater-fed urban catchment 77
Figure 4. Selected events showing dilution and peaks of water quality parameters, with hourly precipitation (mm h−1 ) and hourly pumping
activity (m3 h−1 ). Note that between events different scales of TP and turbidity were used to reveal the dynamics. See Tables S7–S10 for the
correlation tests performed on the dataset.
3.2 Model of water quality time series based on water mated by the model, indicating that some NH4 is probably
balance lost due to nonconservative processes. This is especially true
for the spring season of 2017, where NH4 concentrations
must be controlled by additional processes. Concentrations
A simple fixed-end-member mixing model was used to re- of TP are generally far below the conservative model recon-
construct the conservative mixing of EC, NH4 , and TP. The struction, except between the end of November and the be-
simulated and the measured EC, NH4 , and TP are plotted ginning of March. During this particular period, the mini-
in Fig. 3. The correlations between the modeled and mea- mum measured TP concentrations are captured nicely by the
sured results are shown in the Supplement (Tables S4–S6). conservative model, but the distinct peaks up to 3 mg L−1 are
Potential processes that might deprive or enrich nutrients rel- not.
ative to the conservative mixing process along the flow routes
were inferred from the discrepancies between the modeled 3.3 Water quality responses to single event analysis
and the measured data. Figure 3a and Table S5 show that the
predicted and observed EC dynamics agree reasonably well To elucidate the response pattern of water quality to precipi-
from May to 20 November 2016 (R 2 = 0.91). After that, the tation and pumping activity, we selected four major events
conservative mixing approach underestimated the EC, but the (Fig. 2 (four pink shades) and Fig. 4) and four pumping
main dynamics and the amplitudes were still reproduced (Ta- events (Fig. 5). The former events were chosen according to
ble S6, R 2 = 0.82); as groundwater is the only contributor to their clear dilution pattern of EC (Fig. 4), while the latter
the high EC due to the seepage of quite mineralized, slightly were pumping events without occurrence of rainfall (Fig. 5).
brackish water, the model must underestimate the seepage All seasons were covered, including some of the wet and dry
flux from 20 November 2016 on. Overall, the observed dy- periods.
namics of EC are consistent with mixing of high EC seepage
water with low EC runoff water (coefficient of determination 3.3.1 Rainfall events
between the modeled and measured EC is 0.65 over the com-
plete period, Table S4). EC and NH4 showed clear dilution and recovery patterns dur-
The dynamics of measured NH4 concentrations show ing all events, while the pattern was not clear for TP and
close resemblance to the model results, especially during the turbidity (Fig. 4). The extent of dilution of EC appears to
wet season (1 October 2016–15 March 2017). Clearly, NH4 depend on the precipitation intensity. Rainfall during the re-
is diluted during the rain events and a gradual increase of covery period determined how long it took to recover back
NH4 starts after each rain event during the wet season, show- to the highest level. The short but intensive rainfall during
ing slopes that resemble the model reconstruction. Over the dry season events 1 and 2 reduced EC rapidly from around
whole period, measured NH4 concentrations were overesti- 1300 to around 700 µS cm−1 , while the recovery took about
https://doi.org/10.5194/hess-25-69-2021 Hydrol. Earth Syst. Sci., 25, 69–87, 202178 L. Yu et al.: Drivers of nitrogen and phosphorus dynamics in a groundwater-fed urban catchment
Figure 5. Pumping and pumping effect patterns on water quality; pink blocks represent the pumping duration. See Tables S11–S14 for the
correlation tests performed on the dataset.
1 month. Events 3 and 4 had less rainfall, dilution of EC and has higher variance for wet season events 3 and 4,
was less (from about 1300 to about 800 µS cm−1 ), and re- which corresponds with the findings of the annual-scale anal-
covery took more than 1.5 month in event 3, during which ysis (Sect. 3.1.2). During event 3, turbidity varied between
multiple small events occurred. The dilution patterns of NH4 100 and 500 FNU. Although clear relations exist between Fe,
in events 1 and 2 were similar to those of EC (R 2 = 0.86 TP, and turbidity, all higher during the wet season (Fig. 2,
and 0.83, respectively, Tables S7 and S8) and show resem- Table S2), these are not clearly reflected at the scale of in-
blance for event 3 (R 2 = 0.75, Table S10). Moreover, a direct dividual precipitation events. Simultaneous peaks of TP and
negative correlation between NH4 and rain intensity supports turbidity occur that are not easily related to the weather con-
this dilution effect for event 2. Due to the data gaps of NH4 ditions in November and December, but TP and turbidity
in event 4, we cannot completely describe the pattern of NH4 show contrasting signals at the start of the event. The tur-
for this one, but it corresponds with the start of reduced NH4 bidity clearly decreases during rain storm event 3 and at the
which was described in Sect. 3.1 and 3.2. start of event 4. This change is not reflected by the correla-
The response of TP was generally not related to the in- tion at the total event scale (Tables S9 and S10) but obvious
tensity of rainfall and pumping, except for event 3 during when studying only the timescale of the decreasing limb of
the wet period. Dilution effects, as were observed for NH4 , the EC dilution. Event 4 coincides with the transition to the
were not observed for TP for events 1, 2, or 4. During the spring season in 2017, showing decreasing EC, TP, and tur-
wet season event 3, TP concentrations show negative correla- bidity in the last rains of the wet season and a strong decrease
tions with precipitation and pumping intensity (R 2 = −0.79 of NH4 and increase of turbidity when conditions dried up
and −0.59, respectively, Table S9) and correspond with de- and temperatures rose.
creasing turbidity. Event 4 marks the transition between the
wet and dry season, and the drop in TP coincides with the 3.3.2 Pumping events and day and night pattern
drop in NH4 , independently from individual rain storms dur-
ing the dry season. The selected pumping events covered four seasons: sum-
During the dry season (with event 1 and 2 included) tur- mer (2016 July, event 1), autumn (2016 October, late au-
bidity always stayed below 50 FNU. Turbidity sometimes tumn, event 2), winter (2016 December, event 3), and spring
showed single peaks which are likely related to distur- (2017 May, event 4) (Fig. 5). While the effects of pump-
bances of the floating platform by wind and should prob- ing on EC are rather small, TP, NH4 , and turbidity are all
ably be treated as false signals. Turbidity is more variable affected by pumping. The effects of pumping appear to be
different for events in different seasons; turbidity, for exam-
Hydrol. Earth Syst. Sci., 25, 69–87, 2021 https://doi.org/10.5194/hess-25-69-2021L. Yu et al.: Drivers of nitrogen and phosphorus dynamics in a groundwater-fed urban catchment 79
ple, increases during pumping in July and December but de- the drain system that starts to be activated more strongly, re-
creases in May. The increase during the December pumping moving clogged material and lowering the overall resistance
is especially marked (R 2 Pumping intensity versus Turbid- of the drain system for shallow and deep groundwater in-
ity = 0.77, Table S13). TP decreases during pumping in July flow (Van der Velde et al., 2010). It suggests that this trig-
(R 2 = −0.67) and October and increases in May (R 2 = 0.6). gered the inflow of somewhat more mineralized groundwater
Event 2 seems to have started a major drop in turbidity (more relative to the period before, creating a shift in the EC to-
than 1000 FNU) that continued some time after pumping. wards ∼ 250 µS cm−1 higher values that continued during
the remainder of the monitoring campaign. It appeared that it
raised the EC but did not change its amplitude or dynamics
4 Discussion during the remainder of that period (Figs. 2 and 3, Table S6).
The elevated EC may alternatively be due to the application
This study aimed at understanding the dynamics of N and of road salts in winter, which starts from November. But we
P fluxes from the low-lying urban polder of Geuzenveld to did not find any evidence for the prolonged effects of road
downstream surface waters in order to eventually support wa- salts, as the chloride concentrations in the grab samples only
ter managers to mitigate eutrophication. Based on our high- showed two higher measurements: one in December 2016
resolution water quality measurements, we found that the and one in January 2017 (see Fig. S2).
surface water chemistry at the polder outlet pumping station The mixing process can explain part of the dynamics of
is governed by a complex combination of hydrological mix- NH4 and TP in the wet season but is insufficient for ex-
ing and biogeochemical processing. In the following discus- plaining the dynamics during the dry season due to the
sion, we start with the presentation of the relatively straight- presence of biological and chemical processes. Compared
forward dilution behavior of EC, followed by adding the im- with groundwater, which carries around 8 mg L−1 NH4 and
pact of primary production (i.e., algae growth) for under- 1.6 mg L−1 TP, rain and runoff have much lower nutrient
standing the NH4 concentration patterns, and then benthic concentrations, which makes groundwater the main nutrients
primary producer and iron chemistry for understanding the source (Yu et al., 2019). Nutrients derived from groundwater
turbidity and TP concentration patterns. mix with rainwater in the ditches through direct seepage and
the efficient groundwater drainage systems. Clearly, NH4 is
4.1 Hydrological mixing between groundwater and diluted during the rain events and a gradual increase of NH4
rainfall starts after each rain event during the wet season, showing
slopes that resemble the model reconstruction. The overes-
In a highly manipulated low-lying urban catchment like timation of the modeled NH4 in general indicates a proba-
Geuzenveld, mixing between rainwater and groundwater in ble loss to transformation processes, especially in the spring
the ditches is fast due to the high fraction of impervious of 2017. Concentrations of TP are also generally far below
area and the installation of both a rainwater and a ground- the conservative model reconstruction. The distinct peaks up
water drainage system that transport these contrasting water to 3 mg L−1 are not captured by the model and must be de-
types efficiently to the ditches (Yu et al., 2019; Walsh et al., termined by different physical or chemical processes.
2005). Runoff in Geuzenveld has EC of about 166 µS cm−1
(Yu et al., 2019), which is lower than the groundwater EC 4.2 Primary production and nutrients
(1746 µS cm−1 on average). As a relatively conservative wa-
ter quality parameter (Fig. S2), mixing between rainwater NH4 dynamics during winter can be explained by mixing.
and groundwater should be the main process for EC. This However, biological processes are overruling the mixing pro-
presumption is supported by the agreement between the mod- cess during spring and summer. It resulted in lower measured
eled and the measured EC dynamics for the period between NH4 concentrations than modeled during this period. Stud-
May to November 2016. Precipitation events diluted the ies have shown that benthic and planktonic primary produc-
EC values at the pumping station, and the magnitude of dilu- ers (e.g., phytoplankton) assimilate nutrients and are an im-
tion depended on the intensity of precipitation; heavy rainfall portant factor controlling nutrient dynamics in rivers, lakes,
resulted in low EC values (Figs. 2d and 4). In periods with and streams (Hansson, 1988; Jäger et al., 2017). In polder
the absence of rainfall, the EC values follow a recovery curve Geuzenveld, the biological nutrient uptake is not only re-
that resembles a linearly mixed reservoir with concentrations flected in the time series data (Figs. 2 and 3, Table S3) but
increasing to values that approach the EC of the continuous is also evident in the monthly measurements from the water
groundwater supply of around 1500 µS cm−1 . After Novem- authority for the period 2007–2018, as summarized in Fig. 6
ber 2016, EC was underestimated by the model. The sud- and Tables S15–S19.
den increase of the measured EC around 20 November coin- The increasing availability of light (and temperature in-
cides with an intensive pumping event after the first intensive crease) during spring (Fig. S6) induces growth of primary
rainfall that happened after a prolonged period of cumula- producers. Growth of primary producers results in consump-
tive water deficit. This may be related with a first flush from tion of ammonium and phosphate and a production of or-
https://doi.org/10.5194/hess-25-69-2021 Hydrol. Earth Syst. Sci., 25, 69–87, 202180 L. Yu et al.: Drivers of nitrogen and phosphorus dynamics in a groundwater-fed urban catchment Figure 6. Monthly measurements of TN, NH4 -N, NO3 -N, chlorophyll a, O2 organic N/TN and NH4 -N/TN (NH4 /N) mass ratio, pH, water transparency, and suspended solids in Geuzenveld from 2007 to 2018. X axis is month. See Tables S15–S19 for the correlation tests performed on the dataset. ganic N, chlorophyll a, oxygen, and suspended solids, and As we stated above, nutrient-rich groundwater is the major this led to a relatively higher pH because of the uptake of source of N and P to surface waters in polder Geuzenveld. In CO2 (Fig. 6, Table S16). These patterns are also clearly re- addition, due to the shallow depth of the ditches, light reaches flected in the shift in the NH4 /TN and organic-N/TN ratios the bottom with the consequence that benthic algae can pro- during spring (Fig. 6). Primary production occurs both in the liferate in this polder. These benthic primary producers might water column by phytoplankton as well as by benthic algae. utilize the up-flowing nutrients from groundwater and inter- Macrophytes could in principle also contribute, but they were cept the nutrients from seeping further into the water column absent in Geuzenveld. One of the structuring factors govern- (Hansson, 1988; Pasternak et al., 2009). The increasing light ing the relative importance of benthic and planktonic primary availability and thus primary production during spring led to producers is light availability: benthic algae and macrophytes the nearly complete deprivation of NH4 in the water column tend to dominate in shallow and clear waters, while phyto- (Fig. 2c). plankton is more likely to dominate in deeper and more tur- Following the spring bloom, concentrations of chloro- bid waters (Hartwig, 1978; Jäger and Borchardt, 2018; Pe- phyll a (proxy for phytoplankton biomass) and O2 dropped tranich et al., 2018; Middelburg, 2019). Although our data substantially, while NH4 concentrations rapidly recovered to do not allow for conclusive determination of whether ben- around 4 mg L−1 in both the time series (Fig. 2c) and the thic or pelagic primary producers dominate, it appears that long-term monthly sampling results (Fig. 6). Dissolved O2 their relative importance varies with season. remained low (close to hypoxia) during the whole summer These primary producers also compete for nutrients. Ben- (below 2 mg L−1 ) (Figs. 2e and 6), indicating that oxygen thic primary producers have direct (macrophytes) or first consumption by organic matter degradation and reoxidation (benthic algae) access to nutrients that seep up from the sub- of reduced components from groundwater seepage outcom- surface, while planktonic primary producers depend on nu- peted oxygen production from primary production. During trient supply from surface runoff and nutrients remaining af- summer, suspended solid and chlorophyll a concentrations ter consumption by benthic primary producers. For example, were low (Fig. 6), indicating low biomass of plankton al- Henry and Fisher (2003) found that benthic algae can re- gae. Suspended solid and phytoplankton dominate light at- move up to 80 % of nitrogen from an upwelling water source. tenuation (Scheffer, 1998; Middelburg, 2019). Consequently, Hydrol. Earth Syst. Sci., 25, 69–87, 2021 https://doi.org/10.5194/hess-25-69-2021
L. Yu et al.: Drivers of nitrogen and phosphorus dynamics in a groundwater-fed urban catchment                                 81

during this period, we observed an abrupt shift of the water      Turbidity peaked first at 1800 FNU and stayed at a plateau
regime from a turbid state to completely clear, as reflected      of ∼ 200 FNU during the rest of the cold and wet season.
in the high transparency from June to September (Fig. 6).         Total Fe in the water column reached to 6 mg L−1 from be-
The low biomass of phytoplankton might be due to N limita-        low 1 mg L−1 . During this period the water turned brown-
tion as nutrients are intercepted by benthic algae at the sed-    ish and transparency declined (Fig. 6). Iron-rich particles are
iment interface. An alternative explanation is that zooplank-     the most likely source of turbidity in freshwater (Lyvén et
ton grazing maintained phytoplankton biomass at a low level       al., 2003; Gunnars et al., 2002; and Lofts et al., 2008). The
(Strayer et al., 2008; Genkai-Kato et al., 2012).                 suspension of these brownish iron colloids was likely stabi-
   Temperature and light reaching the sediment started to fall    lized by the presence of the dissolved organic matter (DOC)
from September onwards (Fig. S6) and thereby reducing the         (Mosley et al., 2003; van der Grift et al., 2014), which in-
intensity of biological activity, including NH4 assimilation.     creased up to 18–33 mg L−1 during events (Fig. S4). In the
Consequently, NH4 started to behave conservatively again          late autumn, the anoxic–oxic interface shifts from the sedi-
like EC (Figs. 2 and 3). The best fit between the modeled         ment into the water column and so does the locus of colloid
and measured NH4 was from the end of November to the be-          formation. The ditch sediment, which had benthic algae ac-
ginning of March, i.e., during the winter period with lower       tivity releasing O2 during spring and summer, became anoxic
light levels, shorter day lengths, and very low primary pro-      in the autumn by the upwelling of the anoxic groundwater.
duction. The absence of primary production during winter          The anoxic seepage occurs year-round, but the production of
leads to conservative behavior of NH4 governed by the mix-        oxygen by the benthic algae creates an anoxic–oxic transition
ing between groundwater and rain water.                           at the water–sediment interface, which leads to iron hydrox-
                                                                  ides precipitation in the slimy layer at the bottom that disap-
4.3   P binding and turbidity                                     pears after the algae die off. As a consequence, Fe oxidation
                                                                  moved into the water column where the conditions were rel-
Iron chemistry is considered the dominant process govern-         atively oxic (van der Grift et al., 2014). Nevertheless, there
ing the P dynamics in shallow groundwater-fed ditches (Lijk-      was probably still enough Fe or other mineral oxides, such as
lema, 1994; Smolders et al., 2006; Van der Grift et al., 2018).   aluminum hydroxide (Kopáček et al., 2005), binding capac-
However, primary producers take up P for growth and at the        ity in the sediment for the fixation of P, as P concentrations
same time release O2 that regulates iron chemistry in lake        remained low during this first turbidity peak. We suggest that
water column (Tables S1–S3, Spear et al., 2007; Zhang and         the turbidity peak of 1800 FNU is caused by the mineraliza-
Mei, 2015; Lu et al., 2016). This web of interactions likely      tion of the benthic algae once they die off when light and
controls P dynamics in these ditches.                             temperature conditions decrease, combined with the shift of
   From spring to autumn, TP concentrations were fluctuat-        iron hydroxide formation from the sediment–water interface
ing around 0.5 mg L−1 , and the water had low turbidity (
82 L. Yu et al.: Drivers of nitrogen and phosphorus dynamics in a groundwater-fed urban catchment
Figure 7. Schematic representation of N and P dynamics in spring, summer, later autumn and winter. The thickness of the flow lines
represents the concentration magnitudes, the thicker the line, the higher the concentrations.
catchment during the four seasons, which summarizes our 4.4.4 Winter
hypotheses about the functioning of the system.
During winter, NH4 and TP showed the highest concentra-
4.4.1 Spring tions because of low biological activity. Iron oxides in the
sediment dissolved under reductive, abundant organic matter
The improved light (and temperature) conditions stimulated conditions and released Fe2+ and P into the water column,
primary production and nutrient uptake (N, P, Si) by phy- increasing P concentrations therein. NH4 and EC dynamics
toplankton and benthic algae. The resulting oxygen produc- were primarily governed by the conservative mixing between
tion caused oxidation of reduced iron from groundwater and groundwater and precipitation and/or runoff.
the formation of iron oxides at the sediment surface. P was
mostly bounded to this particulate iron instead of being re- 4.5 Event-scale N and P dynamics
leased into the upper water layer. In this period turbidity was
relatively low, but suspended solids reached a high concen- At the event scales, NH4 and EC were reduced by dilu-
tration due to the phytoplankton. tion from precipitation and/or runoff. For P and turbidity,
there was no clear relation to precipitation events, except
4.4.2 Summer for events in late autumn and winter (e.g., Fig. 4, event 3).
The responses to precipitation and pumping events were dif-
N and P were still being removed by biological process- ferent from those reported in the literature. Rozemeijer et
ing, in particular by benthic algae. Phytoplankton biomass al. (2010b) studied an agricultural catchment and found that
decreased because of competition for N or grazing activity. rainfall events led to NO3 decreases and P increases. Miller
Benthic algae produced O2 , which in turn was used to oxidize et al. (2016) observed NO3 decreases during large discharges
all reduced iron reaching the sediment–water interface, and in an urban catchment. The lowering of turbidity in our ur-
P was still retained by iron hydroxides in the sediment. The ban catchment during the dilution periods that was associ-
water column was transparent (low TP and phytoplankton ated with the winter event 3 differs from the observations
biomass) and relatively low in oxygen due to the continuous in literature (van der Grift et al., 2014; Rozemeijer et al.,
supply of anoxic groundwater, the mere absence of O2 -rich 2010b). In agricultural areas, turbidity usually peaks in re-
runoff, the oxidation process of Fe(II), and possibly by mi- sponse to rainfall events due to erosion and remobilization of
crobial organic matter decomposition during warm periods sediments. In an urban, paved environment, erosion may be
with relatively stagnant water. limited and runoff water has a low turbidity. Moreover, in the
case of turbid pre-event conditions, fresh precipitation water
4.4.3 Late autumn flushes away this turbid water. In addition, Yu et al. (2019)
showed that precipitation runoff delivers particles and O2 to
Biological activity declined (colder and less light), and more
the ditches. We suggest that this accelerates the further ag-
NH4 reached the water column. Moreover, the redox zone
gregation of the iron complexes; the resulting larger parti-
moved from the sediment–water interface into the water col-
cles more readily settle to the bottom, causing a reduction of
umn (van der Grift et al., 2014, 2016); the oxidation of Fe
turbidity during the events itself (Fig. 4, EC dilution part of
in the water column caused a peak of turbidity. P was still
events 3 and 4).
sequestered to minerals in the sediment.
Hydrol. Earth Syst. Sci., 25, 69–87, 2021 https://doi.org/10.5194/hess-25-69-2021You can also read