Towards global monitoring: equating the Food Insecurity Experience Scale (FIES) and food insecurity scales in Latin America - arXiv.org
←
→
Page content transcription
If your browser does not render page correctly, please read the page content below
Towards global monitoring: equating the Food
                                            Insecurity Experience Scale (FIES) and food
                                                 insecurity scales in Latin America
arXiv:2102.10005v1 [stat.AP] 19 Feb 2021

                                                        Federica Onori, Sara Viviani and Pierpaolo Brutti

                                                                                   Abstract
                                                In order to face food insecurity as a global phenomenon, it is essential to rely on
                                            measurement tools that guarantee comparability across countries. Although the official
                                            indicators adopted by the United Nations in the context of the Sustainable Development
                                            Goals (SDGs) and based on the Food Insecurity Experience Scale (FIES) already embeds
                                            cross-country comparability, other experiential scales of food insecurity currently employ
                                            national thresholds and issues of comparability thus arise. In this work we address
                                            comparability of food insecurity experience-based scales by presenting two different
                                            studies. The first one involves the FIES and three national scales (ELCSA, EMSA
                                            and EBIA) currently included in national surveys in Guatemala, Ecuador, Mexico and
                                            Brazil. The second study concerns the adult and children versions of these national
                                            scales. Different methods from the equating practice of the educational testing field are
                                            explored: classical and based on the Item Response Theory (IRT).
1 Introduction
Food security is a subject of indisputable relevance, being it conceived as a basic human right
since 1948, as stated in Article 25 of the Universal Declaration of Human Rights: “Everyone
has the right to a standard of living adequate for the health and well-being of himself and of
his family, including food, clothing, housing and medical care” [2]. However, food security is
a complex and multifaceted concept whose terminology has long been affected by a variety
of sectors and disciplines strictly related to it (e.g. agriculture, nutrition, economy, public
policy, etc... ) [7, 23]. A consensus around the definition of food security was finally reached
during the World Food Summit in 1996 when it was formalized as follows: “Food security
exists when all people, at all times, have physical and economic access to sufficient, safe
and nutritious food that meets their dietary needs and food preferences for an active and
healthy life" [17].1 Grounding on this definition, the conceptualization and operationalization
of food security emerge as that of a multidimensional phenomenon made up of four different,
hierarchically ordered dimensions: availability, access, utilization and stability [6, 29]. As a
consequence, no single indicator can be successfully designated to return a thorough picture
of the phenomenon, but a suite of indicators exists, each monitoring specific aspects of food
security at different levels of the observation: national, regional, households and individual
[23]. Among all possible aspects related to food insecurity, the dimension of access to food is
given nowadays high-priority, being acknowledged among the 17 Sustainable Development
Goals (SDGs) of the 2030 Agenda for Sustainable Development adopted by the United
Nations. Access to food is in fact the subject of Target 2.1 [28], which states:
By 2030, end hunger and ensure access by all people, in particular the poor and
people in vulnerable situations, including infants, to safe, nutritious and sufficient
food all year round.
Although food security is now a well-established concept within the scientific community,
its definition changed throughout the last century and so did the tools employed to measure
the phenomenon [7, 23]. A brief summary of the main steps will enable to fully appreciate
the novelties brought about by the measurement tools developed since the ’80s. During
the 1940s and for some decades on, the issue of food security was completely identified
with that of having enough provisions to cover the needs of the population and, therefore
the “food problem" was mainly dealt with in terms of country-level supplies [14, 15, 16].
Nevertheless, this formulation could not catch the aspect, yet observable, of malnutrition and
famines in countries that did not suffer from food supply at national level [9], signal that a
1
This definition was further refined in 2002 [18], when food access was not only conceived in terms of
affordability and physical access, but also in terms of removal of social barriers. The community of researchers,
practitioners and political decision makers currently agree upon the following definition:
Food security exists when all people, at all times, have physical, social and economic access to
sufficient, safe and nutritious food that meets their dietary needs and food preferences for an
active and healthy life.
1change in approaching the measurement of food insecurity was required, in particular towards
considering the point of view of people’s access to food. To mark this change in prospective,
the expression household food insecurity began to be used. Since then, other shifts pertained
to the definition of food insecurity as for what we use today. A very fundamental one
was in the 1990s when interest moved from dietary energy adequacy to experience of food
insecurity and livelihood conditions, which involved, among others, also social, nutrition and
psychological considerations. Food insecurity has in fact been recognized as a “managed
process", described by means of a spectrum of behaviours and coping strategies that can
reveal the level of severity of a food access condition [30]. Although specific attitudes and
coping strategies might change from country to country, there is a general consensus in
the scientific community about the common pattern of behaviours that characterize food
insecurity with very minor differences across cultures [11]. To this regard, ethnographic and
societal studies established that, in case of increasing lack of money or other resources, a
common pattern of experiences and behaviours manifests in order to cope with shortage
of food [30]: at first, psychological concern arises since people start worrying about having
enough food; then, a change in the diet occurs by decreasing the quality and variety of the
consumed food in order to face a concrete limited access to food; and, in case of more severe
food shortages, people would diminish the quantity of consumed food by reducing meals’
size and then by even skipping meals, potentially up to experiencing hunger. The steps just
described are commonly referred to as the three domains of resource-constrained access to
food: psychological concern, decrease of food quality, decrease of food quantity and hunger 2 .
Mirroring these shifts in the paradigm (from global and national to households and indi-
viduals; from food supplies to livelihood conditions; and from objective to subjective measures
[7]), a number of indicators have been proposed to measure food insecurity, like measures of
adequacy of food consumption, prevalence of undernourishment, dietary diversity score, etc...
Among all, experience-based food insecurity scales found a place of relevance, having proved to
be a valid and reliable tool for measuring food insecurity in its access dimension, encompassing
the current definition of the phenomenon while adopting a behavioural perspective [7]. As
the name suggests, experience-based food insecurity scales measure access to food from a
behavioural perspective, building on a set of items that directly ask people about their own
personal experiences and behaviours related to the three domains of access to food [23]. The
very first experience-based food insecurity scale was the Household Food Security Survey
Module (HFSSM), applied yearly in the United States of America since 1995 for monitoring
purposes [22]. As a matter of fact, the HFSSM pioneered in this field and several countries in
Latin America followed this example by developing their own national scales to be included
in national surveys for periodical monitoring. In 2004, Brazil included the Brazilian Scale
of Food Insecurity (EBIA) into national Brazilian surveys; Haiti, Guatemala and Ecuador,
2
The aim of this first part of the work was mainly to provide a general framework for the topic and
clarify that the expression “food insecurity” technically refers to a multitude of aspects that relate to different
dimensions. However, in order to avoid confusion and enable an agile treatise of the subject, hereafter “food
insecurity” will specifically be meant at the individual or household level and interpreted as the set of the
restrictions in accessing food due to limited resources (or, equivalently, resources-constrained access to food ).
This choice will also facilitate conceiving food insecurity as a measurable construct.
2among other countries, developed the Latin American and Caribbean Food Security Scale
(Escala Latinoamericana y Caribeña de Seguridad Alimentaria - ELCSA); and in 2008 Mexico
developed its adaptation of the ELCSA, called Mexican Food Security Scale (EMSA). Peculiar
to these scales is the availability of two different survey modules, one for households with
children and one for households without children and made up of a different number of
items. Finally, beside these country-specific applications of the experience-based approach
to measuring food insecurity, in 2013 the Food and Agriculture Organization of the United
Nations (FAO) launched the Voices of the Hungry project (VoH) and developed the Food
Insecurity Experience Scale (FIES) conceived as a global adaptation of HFSSM and ELCSA
[19]. The FIES is based on people’s responses to only 8 dichotomous items and, by means
of an ad-hoc methodology that grounds on the Item Response Theory (IRT), and more
specifically on the Rasch model, it is the first food insecurity measurement system based on
experiences that generates formally comparable measures of food insecurity across countries.
As such, it is one of the official measurement tool for monitoring progresses toward Target
2.1 of the SDGs, being the scale used to compute the related Indicator 2.1.1, (Prevalence of
food insecurity at moderate and severe levels based on FIES ) [3, 4, 19].
Although the national and regional scales proved to be adequate tools for measuring and
monitoring access to food within each country [10, 34], the need for a global monitoring,
such as that sought in the context of the SDGs, raised the issue of comparing results from
applications of different scales in different countries [6]. In fact, despite sharing a common
evolution, each national scale uses specific thresholds to measure prevalences of food insecurity
for nominally the same level of severity. Moreover, comparability issues also arises in the
context of each national/regional scale, when considering the adult and the children-referenced
versions of the same scale. This work aims at filling this gap by addressing comparability issues
in the context of the experience-based food insecurity scales within a statistical framework.
Specifically, methods and techniques from the statistical field of the educational testing are
applied, with the goal of computing thresholds on the different scales that can be considered as
“equivalent". Both classical and Item Response Theory (IRT)-based techniques are employed
and two different comparability studies are presented:
1. Comparison between the FIES and national food insecurity scales in use in some countries in
Latin America. Equating analyses are conducted between FIES and ELCSA in Guatemala;
FIES and ELCSA in Ecuador; FIES and EMSA in Mexico; and between FIES and EBIA
in Brazil.
2. Comparison between household and children-referenced scales within each national context.
This analysis is conducted for ELCSA in Guatemala, ELCSA in Ecuador, EMSA in Mexico
and EBIA in Brazil.
Data used for the analysis were collected by the single countries and are available for
downloading on the internet at the websites of the Statistical National Institutes of Guatemala,
Ecuador, Mexico and Brazil. Implementation of the equating methods was performed on the
free software R (http://www.r-project.org) using, among others, the packages RM.weights
[8], equate [1] and plink [35]. The remaining of the paper is organized as follows: Section 2
3describes more in depth the features of the experience-based food insecurity scale; Section 3
presents the data and Section 4 is devoted to describe the pillars and the methods of the Test
Equating; Section 5 presents the main results; and Section 6 concludes with some remarks
and possible directions for future works.
2 Experience-based food insecurity scale
As already mentioned, the FIES is strongly based on the ELCSA, which in turn represents
a common ancestor for other scales in use in Latin America (EMSA, EBIA, etc...). As a
consequence, all these scales largely share the same cognitive content of the items, which
constitutes the promising ground on which addressing comparability. Nevertheless, the FIES
and the national scales show important differences. First of all, national scales measure
food insecurity at the household level, while the FIES produces national measures of food
insecurity at the individual level. Secondly, national scales have a reference period of 3
months, while the FIES refers to the 12 months previous to the interview. Thirdly, and
perhaps most importantly, national scales compute prevalences of food insecurity following a
deterministic methodology based on raw scores (number of affirmative responses) and use
discrete thresholds (expressed in terms of raw scores) for computing prevalences of food
insecurity at different levels of severity. On the other hand, VoH methodology for the FIES
is probabilistic in nature in that it fits the Rasch model to the data, models access to food
by means of a probabilistic distribution and computes prevalences of food insecurity using
thresholds on the continuum latent trait.
2.1 National and Regional Scales of Food Insecurity: ELCSA,
EMSA, EBIA
The survey modules on which ELCSA, EMSA and EBIA are built have strong similarities
[10, 34]. They all account for the three domains of the access dimension of food insecurity
discussed in the previous section, aim at measuring food insecurity at the household level
and all adopt the same reference period of 3 months previous to the day of the module
administration. As far as the methodology is concerned, ELCSA, EMSA and EBIA agree on
a similar procedure that can be summarized in few steps [10, 34]:
1. Computation of a raw score for each household: by counting the number of items affirmed
by that household. Raw scores represent an ordinal measure of food insecurity: the highest
the raw score, the more severe the level of food insecurity.
2. Computation of prevalences of food insecurity at three levels of severity: mild, moderate
and severe. Prevalences are computed as percentages of households in the sample that
scored within a certain range expressed in terms of raw scores and with different thresholds
depending on whether children live in the household or not (Table 1).
3. Data validation. Homogeneity of the items comprising the scale is assessed by fitting the
Rasch model to the data.
4Moreover, each national scale makes use of two different versions of the survey module,
distinguishing between households with children (i.e. people under the age of 18 years) and
households without children. The first group of survey modules is usually made up of 6 to 9
household-referenced items and, for the sake of simplicity, the scale obtained from this set
of items will be referred to, in this work, as the Adult scale. The second one integrates the
first one by adding from 6 to 7 extra children-referenced questions and the scale obtained
from this set of items will be referred to as the Children scale. The two survey modules thus
encompass a different number of items and, from each of them, a scale is built that uses
different thresholds to compute prevalences of food insecurity that should be meant to reflect
the same level of severity. Prevalences derived from the two scales are then considered jointly
in order to derive national prevalences of food insecurity.
Scale Food insecurity Households Households
Level without children with children
mild 1 to 3 1 to 5
ELCSA moderate 4 to 6 6 to 10
severe 7 to 8 11 to 15
mild 1 to 2 1 to 3
EMSA moderate 3 to 4 4 to 7
severe 5 to 6 8 to 12
mild 1 to 3 1 to 5
EBIA moderate 4 to 6 6 to 10
severe 7 to 8 11 to 15
Table 1: Classifications of food insecurity using national scales (ELCSA, EMSA and EBIA) and
corresponding ranges of the raw scores for households with and without children.
It is worth highlighting that, as reported in Table 1, the thresholds used to compute
categories of food insecurity that nominally reflect the same level of severity (mild, moderate
or severe), are country (or regional)-specific. As a matter of fact, these thresholds were not
chosen in order to assure comparability among countries (no matter how geographically close
to each other they might be) nor in light of clear statistical properties, but according to
opinions of experts from the nutrition and social sciences fields. The same consideration
holds for the thresholds chosen for the household referenced-scale and the children-referenced
scale within each national context. As a consequence, there is no clear guarantee that, for
example, a raw score of 7 truly reflects the same level of severity in Mexico and Brazil, or
that, applying ELCSA in Guatemala, 7 and 11 can be considered as equivalent scores in
households without and with children, respectively.
2.2 The Food Insecurity Experience Scale (FIES)
Inspired by Target 2.1 of the SDGs, the Voices of the Hungry (VoH) project of the Food and
Agriculture Organization developed the Food Insecurity Experience Scale (FIES), designed
5to have cross-cultural equivalence and validity in both developing and developed countries,
aiming at producing comparable prevalences of food insecurity at various levels of severity
[19]. As reported in Table 2, the FIES Survey Module is made up of 8 dichotomous items
accounting for the three domains of access to food. Since 2014, the FIES Survey Module
(FIES-SM) is part of the Gallup World Poll (GWP) Survey, from Gallup Inc. [33], a survey
that is repeated every year in over 150 countries and administered to a sample of adult
individuals (aged 15 or more) representative of the national population. This has practically
allowed to reach countries that do not have a national measurement system for food insecurity,
yet. In accordance with the characteristics of the GWP, the version of the FIES-SM here
considered refers to a period of 12 months prior to the survey administration and investigates
food insecurity at the level of adult individuals (people aged older than 15 years), which
represents a first difference between FIES and the national scales.
Items Abbreviations
During the last 12 months, was there a time when,
because of lack of money or other resources:
1. You were worried you would not have enough food to eat? WORRIED
2. You were unable to eat healthy and nutritious food? HEALTY
3. You ate only a few kinds of foods? FEWFOOD
4. You had to skip a meal? SKIPMEAL
5. You ate less than you thought you should? ATELESS
6. Your household ran out of food? RUNOUT
7. You were hungry but did not eat? HUNGRY
8. You went without eating for a whole day? WHLDAY
Table 2: FIES Survey Module (FIES-SM) for individuals and with a reference period of 12 months.
However, the main difference between the two is in the methodology used [19]. The Voh
methodology developed for the FIES employs a probabilistic model not only as a validation
tool (for assessing homogeneity of the items in the scale), but also for computing measurements
of food insecurity. In fact, food insecurity is treated as a latent trait whose measurement is
achieved by means of some “observables" (the items’ answers) and a probabilistic model that
links the two. The Rasch model (also known as the one-parameter logistic model or 1PL
model) is one of the most simple model that can serve this purpose while, at the same time,
assuring a set of favourable measurement properties [20, 31]. It was proposed in the context
of educational testing, where the purpose is generally to score students based on a set of
questions (items) and, according to this model, the probability of a respondent to correctly
answering the j−th item is modelled as a logistic function of the distance between two
parameters, one representing the item’s severity (bj ) and one representing the respondent’s
6ability (θ):
exp(θ − bj )
Pj (θ) = P (Xj = 1|θ; bj ) = . (1)
1 + exp(θ − bj )
The Rasch model provides a sound statistical framework to assess the suitability of a
set of items for scale construction and comparing performance of scales. Basic assumptions
are unidimensionality, local independence, monotonicity, equal discriminating power of the
items and logistic shape of the Item Response Functions (IRFs). Moreover, it has several
interesting properties for which it earned its success among social science measurement models,
like sufficiency of the raw score, independence between items and examinees’ parameters,
and invariance property [21]. In the context of food insecurity, the item’s severity can be
interpreted as the severity of the restrictions in food access represented by each item while the
ability parameters are to be meant as the overall severity of the restrictions in accessing food
that the respondent had to face (in light of her answers to the items in the survey module).
From the point of view of the Stevenson’s classification of scales [32], this way of measuring
food insecurity guarantees the construction of an interval scale as opposed to the ordinal
scale obtained from the methodology employed, for instance, for ELCSA, EMSA and EBIA
and named deterministic as opposed to the probabilistic developed for the FIES. Moreover,
prevalences obtained by means of the FIES are guaranteed to be comparable across countries,
thanks to the implementation of an equating step for which estimates of the model parameters
obtained in a single application of the scale are adjusted on the FIES Global Standard scale,
a set of item parameters serving as a reference metric and based on application of the FIES
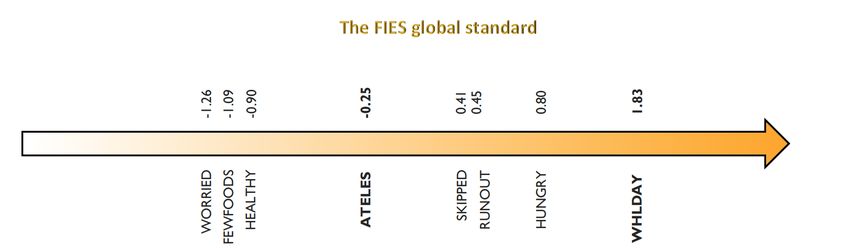
in all countries that were covered by the GWP survey in 2014, 2015 and 2016 [19] (Fig. 1).
Finally, each respondent is assigned a probabilistic distribution of his/her food insecurity
along the latent trait, depending on his/her raw score. This distribution is Gaussian with
mean equal to the adjusted (to the Global Standard) respondent parameter and standard
deviation equal to the adjusted measurement error for that raw score. As a last step, this
mixture of distributions is used to compute the percentage of population whose severity
is beyond a fixed threshold on the latent trait, calculated as a weighted sum across raw
scores, with weights reflecting the proportions of raw scores in the sample (Figure 2). While
theoretically it is possible to compute percentages of population beyond each and every value
on the continuum, the VoH methodology suggests the computation of two prevalence rates
corresponding to choosing thresholds on the Global Standard metric set at the severity of
items ATELESS (−0.25) and WHLDAY (1.83) (Fig. 1). The resulted indicators of food
insecurity take the name of Prevalence of Experienced Food Insecurity at moderate or severe
levels (F IM od+Sev ) and Prevalence of Experienced Food Insecurity at severe levels (F ISev ),
respectively. However, in order for these quantities to be valid and reliable measurements
of food insecurity, a validation step must be undertaken in each and every application of
the scale. This is commonly performed by computing goodness-of-fit statistics of the Rasch
model (e.g. Infit, Outfit and Rasch reliability statistics) that assess the good behaviour of
the items and by performing a Principal Component Analysis (PCA) on the residuals to
investigate the existence of a second latent trait. For more details on the usage of the Rasch
model as a measuring tool for food insecurity we refer the reader to [27], while for more
7insights in the VoH methodology for the FIES we refer to [19].
Figure 1: The FIES Global Standard.
Figure 2: Distributions of severity of food insecurity among respondents according to their raw
scores
83 Data
Data referred to Guatemala were collected in the Encuesta Nacional de Condiciones de
Vida (ENCOVI) conducted by the Instituto Nacional de Estadística (INE) in 2014 and the
sample used included 11433 households. Data referred to Ecuador were collected in the
Encuesta Nacional de Empleo y Desempleo (ENCOVI) conducted by the Instituto Nacional
de Estadísticas y Censos (INEC) in 2016 and the sample used included 16716 households.
Data referring to Mexico were collected in the Encuesta Nacional de Ingresos y Gastos de los
Hogares (ENIGH) conducted by the Instituto Nacional de Geografia e Estatística in 2014 and
the sample used included 19479 households. Data referring to Brazil were collected in the
Pesquisa Nacional de Amostra de Domicílios (PNAD) conducted by the Instituto Nacional
de Geografia e Estatística (IBGE) in 2013 and the sample used included 116543 households.
All samples were representative of the corresponding national populations.
4 Test Equating
Scores deriving from tests usually have an important role in the decision making process
that brings to excluding some candidates for a job or scholarship position, or adopting
specific public policy strategies in order to take action on a public relevant issue. Evidently,
this requires that tests to be administered in multiple occasions, as it is the case for the
admission college tests that are held in specific test dates during the year. Therefore, a crucial
consideration arises: if the same questions were included in the tests, students that already
took the test would have an advantage and the test would rather measure the degree of
exposure of students to past tests than their ability on some specific subject. At the same time,
it is important that all students take the “same" test, in order to fairly compare performances
and make decisions accordingly. This issue is commonly addressed by administering on every
test date a different version of the same test, called test form, that is built according to certain
content and statistical test specifications. Nonetheless, minor differences might still occur
among different test forms, one resulting slightly more difficult than the others. Therefore,
in order to evenly score students that took multiple test forms and establish if a poorer
performance is due to a less skillful respondent and not to a more difficult test, a procedure is
needed to make tests comparable. This procedure is called equating and it is formally defined
as the statistical process that is used to adjust for differences in difficulty between tests
forms built to be similar in content and difficulty, so that scores can be used interchangeably
[13, 24]. Every test equating should meet some fundamental equating requirements and needs
the specification of both a data collection design and of one or more methods to estimate an
equating function. All these aspects will be discussed in the remaining of this section.
4.1 Equating Requirements
Equating scores on two test forms X and Y must meet some requirements that assure that the
equating to be meaningful and useful (i.e. equated scores can be used interchangeably). The
following five requirements are globally considered of primary importance for an equating to
9be run, although they would better be considered as general guidelines than easily verifiable
conditions:
• Equal Construct Requirement Tests that measure different constructs should not
be equated.
• Equal Reliability Requirement Tests that measure the same construct but differ
in reliability should not be equated.
• Symmetry Requirement Equating function that equate scores on X to scores on Y
should be the inverse of the equating function that equate scores on Y to scores on X.
• Equity Requirement For the examinee should be a matter of indifference which test
will be used.
• Population Invariance Requirement Equating function used to equate scores on
X and scores on Y should be population invariant in that the choice of a specific
sub-population used to compute the equating function should not matter.
It might be the case that the two tests to be equated do not satisfy all five requirements.
For example, they could differ in length and statistical specifications, with consequences on
the “Equal Reliability requirement” and “Equity requirement”. In fact, a longer test would
be in general more reliable and, if a poorly skillful examinee had to be scored, he or she
would have more chance to score higher if administered the shortest test. The aforementioned
requirements assure that scores derived from tests that do meet all of them can be used
interchangeably while, if they do not all strictly hold, the exercise would rather be addressed
as a weaker analysis of comparability named linking [13, 24].
4.2 Equating designs
There are basically two ways in which data collection designs can account for differences
in the difficulty of two or more test forms in test equating, namely either by the use of
“common examinees" or the use of “common items" [13, 24]. In the first case the same group
of examinees (or two random samples of examinees from the same target population) take
both tests. In this case, any difference in the scores is attributable to differences in the test
forms. Examples of this category are the “Single-Group" (SG) and the “Equivalent-Groups"
(EG) designs. In the second case, a set A of common items called anchor test is included in
both test forms in order to account for such differences. Therefore, any difference between
scores on the anchor test is due to differences among examinees. Data designs that use this
method are called “Non-Equivalent groups with Anchor Test" (NEAT) designs.
4.3 Equating Methods
Several equating methods have been proposed and applied to equate observed scores on
equatable tests. In this section an overview of the most common and popular methods
10is provided, starting from the observed-score methods of mean, linear and equipercentile
equating and ending up with the true score equating in the context of IRT. All these methods
have been implemented for the two comparability studies between experience-based food
insecurity scales that are presented in this work.
4.3.1 Observed-score equating methods
Let X and Y be two tests (or two forms of the same test) scored correct/incorrect (1/0).
Scores on test X and Y will be denoted as random variables X and Y with possible values,
respectively xk , (k = 0, . . . , K) and yl (for l = 0, . . . , L), where K and L are the lengths of
tests X and Y , respectively. We denote the score probabilities of X and Y by
rk = P (X = xk ) and sl = P (Y = yl ). (2)
The cdfs of X and Y are denoted by
F (x) = P (X ≤ x) and G(x) = P (Y ≤ y) (3)
and the moments are, respectively
µX = E(X), µY = E(Y) (4)
and
σX = SD(X), σY = SD(Y) (5)
Mean equating In mean equating, test form X is assumed to differ from test form Y by
a constant amount along the scale. For example, if form X is 2 points easier than form Y for
low-ranking examinees, the same will hold for high-ranking examinees. In mean equating,
two scores on different forms are considered equivalent (and set equal) if they are the same
(signed) distance from their respective means, that is
x − µX = y − µY . (6)
Then, solving for y, the score on test Y that is equivalent to a score x on test X, and called
mY (x), is
mY (x) = y = x − µX + µY . (7)
Clearly, mean equating allows for the means to differ in the two test forms.
Linear equating In linear equating, difference in difficulty between the two tests is not
constraint to remain constant but can vary along the score scale. In this equating method,
scores are considered equivalent and set equal if they are an equal (signed) distance from their
means in standard deviation units, that is the two standardized deviation scores (z-scores)
on the two forms are set equal
x − µX y − µY
= (8)
σX σY
11from which the score on test Y equivalent to a score x on test X, and that is called lY (x), is
σY σY
lY (x) = y = x + µY − µX . (9)
σX σX
where σσXY can be recognized as the slope and µY − σσXY µX as the the intercept of the linear
equating transformation. Linear equating allows for both means and scale units to differ in
the two test forms.
Equipercentile equating In the equipercentile equating method a curve is used to describe
differences between scores in the two forms. Basic criterion for the equipercentile equating
transformation is that the distribution of the scores on Form X converted to the Form Y
scale is equal to the distribution of scores on Form Y . Scores on the two forms are considered
-and set- equivalent if they have the same percentile rank. We adopt here the definition
of equipercentile equating function given by Braun and Holland in [5]. Let’s consider the
random variables X and Y representing the scores on forms X and Y and F and G their
cumulative distribution functions. We call eY the symmetric equating function converting
Form X scores into scores on Form Y scale and G? the cumulative distribution function of
eY (X), that is the cdf of the scores on Form X converted to the Form Y scale. Function eY
is the equipercentile equating function if G? = G. According to the definition of Braun and
Holland, if X and Y are continuous random variables, then
eY (x) = G−1 [F (x)], (10)
is an equipercentile equating function, where G−1 is the inverse of G. This definition meets
the “Symmetric requirement” and, given a Form X score, its equivalent on the Form Y scale
is defined as the score having the same percentage of examinees at or below it.
4.3.2 IRT-based equating methods: the IRT-True Score equating (IRT-TS)
Equating different forms of the same test using the IRT-True Score equating (IRT-TS) is a
three steps process [12]:
1. Estimation: Fit an IRT-model to the data for both tests.
This step consists in assessing goodness-of-fit of a specific IRT model and estimating item
parameters for both forms. In the case of the Rasch model, in light of the sufficient statistics
property, estimates of the item severities do not depend on the group of examinees and
therefore the IRT-TS based on the Rasch model can be claimed to meet the “Population
Invariance requirement", since it produces results that are sample-independent.
2. Linking: Put parameters’ estimate on a common metric through a linear transformation
based on a set A of common items.
In this second step, a linear transformation is used to bring parameter estimates to a
common IRT scale. In fact, "if an IRT model fits the data, then any linear transformation
12of the θ-scale also fits the data, provided that the item parameters are transformed as
well" [24]. Let consider Form X made up of J dichotomously scored items administered
to N examinees and let consider the Rasch model to fit the data. Then, if P and Q are
Rasch scales that differ by a linear transformation, the item severities bj , j ∈ {1, . . . , J}
are related as follows
bjQ = AbjP + B, j ∈ {1, . . . , J}
and the same relationship holds for the ability parameters. A useful way to express the
constants A and B is through the mean and standard deviation of the item parameters in
both scales
σ(bQ )
A= , B = µ(bQ ) − Aµ(bP ).
σ(bP )
In equating two different forms of the same test with a set of common items administered to
non-equivalent groups, it is possible to exploit this linear relationship through the so called
Mean/Sigma transformation method [26], which uses means and standard deviations of
item parameter’s estimates of only those items in the anchor test. More specifically, given
Form X and Form Y with a set A of common items, estimates of the difficulty parameters
for items in the set A in the two calibrations are linked via a linear transformation and
used to compute the coefficients A and B of this transformation. Once the transformation
is estimated, it can be applied to transform the ability parameters on one Form to the
corresponding parameters on the other Form, thus enabling comparability between the
two Forms.
3. Equating: Get equivalent expected raw scores through the Test Characteristic Curves of
the two tests (TCC).
Once the metrics of the two Forms are put on the same scale (that can be either the scale
of one of them or a third scale) it is finally possible to compare performance of examinees
taking the two Forms. However, as it often happens with standardized tests, reported
scores could be expressed in terms of raw scores and, if this is the case, a further step
is needed. Within the framework of IRT, it is possible to mathematically relate ability
estimates to specific true scores on each test form. The IRT- True Score equating method
computes equivalent true scores in the two forms and considers them, as it is common in
the practice of equating, as equivalent observed scores [25]. Given Form X and Form Y
two test forms measuring the same ability θ with respectively nX and nY items and given
both item and ability estimates are on the same scale through a linear transformation, the
estimated true scores on the two forms are related to θ by the so called Test Characteristic
Curve as follows nX nY
X X
TX = P̂j (θ), TY = P̂i (θ)
j=1 i=1
where TX (respectively TY ) is the estimated true score for Test X (Y ) and P̂i (θ) (P̂j (θ)) is
the estimated probability function for item j (i) (Fig. 3). Through the Test Characteristic
Curve, an ability θ can thus be transformed into an estimated true score on the test form
13and, provided ability parameters on the two forms are put on the same metric, true scores
corresponding to the same θ are considered equivalent.
Figure 3: Test Characteristic Curve (TCC) referred to a test of three items (left) and a pictorial
description of the IRT-True Score (IRT-TS) equating method (right).
5 Results
As a preliminary step to both equating studies, the Rasch model has been fitted to all eight
datasets (an Adult scale and a Children scale in the four countries), and a validation step was
performed to confirm the good behaviour of the scale. In all eight applications it was possible
to observe an overall good fit of the model. Assumptions of equal discrimination of the items
was certainly met, thanks to item Infit statistics entirely in the range of (0.7, 1.3), confirming
the strength and consistency of the association of each item with the underlying latent trait
(compare [19, 27]). Moreover, Outfit statistics were never as high as to warn misbehaviour
due to highly unexpected response patterns, assessing the good performance of the items.
Assumptions of conditional independence and unidimensionality of the items were assessed
through computation of conditional correlations among each pair of items and submission of
the correlation matrix to principal component factor analysis (PCA). All pairwise residual
correlation were, in absolute value, smaller than 0.4 thus confirming that all correlations
among items result from their common association with the latent trait. PCA performed on
the matrix of residual correlations showed the presence of only one main dimension that, due
to the cognitive content of the items, can thus be recognized as the food access dimension
that the scales aim at measuring. Finally, overall model fit is assessed by Rasch reliability
statistics (proportion of total variation in true severity in the sample that is accounted for by
the model), ranging between 0.65 (Mexico) and 0.79 (Guatemala) for the Adult scale and
14between 0.80 (Mexico) and 0.86 (Guatemala) for the Children scale, confirming a good overall
discriminatory power for all scales. Sporadic departures from this irreproachable behaviour
could only be attested for one or two items in the Children scale (like a residual correlation
of 0.6 between two item of the ELCSA in Guatemala) that however never compromised the
good performance of the overall scale.
5.1 First Study: Equating FIES and National Scales
The aim of this comparability study is to find raw scores on the national scales EBIA, EMSA
and ELCSA that can be considered equivalent to the continuum FIES global thresholds
used to compute the two indicators F IM od+Sev and F ISev , namely −0.25 and 1.83. However,
it is worth noticing that, since VoH methodology uses thresholds on the continuum while
national scales methodology uses discrete thresholds, the equivalent raw score will almost
never exactly produce the same prevalence obtained with the VoH thresholds.
As it is currently set up and implemented, the FIES Module refers to adults (people
aged 15 or above). Therefore, in order to meet the “Equal Construct requirement”, the
modules of the national scales administered to households without children have here been
considered. Technically, the FIES Survey Module and the survey modules of the national
scales (households without children) will thus serve the role of test forms of the same test
that are to be equated. This was ultimately made possible in light of the common history
that brought to the development of these scales (i.e. FIES, ELCSA, EMSA, EBIA), which
assures that, despite some differences such as the level of the measurement and the reference
time (see Section 2), the survey modules used to collect data have very strong similarities
and share the same dichotomous structure (possible answers are “Yes/No”).
This first study was carried out by implementing the following methods:
1. IRT True Score (IRT-TS) equating.
2. Linking via a linear transformation applied to ability parameters.
3. Minimization of the difference between prevalences of food insecurity.
The IRT-TS equating method was implemented in the context of the NEAT equating
design. In this work, the set A of common items was computed according to an iterative
procedure that starts with all items considered as in common (apart from the ones classified
as unique a priori ) and then discards one item at a time beginning from the one that exceeds
the tolerance threshold of 0.5 the most. Algorithm ends when a set A of items all within this
threshold is found. Item WHLDAY was considered as unique a priori in all four equating
analyses due to its different cognitive content in the considered scales: more severe in the
FIES since it refers to “not eating for a whole day”, and less severe in the national scales where
it reports on members of the household that either only ate once or went without eating for a
whole day. The Standard Error of Equating (SEE) for the IRT True-Score equating method
was estimated using 1000 bootstrap replications [24]. The second and third methods can be
considered as either variations of the IRT-TS or techniques that might sound particularly
15reasonable in the present context. They were explored for investigation purposes and the
obtained scores won’t be claimed to be “equivalent", but rather “corresponding" scores. In
fact, the second method (Linking) consists in considering the linear transformation obtained
in the second step of the IRT-TS method and applying it to the estimated ability parameters
of the Rasch model. Once ability parameters are adjusted to the Global Standard metric, the
raw score corresponding to the ability parameters that are closer to the two VoH thresholds
are considered as corresponding raw score. On the other hand, the third method (Minimizing)
consists in computing prevalences of food insecurity at the household level applying the
FIES methodology to the data used for the national scales and comparing the prevalences so
obtained with the percentages of population scoring from a certain raw score on. The two
raw scores that realize the minimum distance with the two VoH global thresholds (in terms
of prevalences) are considered as the corresponding raw scores in accordance to this method.
Results from the first comparability study are summarized in Table 3 and Table 4, which
report the raw scores on the national scales that are computed equivalent to the VoH global
thresholds used for the indicators F IM od+Sev and F ISev , respectively. Table 3 shows that the
threshold used for computing F IM od+Sev and corresponding to the severity of item ATELESS
on the Global Standard metric (i.e. −0.25) might reflect a less severe condition of food
insecurity compared to the one measured by the national scales for the moderate category of
food insecurity. In fact, all the equated raw scores are either equal to or around one point less
than the thresholds currently used by ELCSA, EMSA and EBIA for this category of food
insecurity. On the contrary, the threshold used for F ISev and corresponding to the severity
of item WHLDAY on the Global Standard metric (i.e. 1.83) generally reflects a more severe
condition of food insecurity than the one captured by the national scales for the severe level
of food insecurity, Table 4 reporting equated raw scores that are either equal to or one point
higher than the national thresholds currently in use for this category.
Food Insecurity Internal IRT-TS Linking Min. Diff.
Scales Monitoring Rasch (SEE)
ELCSA (Guatemala) 4 3.3 (0.19) 3 4
ELCSA (Ecuador) 4 4.2 (0.14) 4 4
EMSA (Mexico) 3 2.0 (0.23) 2 2
EBIA (Brazil) 4 4.0 (0.09) 4 5
Table 3: Equated Raw Scores on the national scales corresponding to the VoH threshold for
F IM od+Sev (−0.25 on the Global Standard).
5.2 Second Study: Comparing Household- and Children-referenced
item scales
This second analysis aims at comparing the Adult and Children scales within each national
context. To this purpose, we implemented the Single Group (SG) data collection design by
considering the scores obtained by the households with children on both survey modules
16Food Insecurity Internal IRT-TS Linking Min. Diff.
Scales Monitoring Rasch (SEE)
ELCSA (Guatemala) 7 7.8 (0.18) 8 8
ELCSA (Ecuador) 7 7.1 (0.18) 7 8
EMSA (Mexico) 5 6.0 (0.26) 6 6
EBIA (Brazil) 6 7.9 (0.07) 8 8
Table 4: Equated Raw Scores on the national scales corresponding to the VoH threshold for F ISev
(1.83 on the Global Standard).
(the one containing only adult and household-referenced questions and the one containing
also children-referenced questions). This equating design is usually not easily implemented,
since it requires the same group of respondents to be administered two different forms of the
same test, resulting in an expensive and time-consuming procedure. However, we here could
exploit the fact that the survey module for the Children scale is simply an extended version
of the module for the Adult scale (see Section 2) and as such, we can “imagine” to administer
the adult referenced survey to households with children just by dropping children-referenced
items. With regards to the equating requirements (see Section 4.1), it is worth noticing
that the two survey modules have different length and, as such, the obtained scales could
have different reliability which, in turn, could potentially challenge the “Equal Reliability
Requirement”. Equating of the Adult and Children scales in the four countries was carried
out through implementation of four equating methods: IRT True Score equating with the
Rasch model, Mean, Linear and Equipercentile equating methods [24]. The first method is
IRT-based while the other four are classical methods of equating, that do not rely on any
model to fit the data but only on the observed raw scores.
Tables 5 and 6 show raw scores on the Children scale that are computed equivalent to
raw scores on the Adult scales that are used as lower thresholds for the moderate and severe
categories of food insecurity. Results suggest that the national thresholds currently used
for nominally the same levels of severity could reflect different degrees of the severity of
access to food. This is particularly evident when looking at the most severe category of food
insecurity, where raw scores on the Children scale that are computed equivalent to the lower
thresholds on the Adult scale are around one point higher than the thresholds currently in
use for households with children for ELCSA in Guatemala and EMSA in Mexico and between
one and two points lower for EBIA (Tables 5 and 6, column “Severe"). On the other hand,
the corresponding raw scores for moderate food insecurity mainly align with the thresholds
currently in use for this category (Tables 5 and 6, column “Moderate"). Interestingly, minor
differences emerge between the behaviour of the equated scores for ELCSA in Guatemala and
Ecuador, possibly due to specific features of the phenomenon in the two countries, confirming
the importance of an equating analysis even between different applications of the same scale.
Finally, it is noteworthy that, among all implemented methods, the Equipercentile equating
method is the one whose results mostly resemble the current adopted thresholds.
17Equating Moderate Severe Equating Moderate Severe
Method (SEE) (SEE) Method (SEE) (SEE)
IRT-TS 6.2 (0.09) 12.1 (0.10) IRT-TS 5.8 (0.09) 12.1 (0.11)
Mean 6.6 (0.07) 12.2 (0.07) Mean 6.4 (0.05) 11.6 (0.05)
Linear 6.5 (0.07) 11.7 (0.11) Linear 6.2 (0.07) 11.0 (0.10)
Equip 6.3 (0.09) 11.3 (0.15) Equip 5.8 (0.13) 11.2 (0.16)
Table 5: Raw scores on the Children scale corresponding to raw scores 4 and 7 on the Adult scale
(lower thresholds for moderate and severe food insecurity, respectively) and related Standard Error
of Equating (SEE) computed by means of the IRT-TS, Mean, Linear and Equipercentile equating
methods. Left: ELCSA (Guatemala). Right: ELCSA (Ecuador)
Equating Moderate Severe Equating Moderate Severe
Method (SEE) (SEE) Method (SEE) (SEE)
IRT-TS 4.8 (0.12) 8.7 (0.13) IRT-TS 4.8 (0.08) 8.7 (0.09)
Mean 5.5 (0.05) 9.5 (0.05) Mean 5.5 (0.04) 9.0 (0.04)
Linear 5.1 (0.07) 8.6 (0.10) Linear 5.5 (0.04) 8.8 (0.07)
Equip 4.8 (0.13) 8.1 (0.14) Equip 4.7 (0.05) 8.3 (0.14)
Table 6: Left: Raw scores on the Children scale corresponding to raw scores 3 and 5 on the Adult
scale (lower thresholds for moderate and severe food insecurity, respectively) and related Standard
Error of Equating (SEE) computed by means of the IRT-TS, Mean, Linear and Equipercentile
equating methods, EMSA (Mexico). Right: Raw scores on the Children scale corresponding to
raw scores 4 and 7 on the Adult scale (lower thresholds for moderate and severe food insecurity,
respectively) and related Standard Error of Equating (SEE) computed by means of the IRT-TS,
Mean, Linear and Equipercentile equating methods, EBIA (Brazil).
6 Conclusions
The present work presented two studies investigating comparability between experiential
scales of food insecurity. The first study aimed at addressing comparability between the FIES
and three national scales (ELCSA, EMSA and EBIA) in Guatemala, Ecuador, Mexico and
Brazil. Results show that, in general, the VoH threshold used for computing the indicator
Prevalence of Experienced Food Insecurity at moderate or severe levels (F IM od+Sev ) and
corresponding to the severity of item ATELESS on the Global Standard (−0.25) seems to
reflect a less severe level of food insecurity than that described by the thresholds used by the
national scales (and expressed in terms of raw scores) for the same level of severity. On the
other hand, the VoH threshold used for computing the indicator Prevalence of Experienced
Food Insecurity at severe levels (F ISev ) and corresponding to the severity of item WHLDAY
on the Global Standard (1.83) seems to reflect a more severe condition than the one measured
through the national thresholds for this level of severity. The relevance of such a result
for the practice of food insecurity measurement is self-evident. In fact, the possibility of
18comparing prevalences of food insecurity derived from applying different scales represents an
important step in the direction of realizing a more reliable monitoring of the global progresses
towards the goal of food security for all people worldwide (as expressed by Target 2.1 of the
Sustainable Development Goals) and, as such, it is expected to gain increasing attention by
practitioners and decision makers in the field.
Additionally, a second study investigated the issue of comparability between food insecurity
scales referred to households without children (Adult scale) and households with children
(Children scale), within each national context. Results show that the national thresholds
currently used to compute prevalences of food insecurity at nominally the same level of
severity among households with and without children might not always represent the same
degree of the restrictions on food access. This seems especially evident for the most severe
category of food insecurity, where current thresholds on the Children scale are lower than
those computed as equivalent to the thresholds used on the Adult scale for this category.
Future studies are expected to shed light on possible reasons and additional aspects of this
topic. A more detailed characterization of the phenomenon of food insecurity across countries
as well as in households with and without children (especially from a social and economic
point of view) will likely better motivate and clarify the distinctive behaviour of different
food insecurity scales. Furthermore, similar analyses to be conducted on other experiential
scales of food insecurity might contribute to reach a deeper knowledge of the phenomenon.
Significant examples being the HFSSM in North America, as well as applications of ELCSA
in countries of the Latin America beyond the ones here considered.
19References
[1] Anthony D Albano et al. equate: An R package for observed-score linking and equating.
Journal of Statistical Software, 74(8):1–36, 2016.
[2] United Nations. General Assembly. Universal declaration of human rights, volume 3381.
Department of State, United States of America, 1949.
[3] Terri J Ballard, Anne W Kepple, and Carlo Cafiero. The food insecurity experience
scale: development of a global standard for monitoring hunger worldwide. Rome, Italy.
FAO, 2013.
[4] Terri J Ballard, Anne W Kepple, Carlo Cafiero, and Josef Schmidhuber. Better mea-
surement of food insecurity in the context of enhancing nutrition. Ernahrungs Umschau,
61(2):38–41, 2014.
[5] Henry I Braun. Observed-score test equating: A mathematical analysis of some ETS
equating procedures. Test equating, 1982.
[6] Carlo Cafiero. What do we really know about food security? Technical report, National
Bureau of Economic Research, 2013.
[7] Carlo Cafiero, Hugo R Melgar-Quinonez, Terri J Ballard, and Anne W Kepple. Validity
and reliability of food security measures. Annals of the New York Academy of Sciences,
1331(1):230–248, 2014.
[8] Carlo Cafiero, Sara Viviani, and Mark Nord. Rm.weights: Weighted rasch mod-
eling and extensions using conditional maximum likelihood. https://CRAN.R-
project.org/package=RM.weights, 2018.
[9] Steven J Carlson et al. Measuring food insecurity and hunger in the United States. The
Journal of nutrition, 129(2):510S–516S, 1999.
[10] Comitato Cientifico de la ELCSA. Escala Latinoamericana y Caribeña de Seguridad
Alimentaria (ELCSA): Manual de uso y aplicaciones. Rome, Italy. FAO, 2012.
[11] Jennifer Coates, Edward A Frongillo, Beatrice Lorge Rogers, Patrick Webb, Parke E
Wilde, and Robert Houser. Commonalities in the experience of household food insecurity
across cultures: what are measures missing? The Journal of nutrition, 136(5):1438S–
1448S, 2006.
[12] Linda L Cook and Daniel R Eignor. Irt equating methods. Educational measurement:
Issues and practice, 10(3):37–45, 1991.
[13] Neil J Dorans, Mary Pommerich, and Paul W Holland. Linking and aligning scores and
scales. Springer Science & Business Media, 2007.
[14] FAO.1946. World Food Survey. Washington, DC. FAO, 1946.
20[15] FAO.1952. World Food Survey. Rome, Italy. FAO, 1952.
[16] FAO.1963. Third World Food Survey. Freedom from Hunger Campaign Basic Study no.
11. Rome, Italy. FAO, 1963.
[17] FAO.1996. World food summit. Rome, Italy. FAO, 1996.
[18] FAO.2001. The state of food insecurity in the world 2001. Rome, Italy. FAO, 2001.
[19] FAO.2016. Methods for estimating comparable rates of food insecurity experienced by
adults throughout the world. Rome, Italy. FAO, 2016.
[20] Gerhard H Fischer and Ivo W Molenaar. Rasch models: Foundations, recent developments,
and applications. Springer Science & Business Media, 2012.
[21] Ronald K Hambleton, Hariharan Swaminathan, and H Jane Rogers. Fundamentals of
item response theory, volume 2. Sage, 1991.
[22] Willim L Hamilton, John T Cook, et al. Household food security in the united states in
1995: technical report of the food security measurement project. 1997.
[23] Andrew D Jones, Francis M Ngure, Gretel Pelto, and Sera L Young. What are we
assessing when we measure food security? a compendium and review of current metrics.
Advances in Nutrition, 4(5):481–505, 2013.
[24] Michael J Kolen and Robert L Brennan. Test equating, scaling, and linking: Methods
and practices. Springer Science & Business Media, 2014.
[25] Frederic M Lord and Marilyn S Wingersky. Comparison of IRT observed-score and
true-score ‘equatings’. ETS Research Report Series, 1983(2):i–33, 1983.
[26] Gary L Marco. Item characteristic curve solutions to three intractable testing problems
1. ETS Research Bulletin Series, 1977(1):i–41, 1977.
[27] Mark. Nord. Assessing Potential Technical Enhancements to the U.S. Household Food
Security Measures. U.S. Department of Agriculture, Economic Research Service, TB-1936,
2012.
[28] World Health Organization et al. Sustainable Development Goals: 17 goals to transform
our world, 2016.
[29] Per Pinstrup-Andersen. Food security: definition and measurement. Food security, 1(1),
2009.
[30] Kathy L Radimer, Christine M Olson, Jennifer C Greene, Cathy C Campbell, and
Jean-Pierre Habicht. Understanding hunger and developing indicators to assess it in
women and children. Journal of Nutrition Education, 24(1):36S–44S, 1992.
21You can also read