Transit in 2021 Regional COVID Recovery Strategy, Step 2 Draft for Public Comment February 2021 - Regional Transportation ...
←
→
Page content transcription
If your browser does not render page correctly, please read the page content below
REPORT     TITLE
Sustaining Critical
Subtitle (optional)
Transit in 2021
Month 20XX (required)

Regional COVID Recovery
Strategy, Step 2

Draft for Public Comment
February 2021
Public comments on this report will be delivered to the RTA Board, and this material will be
discussed at its meetings on February 18 and March 18, 2021, both at 9:00 a.m. The public can
attend all RTA Board meetings via WebEx or watch live via YouTube. Please see the RTA Board
Meetings web page for meeting agendas, materials, and the most current information on how
to attend.

Send comments and feedback to communications@rtachicago.org before 5:00 p.m. on March
5, 2021. Written comments can also be sent to the RTA Administrative Offices, 175 W. Jackson
Blvd., Suite 1650, Chicago, IL 60604. The public may also call the main RTA office at 312-913-
3110. Requests for translated materials or other requests to enhance the accessibility of this
report should be sent to communications@rtachicago.org.
Contents
Introduction............................................................................................................................ 1
Background ..................................................................................................................................... 1
     COVID-19’s impact on transit .................................................................................................. 1
     Three-step COVID-19 Recovery Strategy ................................................................................. 2
     The purpose of this document ................................................................................................. 3
Identifying immediate funding solutions ................................................................................. 4
Taking an increasingly transparent, collaborative approach to communicating ....................... 6
Sustaining critical regional transit services .............................................................................. 7
Summary and next steps......................................................................................................... 9
References ............................................................................................................................ 10
Appendix .............................................................................................................................. 11
Defining Transit Critical Need Areas (CNAs) ................................................................................. 11
     Propensity CNA ...................................................................................................................... 12
     Equity CNA ............................................................................................................................. 14
     High Mobility Industries (HIMOB) CNA.................................................................................. 16
     Combined CNA ....................................................................................................................... 18
Measuring current service in combined transit CNAs .................................................................. 20
     Relating service to critical need ............................................................................................. 22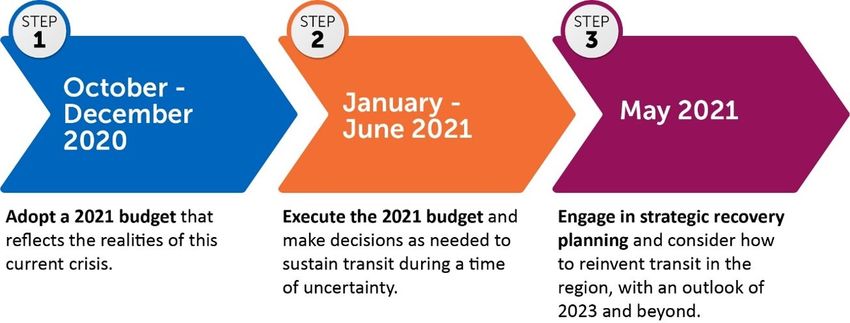
Introduction
The Regional Transportation Authority (RTA) was established in Northeastern Illinois in 1974 by
referendum and passage of the RTA Act and oversees finances, secures funding, and conducts
transit planning for the Chicago Transit Authority (CTA), Metra, and Pace, sometimes referred
to as the “Service Boards.” The RTA also manages these three Service Boards’ five-year capital
programs. To help riders with disabilities and older adults across Cook, DuPage, Kane, Lake,
McHenry, and Will counties, the agency issues Reduced Fare and Ride Free permits, assesses
eligibility for ADA Paratransit service, and oversees specialized travel training. The RTA is
governed by a 16-member Board of Directors who meet monthly. For more information, visit
www.rtachicago.org.

This report provides information to support the RTA Board’s efforts to sustain critical transit
services in 2021. It includes information related to options for funding transit, means for
communicating with the public about its actions, a method defining transit Critical Need Areas
(CNAs), and a recommendation for using the transit CNAs to guide RTA’s work and distribute
the federal funds made available for the Chicago region’s transit system by the Coronavirus
Response and Relief Supplemental Appropriations Act (CRRSAA) passed by the U.S. Congress
and signed into law in December 2020. Comments and feedback relating to the contents of the
report and the RTA’s proposed allocation of federal relief funding should be sent to
communications@rtachicago.org no later than 5:00 p.m., Friday, March 5. These comments will
be considered by RTA staff and shared in full with the RTA Board of Directors prior to and at
their March 18, 2021, meeting.

Background
COVID-19’s impact on transit
Since the onset of the COVID-19 pandemic, transit has served a vital role in providing essential
workers and others with safe and reliable transportation to hospitals, police stations,
firehouses, groceries, and other essential workplaces. While the Chicago region’s transit system
has continued to provide an average of 500,000 trips per day throughout the pandemic, as of
January 22, weekday ridership was down 74 percent compared to 2019 (excluding ADA
Paratransit). This loss of riders has resulted in a catastrophic loss in fare revenue for the system.
As of November, systemwide farebox revenue was down 78 percent ($64.1 million) from the
same month in 2019 (also excluding ADA Paratransit). Successful regional economic recovery
from the pandemic will require a vibrant transit system, and the significant financial challenges
brought about by the pandemic threaten the ability of the transit agencies to sustain service.

From the earliest days of the COVID-19 crisis in March 2020, the RTA has worked closely with
the Service Boards to respond appropriately. Passed in March 2020, the federal Coronavirus
Aid, Relief, and Economic Security (CARES) Act allocated $25 billion for public transit

                                                                                 Sustaining Critical
                                              Page 1 of 22                          Transit in 2021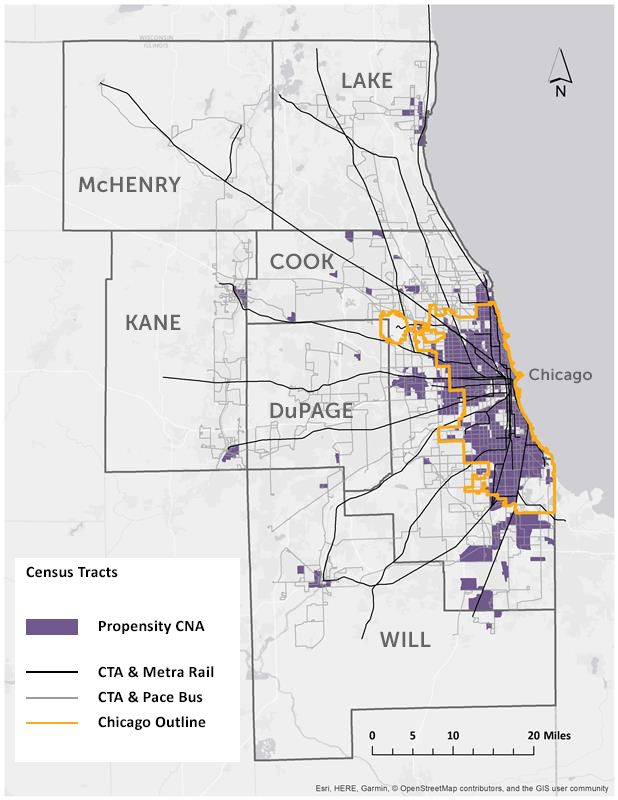
nationwide, including more than $1.4 billion for the RTA region for operating costs to maintain
service and offset lost revenue due to coronavirus. The RTA oversaw expeditious distribution of
CARES Act dollars through execution of a regional funding amendment in May 2020.
Throughout the summer of 2020, the RTA increased information sharing with stakeholders and
the public, developed recovery scenarios and sought stakeholder input on recovery strategies,
and continually worked with elected bodies and leaders. In fall 2020, as the 2021 Regional
Operating Budget and Capital Program (“2021 Budget”) was being adopted and the second
wave of the pandemic was ravaging the entire U.S., the RTA shifted to preparing the RTA Board
to sustain transit in 2021 and beyond.

Three-step COVID-19 Recovery Strategy
The RTA Staff developed and presented a Three-Step COVID-19 recovery strategy to the RTA
Board at its October 15, 2020, meeting. A memo to the RTA Board describes the strategy’s
three steps:

       Step 1: Adopt a 2021 budget that reflects the realities of this current crisis (October to
       December 2020).

       Step 2: Execute the 2021 budget and make decisions as needed to sustain transit during
       a time of uncertainty (January to June 2021).

       Step 3: Engage in strategic recovery planning and consider how to reinvent transit in the
       region, with an outlook of 2023 and beyond (to begin approximately May 2021).

Figure 1. Three-step COVID recovery strategy

The purpose of three steps is to provide a clear, transparent course forward during an uncertain
time. Since then:

                                                                                Sustaining Critical
                                            Page 2 of 22                           Transit in 2021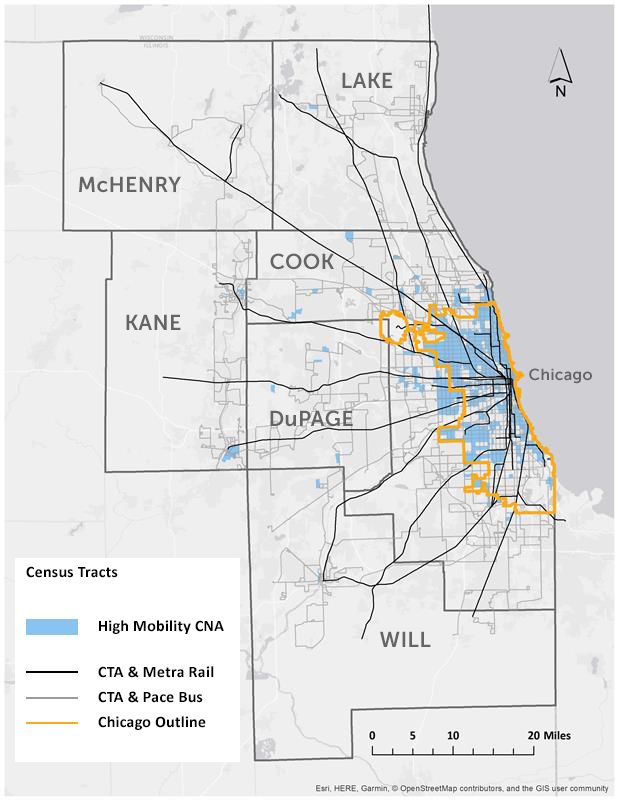
•   The RTA Board completed Step 1 on December 17, 2020, when it adopted the 2021
       budget that reflected the realities of this current crisis.
   •   The RTA is currently in Step 2: Execute the 2021 budget and make decisions as needed
       to sustain transit during a time of uncertainty (January - June 2021).
   •   RTA staff is planning for Step 3: Engage in strategic recovery planning and consider how
       to reinvent transit in the region, to begin approximately May 2021 with an outlook to
       2023 and beyond.
The three-step recovery strategy also established a set of policy priorities to guide each of the
steps. These policy priorities are being used to guide Step 2 of recovery and the information
presented in this report, and they include:

   •   Identify immediate funding solutions to support the transit system, including
       advocating for federal aid, exploring new revenue solutions, and considering how to
       leverage resources to meet short-term needs most effectively.
   •   Sustain critical transit services to provide mobility for those who most need public
       transportation at this time, including bus riders, essential workers, residents with
       economic hardships across the region, and people with disabilities.
   •   Take an increasingly transparent, collaborative approach to communicating with
       stakeholders and the public about projected budget shortfalls, impending cuts, and
       other potential disruptions to service.

This report addresses all three of these priorities and recommends that the results of this work
be used to guide distribution of CRRSAA federal relief funds, to sustain critical transit service in
the Chicago region in the unique moment that is 2021.

The purpose of this document
This document has been developed as part of recovery Step 2, which will require several
actions on the part of the RTA Board.

The RTA Board will continue its standard operating practice of monitoring monthly and
quarterly finance performance of the Service Boards relative to the adopted budget. However,
there are unique elements of the 2021 operations budget adopted in Step 1 that will require
additional vigilance and action on the part of the RTA Board. The 2021 operations budget is
$3.02 billion, a 5% reduction of $157.4 million compared to the pre-COVID plan for the year. It
includes proposed 2021 operating budgets for the Service Boards that recognize the reality of
lower revenue for operations and calls for additional relief funding of approximately $500
million to sustain essential transit service as the region recovers from the pandemic. It also
assumes a variety of approaches to service -- continuation of right-sized service levels at Pace,
reduced but slightly increasing service levels at Metra, and no changes to service at CTA relative

                                                                                  Sustaining Critical
                                              Page 3 of 22                           Transit in 2021
to late 2020. It also assumes no immediate fare increases. As a result, the 2021 budget
recognizes that in the absence of additional relief funding, further service reductions and fare
increases will be required to balance operating expenses to the reduced revenue base. Thus, as
it moves from Step 1 to Step 2, the RTA Board will continue to monitor Service Board financial
performance and to assist the agencies in identifying and allocating additional funds that are
needed to meet the region’s needs and deliver on the 2021 budget.

A partial funding solution to the immediate 2021 budget deficit materialized in late December
of 2020 when Congress passed a second round of emergency COVID relief funding for transit
nationwide. The $900 billion Coronavirus Response and Relief Supplemental Appropriations Act
of 2021 (CRRSAA), which became law on December 27, 2020, directs approximately $14 billion
to transit agencies nationwide including approximately $486.2 million to the greater Chicago
urbanized area.

To fulfill its policy objective of sustaining critical transit service and to guide distribution of this
specific relief money, RTA staff developed the Transit Critical Need Areas (CNAs) discussed in
this report. Step 2 of the recovery strategy is designed to provide the RTA Board and public
with information needed to take these impactful and unprecedented actions on behalf of the
region’s transit system.

It is important to note that the analysis presented in this report is specific to RTA’s role in the
Chicago region’s transit system in a post-pandemic 2021. While it is common practice for the
RTA, Service Boards, and other agencies to consider transit use, equity, and industry presence
in planning and evaluating the transit system, there are also many other considerations that go
into developing actual transit routes and schedules that are created and operated by the
Service Boards – including origin and destination patterns, ridership demand, operational
constraints, funding partners, traffic patterns, labor and staffing rules, operating regulations,
and Title VI requirements to name a few. The method that RTA has created to define transit
CNAs and relate them to existing service is for the purposes of informing the RTA’s funding
decisions in 2021. Likewise, the application of the work to a recommended allocation of the
region’s CRRSAA federal relief money is unique to the moment and does not set a precedent for
future allocations of any funding. That said, it is a helpful way for the RTA Board and the public
to understand where the greatest need for transit exists right now and to sustain critical transit
without delving into service planning or operation.

Identifying immediate funding solutions
The first policy priority for recovery lies at the core of RTA’s purpose and mission. The RTA is
responsible for overseeing the operating budgets and capital programs of all three Service
Boards. This includes developing revenue estimates and forecasts of regional sales tax receipts,
which fund operations; issuing bonds to provide funding for capital investments; approving and
monitoring the Service Boards’ annual budgets and two- and five-year capital programs; and
conducting regular oversight audits to verify the Service Boards’ financial information.

                                                                                     Sustaining Critical
                                                Page 4 of 22                            Transit in 2021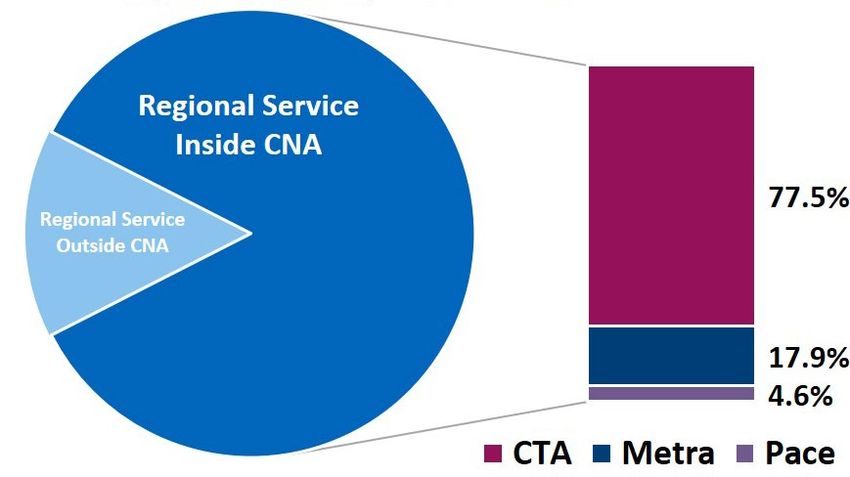
The RTA Board is also able to take other actions to provide funding for the region’s transit
system. Because the adopted 2021 budget contains a $500 million gap, the RTA’s immediate
priority has been to seek funding solutions to fill the budget gap and then determine and follow
a transparent and accountable process for allocation of any funding received.

In the second half of 2020, the RTA staff explored several solutions to fill the 2021 budget gap
of approximately $500 million. The $900 billion CRRSAA COVID relief package directed
approximately $14 billion to transit agencies nationwide, including $486.2 million to the greater
Chicago urbanized area. While this does not completely fill the 2021 budget gap, the RTA
Board’s focus since the bill was passed in December has been to work toward allocating these
federal funds in accordance with the policy priorities set out in three-step recovery strategy.
Table 1 outlines other immediate funding solution options, which were presented to the Board
at its January 2021 meeting and remain available to bolster transit in 2021 and beyond.

Table 1. Comparison of Immediate Funding Solution Options

 Funding Solution       Potential    Discussion                         Recommendation
 Options                Availability
                        of Funding

 Federal relief         1st Quarter   RTA has continually sought        RTA should continue to
                        of 2021       federal relief, along with peer   seek federal funding as
                        and           transit agencies and the          the primary source of
                        beyond        transportation industry at        relief. Upon receiving it,
                                      large.                            the RTA Board should
                                                                        work to allocate funds
                                                                        according to an interim
                                                                        relief process that
                                                                        supports the RTA Board-
                                                                        adopted principles for
                                                                        recovery.

 State relief           2nd to 4th    State relief could come in two    RTA should continue to
                        Quarter of    forms: Additional funding or      work to stem off any
                        2021          funding flexibility. Both would   State cuts or harm to
                        earliest      require legislative action and    services at a minimum.
                                      would be highly contingent        Beyond this, RTA staff
                                      upon the status of the State’s    could continue to
                                      own budget. The State could       advocate for additional
                                      also harm transit operations      state aid to plug any
                                      by cutting existing funding       remaining budget gaps
                                      and/or increasing service fees

                                                                               Sustaining Critical
                                            Page 5 of 22                          Transit in 2021
as has been precedence in caused by shortages in
recent years. other sources.
Re-allocation of 4th Quarter Only a small portion of existing Given the constraints on
existing funds on of 2021 funding could likely be re- existing funding and lack
emergency basis earliest allocated and there is minimal of precedence, staff
precedence for such action, so recommends that this
it would be highly unusual and option be considered if
would require unilateral and when other
support to undertake. solutions prove
insufficient.
RTA borrowing 4th Quarter RTA could explore borrowing Staff recommends that
of 2021 to cover operational deficits this option be explored
earliest by using its current short-term only when other
borrowing authority or solutions prove
through seeking an expansion insufficient.
to the current statutory cap on
its short-term borrowing
authorization. In addition to
being costly to taxpayers, this
option would require the RTA
Board to shift its policy on
borrowing to cover projected
operational deficits. Both
actions would take time and
likely not make funding
available until Q4 or beyond.
RTA invites feedback from stakeholders and the public on other potential means of providing
additional funding to the agencies.
Taking an increasingly transparent, collaborative
approach to communicating
The RTA is committed to taking a transparent and collaborative approach throughout the three-
step recovery strategy. RTA staff has and will continue to invite collaboration and share
information with our partners at each of the Service Boards and with interested stakeholders
across the region.
Specific steps by the RTA to increase transparency and accountability include:
Sustaining Critical
Page 6 of 22 Transit in 2021• Communicating via multiple public channels about each step of the recovery strategy,
including a biweekly COVID-19 newsletter, publicly available blog posts describing steps
and actions, posts via multiple social media accounts, in speaking appearances by RTA
staff, and through regular reports to our Board of Directors and other governing bodies.
• Sharing information during regular coordination meetings with staff at each Service
Board.
• Subjecting this analysis and recommendation to a formal public comment period.
RTA invites feedback from stakeholders and the public on additional communication methods
that are helpful to assisting the public in understanding the RTA’s actions at this time.
Comments and feedback, as well as public comments to be read before the RTA Board should
be sent to communications@rtachicago.org. Written comments can also be sent to the RTA
Administrative Offices, 175 W. Jackson Blvd., Suite 1650, Chicago, IL 60604. The public may also
call the main RTA office at 312-913-3110. Requests for translated materials or other requests to
enhance the accessibility of this report should be sent to communications@rtachicago.org.
Public comments on this report will be delivered to the RTA Board and this material will be
discussed at its meetings on February 18 and March 18, 2021, both at 9:00 a.m. The public can
attend all RTA Board meetings via WebEx or watch live via YouTube. Please see the RTA Board
Meetings web page for meeting agendas, materials, and the most current information on how
to attend.
Sustaining critical regional transit services
The third policy priority for recovery speaks to the RTA’s commitment to the traveling public.
COVID-19 changed mobility drastically in 2020, and travel patterns will likely continue to vary
throughout 2021 and beyond. While it is easy to focus on the ridership drop and who is not
riding anymore, the reality is that the regional transit system is a critical part of the life for the
people who have continued to take the nearly 500,000 weekday trips through the pandemic. As
the region continues to recover from the health crisis and economic hardships of 2020, RTA
expects more people to return to work and daily routines, and for that return to vary widely
across the region.
Many regions and transit agencies around the country have faced the prospect of unplanned
service cuts into 2021, which have been met with significant public outcry. In order to avoid this
situation in the Chicago region, RTA staff has recommended that the RTA Board proactively
state and gain regional consensus about the geographic areas in which it is critical to maintain
transit presence throughout 2021.
For this reason, RTA staff has defined a set of transit Critical Need Areas (CNAs) across the
region based on considerations about who, in 2021, is most likely to use transit to commute,
Sustaining Critical
Page 7 of 22 Transit in 2021who is most likely to need transit in general, and who is most likely to work in industries that
will require commuting. This methodology is based on where people live, and is described in
the Appendix. The following map shows transit CNAs that have been identified across the
region.
Figure 2. Transit Critical Need Areas (CNAs)
Sustaining Critical
Page 8 of 22 Transit in 2021The RTA has also quantified how much current service was serving these areas of the region
throughout the course of a week in late 2020, as described in the Appendix. The result of this
analysis is shown in Figure 3, which indicates that 85% of the current weekly regional transit
service stops in a transit CNA. For the services that are operating in transit CNAs, 77.5% of the
service is provided by the CTA; 17.9% is provided by Metra; and 4.6% is provided by Pace.
Figure 3. Regional Service Inside/Outside of CNAs and Proportion Inside by Service Board
These results underscore the importance of the network that is operating right now to both the
City of Chicago and suburban satellite cities, as well as key population centers throughout the
region. With over 85% of the region’s current transit service in transit CNAs, it is evident that
most of the regional service currently in place is operating in places where the need for transit
is the highest. Cutting service further to below-budgeted levels would be catastrophic for
regional residents. Transit is often perceived as an urban need, and while the analysis indeed
points to a great need in Chicago, it also underscores the regional nature of transit and the
important purpose of Pace and Metra in connecting people to and around significant regional
population centers outside of Chicago.
RTA invites feedback from stakeholders and the public on the RTA’s methodology for defining
transit CNAs for the purpose of sustaining transit in 2021.
Summary and next steps
The RTA Board has many challenges ahead in executing Step 2 of recovery. This will involve
continuing to identify funding sources and communicating with stakeholders and the public
about the status of regional transit finances, budget changes, and funding revisions based on
Sustaining Critical
Page 9 of 22 Transit in 2021actual sales tax receipts and updated sales tax projections. It also will involve allocating
necessary relief funds to sustain critical transit now and taking other actions as needs evolve
throughout the year.
One critical action ahead is the allocation of CRRSAA funds and consideration of a budget
amendment that will allow the Service Boards to access these funds in March. Staff
recommends that the RTA Board allocate federal relief funds available to the three service
boards based on the regional transit CNA analysis presented in this document. Such actions will
be discussed at the RTA’s February and March Board meetings, informed by the contents of this
document and comments received.
As the region continues to re-open and additional funding relief is received from federal, state,
or other regional sources in 2021, the critical need and service can be re-evaluated to
accommodate the changing needs of riders. Successful execution of Step 2 will also provide
solid groundwork for the separate and important work of considering the long-term future
strategy for transit in Step 3 of recovery.
Comments and feedback related to this document can be provided by March 5 to
communications@rtachicago.org. Written comments can also be sent to the RTA
Administrative Offices, 175 W. Jackson Blvd., Suite 1650, Chicago, IL 60604. The public may also
call the main RTA office at 312-913-3110.
References
Chicago Metropolitan Agency for Planning (CMAP). Transit Availability Index. January 2015.
Federal Transit Administration (FTA). Simplified Trips-on-Project Software. August 2020.
Regional Transportation Authority (RTA). Transit Access Score. January 2017.
Transit Cooperative Research Program (TCRP). Transit Markets of the Future: The Challenge of
Change. January 1998.
Transit Cooperative Research Program (TCRP). Equity Analysis in Regional Transportation
Planning. July 2020.
Los Angeles County Metropolitan Transportation Authority. NextGen Bus Plan: Transit Equity
Evaluation Methodology. May 2019.
Sustaining Critical
Page 10 of 22 Transit in 2021Appendix
The RTA’s work to identify the transit Critical Need Areas (CNAs) and their implications for
service and funding included several steps and components described in this Appendix.
Defining Transit Critical Need Areas (CNAs)
The first part of RTA’s work involved defining transit CNAs for 2021 based on the people living
in the region. Who is most likely to need transit and where to do they live? Transit is designed
to take people from one place to another, and all trips start at home. RTA staff has evaluated
four potential methods for defining transit CNAs, accordingly, based on the previous RTA work,
existing publications, and other transit agency practices. These include:
• Transit propensity, which considers who is most likely to use transit to commute before
the pandemic and now.
• Regional equity explores who is most likely to need transit to access essential goods and
services in our region in general.
• High mobility industries (HIMOB) analysis identifies the industries most likely to need
workers on-site and in-person to perform their jobs.
• A combined propensity, equity, and HIMOB analysis encapsulates all three
considerations in one measure and is the method that RTA recommends for defining
2021 transit CNAs.
Each potential transit CNA definition identifies areas within the region that are home to above-
average densities of the population groups under consideration by that definition. Census tracts
are used as the geographic unit of analysis and densities of people per acre are used as the
normalized population unit of analysis, allowing RTA to use readily available census data for the
analysis and compare different areas across the region. The demographics included in each
potential transit CNA definition were selected based on existing RTA market analysis, academic
and peer agency research, as well as institutional understanding of how people are currently
traveling for work.
The areas (tracts) counted in each potential transit CNA definition are identified because they
have above-average densities of specific demographics groups living there. This is calculated
using a statistical tool called a Z score, which indicates how many standard deviations a tract
density is from the regional average. For RTA’s analysis, tracts with a Z score less than or equal
to 0 in a particular density measure are given a score of 0. The Z scores for each individual
demographic are then added together for each tract to form the transit CNA score for the tract
and the region. All tracts with a transit CNA score > 0 after this addition is completed are
included in the transit CNA by that definition.
Sustaining Critical
Page 11 of 22 Transit in 2021The following section describes the demographic selections and results for each potential
transit CNA definition.
Propensity CNA
The propensity CNA helps identify areas of the region that are home to above-average densities
of the working population that were likely to use transit for their commutes before COVID and
are likely to continue doing so if they are commuting now. The demographics selected are
adapted from existing RTA market analysis, specifically the Transit Use Propensity Index.
The following table lists the demographic groups included in the Propensity CNA definition by
data source and year.
Table A-1. Propensity CNA Demographic Groups
Demographic
Workers age 20-44
African American workers
Workers without a vehicle available for their commute
Workers making a wage below the poverty line
Source: U.S. Census Bureau, American Community Survey, 2019
The following map shows regional census tracts identified as a transit CNA by the propensity
CNA score. These tracts contain above average densities of workers who are more likely to
commute via transit if they are commuting in 2021.
Sustaining Critical
Page 12 of 22 Transit in 2021Figure A-1. Propensity CNA Score Map
Sustaining Critical
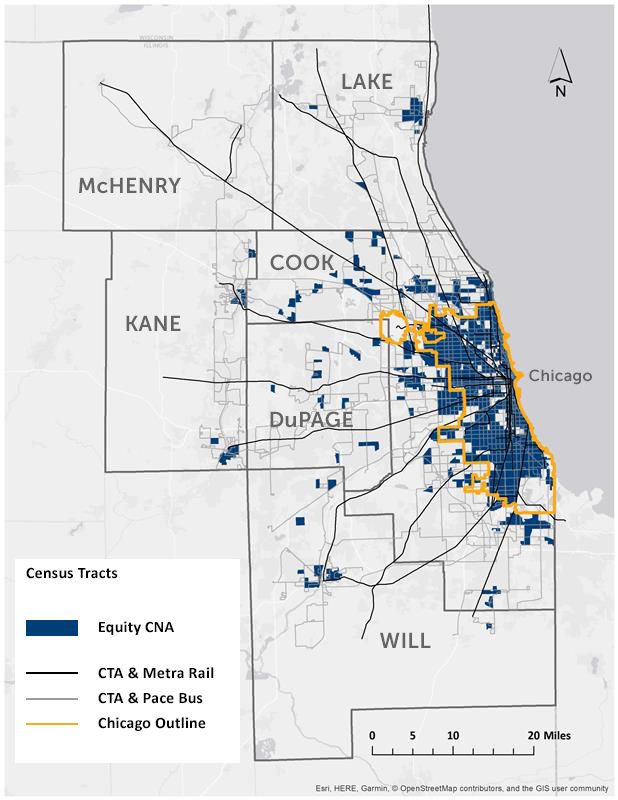
Page 13 of 22 Transit in 2021Equity CNA
The equity CNA helps identify areas of the region that are home to above-average densities of
the general population that are likely to need transit to access essential goods and services. The
demographics selected are adapted from existing academic and peer agency research including
the Los Angeles County Metropolitan Transit Equity Index.
The following table lists the demographic groups included in the equity CNA definition by data
source and year.
Table A-2. Equity CNA Demographic Groups
Data
Demographic Source Year
Senior population
Non-white population American
Low-income households (< $35,000 annual income) Community 2019
Low English proficiency population (age 5+ from households where Survey
all members age 14+ have limited English language proficiency)
Americans with Disabilities Act (ADA) paratransit registrants RTA 2020
Mobility
Services
The following map shows regional census tracts identified as a transit CNA by equity CNA score.
These tracts contain above average densities of population that are likely to need transit in
general and particularly for regional recovery in 2021.
Sustaining Critical
Page 14 of 22 Transit in 2021Figure A-2. Regional Census Tracts Identified as a Transit CNA by Equity CNA Score Map
Sustaining Critical
Page 15 of 22 Transit in 2021High Mobility Industries (HIMOB) CNA
The HIMOB CNA helps identify areas of the region that are home to above-average densities of
workers employed in specific industries that require workers to be on-site and in-person to
perform their jobs. The selected industries reflect an institutional understanding of who is
currently working in-person, drawing from available survey data, peer agency data, regional
and national webinars and discussion, and regional stakeholders. While the selections are made
based on the employer industry, above average densities are measured for worker home
locations, not the location of the job.
The following table lists industries included in the HIMOB CNA definition.
Table A-3. HIMOB CNA Demographic Groups
Industries
Utilities
Construction
Manufacturing
Wholesale Trade
Retail Trade
Transportation and Warehousing
Administrative and Support and Waste Management and Remediation Services
Educational Services
Health Care and Social Assistance
Accommodation and Food Services
Other Services (except Public Administration)
Public Administration
Source: U.S. Census Bureau, Longitudinal Employment-Household Dynamics: Residential Area
Characteristics, 2018
Sustaining Critical
Page 16 of 22 Transit in 2021The following map shows regional census tracts identified as transit CNAs by the HIMOB CNA
score. These tracts contain above-average densities of workers that are likely to need to work
in-person in 2021.
Figure A-3. HIMOB CNA Map
Sustaining Critical
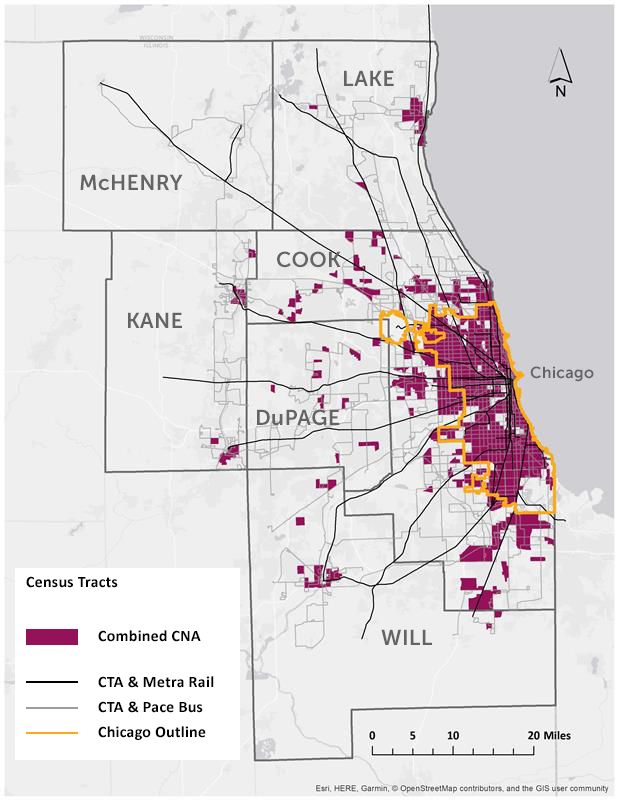
Page 17 of 22 Transit in 2021Combined CNA
The combined CNA includes all the demographics included in the propensity, equity, and
HIMOB CNA definitions. Any regional census tract that is identified as a transit CNA in one or
more of the three individual CNAs definitions is included in the combined CNA. This combined
CNA definition includes all the holistic considerations important for sustaining transit in 2021
and thus is the recommended method for defining transit CNAs in 2021.
The following map shows all regional census tracts identified as a transit CNA in the combined
CNA.
Sustaining Critical
Page 18 of 22 Transit in 2021Figure A-4. Combined CNA Map
Sustaining Critical
Page 19 of 22 Transit in 2021Measuring current service in combined transit CNAs
The second part of RTA’s work involved measuring how much transit is currently provided in
the combined transit CNAs across the region. This is helpful for both understanding how much
of the current service is operating in critical areas, and for understanding how the three service
boards contribute to service currently operating in the region’s transit CNAs.
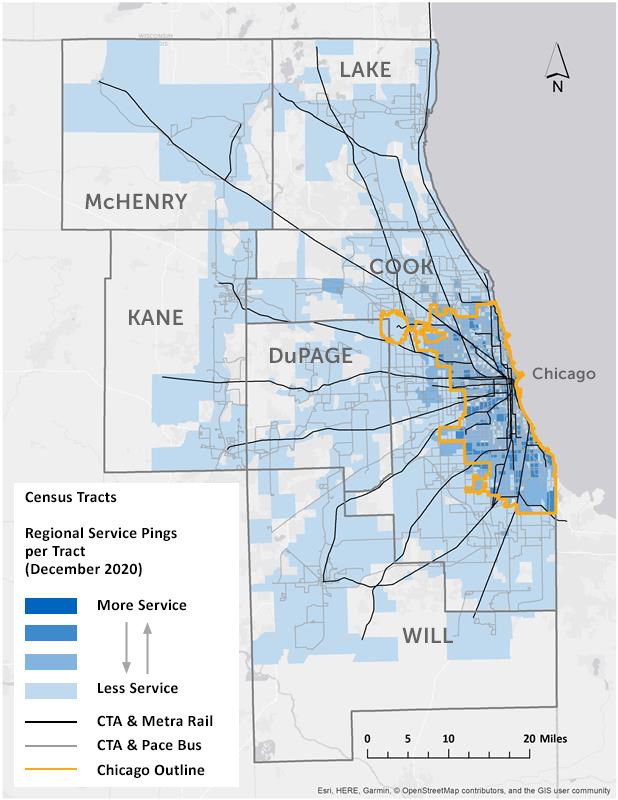
Regional service was quantified by counting the number of times a transit vehicle passes a stop
in each census tract throughout the course of a week in late 2020. This count is conducted
using publicly available General Transit Feed Specification (GTFS) schedule data from each of
the three Service Boards, CTA, Metra, and Pace. GTFS data provides publicly consumable transit
schedules in a standardized format and is used in trip planning applications such as Google
Transit, Moovit, and the Transit App.
Within the GTFS data set every scheduled stop of a bus or train for a full week schedule has a
corresponding geo coordinate. Aggregated at the census tract level, this data indicates whether
a train line or bus route has a stop within a tract and, if so, how many times it passes each stop
over the course of the weekly schedule. The count of stops in a tract, or “pings” per tract, is
then measured against other tracts in the region. Once mapped, the pings show how transit
service is distributed across the region.
Aggregating GTFS geographically is a component of quantifying transit service used in other
methods, including the Federal Transit Administration’s Simplified Trips-on-Project Software
(STOPS), the RTA Transit Access Measure, and the Chicago Metropolitan Agency for Planning
(CMAP) Transit Availability Index. The GTFS data sets used in this analysis were accessed in
December 2020, reflecting service changes implemented by Metra and Pace because of the
impacts of the COVID-19 pandemic.
The following map shows regional service quantified by pings per census tract.
Sustaining Critical
Page 20 of 22 Transit in 2021Figure A-5. Regional Service by Census Tract Map
Sustaining Critical
Page 21 of 22 Transit in 2021Relating service to critical need
Having quantified regional service, a final action is to relate the service that is being provided to
the critical need areas. In other words, counting pings serving the combined CNA.
The final step answers two questions:
• How much of the regional network serves the combined CNA?
• Of the service operating in the combined CNA, what proportion is operated by each
Service Board?
To account for the differences in cost and carrying capacity of the different modes operated by
the Service Boards, transit pings are weighted by the Q3 expenditure for each Service Board.
Weighting by expenditures reflects that a bus carrying dozens of people is less costly to operate
than a train carrying hundreds of people and provides a proxy to capture the service
characteristics of each mode.
The following chart (which appears as Figure 3 in main body of this report) shows the relative
amount of Regional Service operated inside and outside of combined CNAs. For the service
currently operated inside the combined CNAs, the portion of that service currently operated by
each Service Board is also shown.
Figure A-5. Regional Service Inside/Outside of CNAs and Proportion Inside by Service Board
The proportion of current service operated by each Service Board in the regional transit Critical
Need Areas are recommended to be used to allocate relief funding in places where the need for
transit is the highest.
Sustaining Critical
Page 22 of 22 Transit in 2021You can also read