Transit Link Evaluation - for John Wayne Airport Air Passengers and Employees - Ducey & Associates - City of Newport Beach
←
→
Page content transcription
If your browser does not render page correctly, please read the page content below
Transit Link Evaluation
                  for
           John Wayne Airport
     Air Passengers and Employees

             December 2008

             PREPARED FOR
ORANGE COUNTY TRANSIT AUTHORITY (OCTA)

                             Ducey & Associates
TABLE OF CONTENTS

                                                                                                                       PAGE

INTRODUCTION..................................................................................................................1
REPORT ORGANIZATION................................................................................................3
Ch 1 John Wayne Airport (JWA) Background And Existing Conditions.................4
    1.1 History of the JWA Settlement Agreement.......................................................4
    1.2 Surrounding Land Use and Environmental Setting ........................................6
    1.3 JWA Ground Transportation Services ...............................................................6
      1.3.1 Rail Transit .......................................................................................................7
      1.3.2 Bus Transit .......................................................................................................7
      1.3.3 Express Bus ......................................................................................................7
      1.3.4 Private Airport Shuttles .................................................................................7
      1.3.5 Courtesy Shuttles ............................................................................................8
      1.3.6 Taxis and Limousines.....................................................................................8
      1.3.7 On-Site and Off-Site Parking.........................................................................8
      1.3.8 On-Site and Off-Site Rental Car Agencies...................................................8
Ch 2 Airport Transit Integration ......................................................................................9
    2.1 Airport Access Travel Time...............................................................................10
    2.2 Market Segmentation .........................................................................................11
Ch 3 JWA Air Passenger Market ....................................................................................14
    3.1 Passenger Demographics and Residency ........................................................17
    3.2 Residents and Visitors ........................................................................................19
    3.3 Trip Purpose ........................................................................................................21
    3.4 Origins of JWA Passengers................................................................................22
    3.5 Airport Access and Traffic Congestion............................................................25
    3.6 Travel Time from Local Origin to JWA ...........................................................28
    3.7 Public Transit Perceptions and Use..................................................................32
    3.8 Modal Choices – Cost versus Trip Time..........................................................33
    3.9 Airport Choice Factors and Alternate Airports..............................................34

                               Ducey & Associates                                                                             TOC- i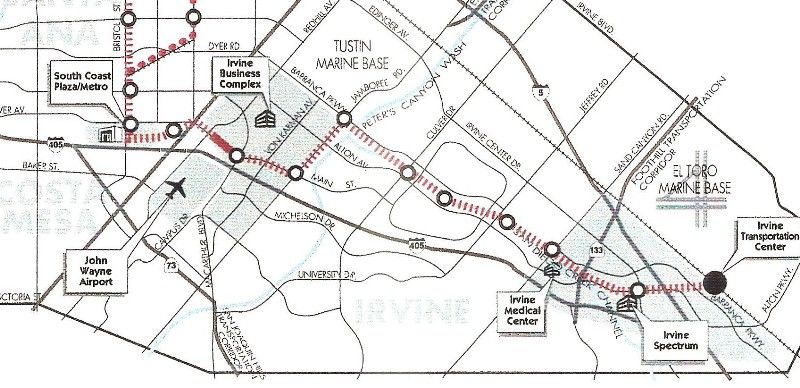
TABLE OF CONTENTS

                                                                                                                         PAGE

Ch 4 Air Passenger Concentrations................................................................................38
    4.1 Anaheim – Garden Grove Disney Resort ........................................................38
    4.2 JWA/South Coast Metro....................................................................................42
    4.3 South Orange County.........................................................................................46
Ch 5 Evaluation of Transit Options to John Wayne Airport (JWA) ........................50
    5.1 Bus Connection from Metrolink Station ..........................................................50
    5.2 Express Bus Connection.....................................................................................56
    5.3 Bravo! Bus Rapid Transit ..................................................................................56
    5.4 Light Rail Connection from Metrolink Station ...............................................58
Ch 6 Rail Alignments between Irvine and John Wayne Airport (JWA).................59
    6.1 History ..................................................................................................................59
    6.2 The LPS Alternative............................................................................................59
    6.3 Analysis ................................................................................................................64
    6.4 Case Study: Chicago Airport Express .............................................................69
    6.5 Summary ..............................................................................................................72
Ch 7 Ridership Estimation Findings and Summary...................................................73
    7.1 Introduction .........................................................................................................73
    7.2 Market Definition................................................................................................74
    7.3 Market Analysis ..................................................................................................79
Ch 8 Conclusion and Recommendations......................................................................82
    8.1 Findings ................................................................................................................82
    8.2 Recommendations...............................................................................................85
    8.3 Go Local Program Criteria.................................................................................85

                                Ducey & Associates                                                                               TOC- ii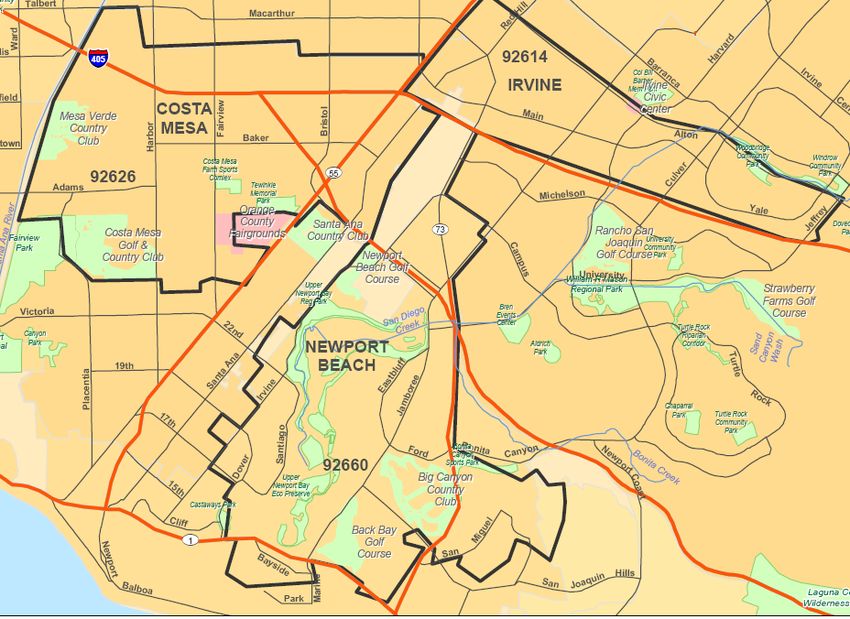
TABLE OF CONTENTS
                                       (Tables)
                                                                                                              PAGE

2-1   Rail Transportation Shares at World Airport Locations .................................9
2-2   Travelers Choice of Ground Access Modes ....................................................12
3-1   Distribution of Weekly Scheduled Seats .........................................................16
3-2   Distribution of Air Passenger Household Income .........................................18
3-3   Resident Non Orange County Air Passengers ...............................................20
3-4   Air Passenger Clusters .......................................................................................25
3-5   Airport Access Mode..........................................................................................28
3-6   Average Travel Times ........................................................................................31
3-7   Hypothetical Modal Choice Matrix..................................................................33
4-1   Transit Service Between Anaheim and JWA ..................................................41
4-2   South Coast Metro Hotel Passengers – Transportation Mode .....................45
4-3   Large Hotels in JWA/South Coast Metro Area..............................................45
5-1   Travel Times between Candidate Stations and JWA.....................................52
5-2   Travel Time Comparison Rail with Shuttle Bus versus Car .........................55
6-1   Comparisons of Line Haul Time, by Mode and Distance.............................66
7-1   Ridership Estimate..............................................................................................80

                      Ducey & Associates                                                                            TOC- iii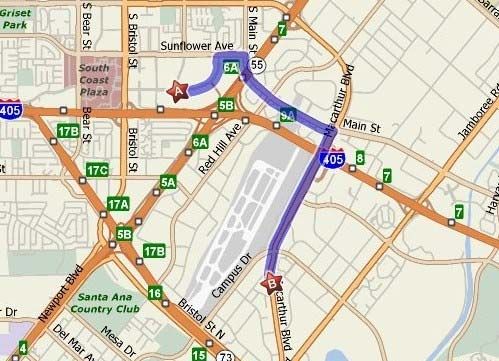
TABLE OF CONTENTS
                                       (Exhibits)
                                                                                                                PAGE

1-1    JWA Historical Passenger Trends.......................................................................6
3-1    Demographic Characteristics ............................................................................17
3-2    Household Income – Business Travelers.........................................................18
3-3    Passengers Primary Residence..........................................................................20
3-4    Passenger Trip Purpose......................................................................................22
3-5    Air Passenger Trip Origin by City....................................................................23
3-6    Air Passenger Trip Origin by Zip Code...........................................................24
3-7    Place of Air Passenger Trip Origin...................................................................26
3-8    Ground Transportation Mode to JWA.............................................................27
3-9    Reported Passenger Commute Times..............................................................30
3-10   Use of Public Transportation in the Past Year ................................................32
3-11   Use of Rail Transportation in the Past Year ....................................................33
3-12   Alternate Airport Considered ...........................................................................34
3-13   Airport Preferences.............................................................................................35
3-14   Factors Influencing Passengers Choosing JWA..............................................36
3-15   Alternate Airports...............................................................................................37
3-16   What Would Influence Your Decision to Fly from either Ontario
         or San Berardino Airports...............................................................................37
4-1    Anaheim – Garden Grove Disney Resort Map...............................................39
4-2    Ground Transportation Mode by Zip Code....................................................41
4-3    John Wayne Airport/South Coast Metro Map...............................................42
4-4    Trip Purpose by Zip Code .................................................................................43
4-5    Hotel Route Near JWA.......................................................................................46
4-6    South Orange County Area Map......................................................................47
4-7    Resident/Visitor Split by Zip Code .................................................................48
4-8    Resident Airport Access Mode .........................................................................48
4-9    Business/Leisure Split by Zip Code ................................................................49
5-1    Map of Tustin I Shuttle Route ...........................................................................54

                       Ducey & Associates                                                                             TOC- iv
PAGE

6-1   Locally Preferred Strategy Alignment .............................................................60
6-2   Lower Cost Alternative 1 ...................................................................................62
6-3   Lower Cost Alternative 2 ...................................................................................63
6-4   LPS, LCA1, and LCA2 Alignments ..................................................................63
6-5   Chicago Airports Express Route.......................................................................69
6-6   Bypass Tracks on Midway Express ..................................................................71
6-7   Bypass Tracks on O’Hare Express ....................................................................71
6-8   Downtown Chicago Remote Airport Terminal..............................................72
7-1   BRT Bus Route Geographic Catchment Area .................................................75
7-2   Metrolink Rail Geographic Catchment Area ..................................................76
7-3   JWA Employees Catchment Zone ....................................................................78
7-4   Ridership Determination Process .....................................................................80

                     Ducey & Associates                                                                          TOC- v
INTRODUCTION

Phase I of the Go       A key initiative of the Orange County Transportation Authority
Local program           (OCTA) is to increase Metrolink commuter rail service between
sponsored this          north and south Orange County, providing fixed-route service
study, which            every 30 minutes between the Fullerton and Laguna Niguel
evaluates a             stations by 2010. To encourage new riders to use the expanded
potential transit       service, OCTA approved the Go Local program in 2006. This
link to connect John    program was developed to promote city-initiated transit
Wayne Airport to        extensions to Metrolink. The Go Local goal is to support local
the existing public     creativity and planning, and to develop transit-related projects
transportation          that make the Metrolink service more convenient and accessible.
infrastructure.         Toward this end, OCTA allocated $3.4 million in Measure M
                        monies for Go Local Phase I for initial feasibility planning. Each
                        city in Orange County was eligible for a $100,000 grant. In Go
                        Local Phase II, OCTA will provide funding of up to $30 million
                        for project design and implementation for the selected concepts.

                        This report is part of Go Local Phase I. The cities of Newport
                        Beach and Costa Mesa agreed to work together for Go Local
                        Phase I, and to evaluate transit services that have the potential
                        for relieving traffic congestion generated by John Wayne Airport
                        (JWA), which borders both cities.

                        On average, 27,000 air passengers enplane and deplane
                        scheduled commercial passenger flights each day at JWA. The
                        majority of passengers arrive and depart in low occupancy
                        ground transportation modes such as private cars, rental cars, or
                        taxis. Currently, less than one percent of JWA air passengers use
                        public transportation modes.

                        Another source of traffic congestion comes from the numerous
                        jobs provided by the airport, and by companies that provide for
                        ancillary services to passengers and the commercial and general
                        aviation communities. As a result, Newport Beach and Costa
                        Mesa are significantly impacted by vehicular traffic related to
                        aviation service at the airport. OCTA’s Go Local grant allows
                        the two cities to analyze potential rail or bus transit links into
                        JWA.

                       Ducey & Associates                                         PAGE - 1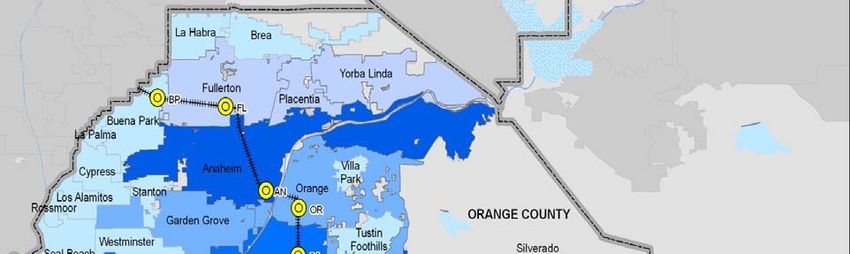
OCTA and the respective communities approved the Go Local
Agreement in late March 2008. Each city also approved a
Cooperative Agreement that outlines their respective
responsibilities throughout the Go Local process. Prior to
beginning the Go Local study, JWA agreed to actively participate
in the study, and cooperated fully throughout the process.
The purpose of the Go Local grant and the focus of this study are
The purpose of the to evaluate transit links into JWA, and to determine to what
study is to extent air passengers and employees might adopt mass transit
determine the over the use of private transportation modes. To accomplish this
potential adoption objective, it is crucial to understand how passengers move from
of mass transit by
one mode of transportation to another, and to know what
air passengers and
motivates their choice in intermodal connections and
airport employees.
transportation links.
It is essential to understand that in this case, air travel is the
primary transportation mode and influences all other ground
transportation decisions. Air passengers are motivated and
driven by very different factors than urban transit commuters.
Therefore, the success of an intermodal transit project at JWA
will largely depend on the ability to quantify and comprehend
the air passenger market in Orange County and the potential it
offers for developing airport ground transportation services.
This report evaluates the feasibility of a direct transit connection
between JWA and Metrolink or OCTA Bus Rapid Transit (BRT),
with the goal of providing a quick and convenient means to
move Orange County airport passengers and employees to JWA.
The consultant team has analyzed the performance of both rail
and bus service alternatives. At the request of the OCTA, two
specific bus transit services were evaluated: (1) the City of Irvine
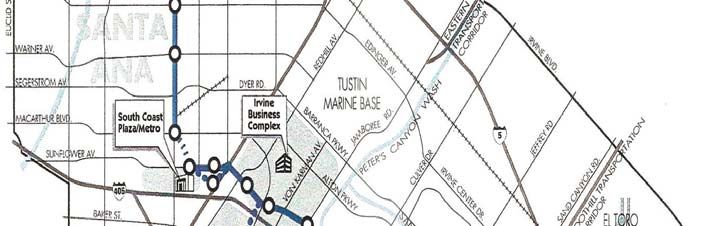
I Shuttle, which connects the Tustin Metrolink Station to JWA,
and (2) the OCTA Bristol/State College Boulevard Bravo! BRT, a
30-mile route that will begin in Brea and pass by JWA. The I
Shuttle is currently in operation. The Bravo! BRT is expected to
begin service in 2010. In addition, an express bus connection and
light rail were also considered.
Ducey & Associates PAGE - 2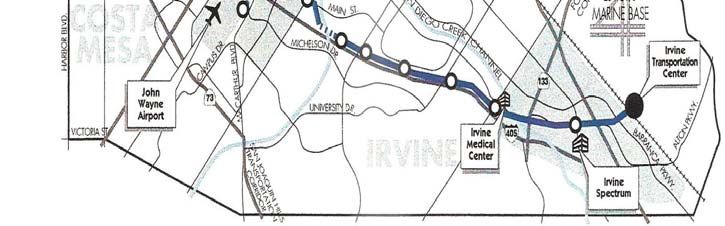
REPORT ORGANIZATION

 An analysis of various transit alternatives that could provide
 convenient and direct access to JWA from key Metrolink stations
 and activity centers is presented in this report. The analysis is
 based on the air passenger market profile generated from the
 most recent JWA air passenger survey.
 Chapter 1 establishes the existing context in which the study
 took place and focuses on current conditions at JWA. Chapter 1
 includes a discussion of current airport operations, the land uses
 surrounding the airport, and existing transit services into JWA.
 This chapter also describes future JWA growth, as permitted by
 the JWA Settlement Agreement.
 Chapter 2 provides an introduction to the integration of transit
 connections into airports. It also describes the analysis required
 to forecast ridership and evaluates the capital investment needed
 to support the construction and operation of new airport transit
 services. This chapter identifies the airport transit performance
 at many world airports and the key determinants that encourage
 air passengers to use specific airport transportation modes.
 Chapter 3 analyzes the Orange County air passenger market and
 JWA employee base, which is the market pool that would
 provide potential riders for an airport transit link. The market
 analysis includes demographics, trip purpose, point of origin,
 existing ground transportation choices, and airport choice
 factors; all of which influence the roadway traffic generated by
 JWA.
 Chapter 4 includes a more in-depth analysis of three densely
 concentrated air passenger geographic areas and presents
 opportunities for relieving ground traffic congestion.
 Chapter 5 analyzes three transit alternatives- the I Shuttle,
 express bus service, and the Bravo! BRT.
 Chapter 6 provides an overview of previous rail studies and
 project alignments.
 Chapter 7 assesses the final ridership findings and the resulting
 recommendations.
 Chapter 8 concludes the recommendations from the study.

Ducey & Associates                                         PAGE - 3
Chapter 1 - John Wayne Airport (JWA)
                        Background and Existing Conditions

                        JWA is owned and operated by Orange County and is the
                        County’s only commercial service airport. It is centrally located
                        within the County and is situated between the cities of Costa
                        Mesa, Irvine, and Newport Beach. JWA is located 40 miles
                        southeast of Los Angeles International Airport, 22 miles
                        southeast of Long Beach Airport, 45 miles southwest of Ontario
                        International Airport, and almost 90 miles north of San Diego
                        International Airport.

The John Wayne          JWA is restricted by a passenger cap that currently limits traffic
Airport has a           volumes to 10.3 million annual passengers (MAP). It served
passenger cap           almost 10 million passengers in 2007.1 Occupying 500 acres,
which limits traffic    JWA currently has one main terminal and 14 aircraft gates. JWA
to 10.3 MAP             has five public parking lots with 7,783 parking spaces, and
through January 1,      610 curbside valet parking spaces. Its main runway, at 5,701 feet,
2011 and then 10.8      is one of the shortest of any commercial airport in the United
MAP thereafter.         States, effectively restricting its commercial use to aircraft no
                        larger than a Boeing 757. Its second runway, at 2,887 feet, is for
                        general aviation traffic only.

                        1.1      History of the JWA Settlement Agreement

                        JWA is one of the few airports in the nation that has both noise
                        and operational restrictions. Grandfathered under the federal
                        Airport Noise and Capacity Act (ANCA), JWA currently
                        operates under a court-ordered agreement that restricts
                        commercial air operations and facility expansion.

                        The 1985 Settlement Agreement established nighttime curfews,
                        special departure procedures, and other operational restrictions
                        that are now prohibited without federal approval. The City of
                        Newport Beach, the County of Orange, and two community
                        groups, Airport Working Group (AWG) and Stop Polluting Our
                        Newport (SPON), entered into the 1985 Settlement Agreement to
                        resolve Federal Court litigation seeking judicial approval of the

                        1   The 10 million passengers include both enplaned (outbound) and deplaned
                            (inbound) passengers.

                       Ducey & Associates                                                  PAGE - 4
JWA Master Plan. The execution of the 1985 Settlement
Agreement required the County to reduce the size of the
terminal and to limit the number of parking spaces.
The Agreement also established three classes of commercial
aircraft permitted to operate at JWA, restricted the average daily
departures, limited the number of passengers to 8.4 million
annual passengers (MAP), and maintained the current nighttime
curfew in effect at JWA. Execution of the Settlement Agreement
allowed JWA to construct the Thomas F. Riley Terminal, which
was designed to accommodate 8.4 million annual passengers.
In 2003, the Settlement Agreement was amended with a number
Passenger traffic at
of modifications, including an increase in the maximum number
JWA has averaged
growth of 4.7% per of average daily departures and an increase in the maximum
year between 1990 number of daily air cargo departures from two to four. The 2003
and 2007. modifications also included an increase in the passenger limit
from 8.4 to 10.3 MAP until January 1, 2011 and to 10.8 MAP on
Through September of and after January 1, 2011. Flight and service level restrictions
2008, passenger remain in effect until January 1, 2016, and provisions related to
traffic has declined the curfew remain in effect until at least January 1, 2021. For the
9% over 2007 levels. purpose of this study, it is assumed that the operational cap of
10.8 MAP will remain in effect after 2015.
Exhibit 1-1 illustrates historical passenger trends which are
directly influenced by the 1985 Settlement Agreement and the
subsequent 2003 amendments. Growth in passenger traffic has
averaged 4.7 percent annually since 1990 although traffic is
down nine percent through September 2008 over 2007 levels.
The 2003 amendments also eliminated the restrictions on the size
JWA is adding six of the terminal and the limit on public parking spaces. Once the
new gates and over Settlement Agreement was amended, JWA began its facility
2,000 additional improvement program, which calls for the construction of a new
parking spaces. multilevel terminal building with six new commercial passenger
gates, six new security checkpoints, greater baggage screening
capability, new commuter facilities at the north and south ends
of the terminal, and over 2,000 new parking spaces.
Ducey & Associates PAGE - 5EXHIBIT 1-1
JWA HISTORICAL PASSENGER TRENDS
12
Millions
11
10
9
8
7
Passengers
6
5
4
3 AAG(1990-2007) = 4.7%
2
1
0
1990 1995 2000 2005
Actual Pasengers 2011 Passenger Cap Existing Passenger Cap
Sources: FAA, Terminal Area Forecast & Landrum & Brown analysis
1.2 Surrounding Land Use and Environmental
Setting
The area surrounding JWA is mostly urban in character.
Extensively developed industrial and commercial land borders
the airport to the north, east and west, while lower density
residential development and open space is located to the south
and southwest. The Upper Newport Bay is located
approximately 3,600 feet south of the airport and is an important
natural area, providing habitat to many wildlife species. An
extensive arterial highway and freeway system surrounds the
airport providing access from several locations to the airport.
1.3 JWA Ground Transportation Services
Airport passengers use a variety of transit modes to access JWA.
In a 2007 survey, 75% The ground transportation options include rental cars,
of passengers reported commercial and courtesy shuttles, taxis, the Disneyland® Resort
traveling to the airport Express, OCTA buses, and the Irvine I shuttle. Most ground
by car (including rental transportation services pick up passengers at the JWA Ground
cars). Transportation Center (GTC), located on the lower arrival level
in the center of the East parking structure. The 2007 JWA
Passenger Survey reported that a friend or family member in a
Ducey & Associates PAGE - 6private automobile dropped off 42 percent of the passengers. Eighteen percent drove/parked their cars, 15 percent used rental cars, and nine percent used taxi service. 1.3.1 Rail Transit In Orange County, commuter and inter-city rail services are provided by the Southern California Regional Rail Authority (Metrolink). Metrolink provides fixed-route rail service operating between established stops and terminals on a scheduled basis. The nearest train stations to JWA are located in Irvine, Santa Ana and Tustin. In June 2008, the City of Irvine began its I Shuttle service from the Tustin Metrolink Station to JWA. The I Shuttle-Route A connects the Tustin Metrolink Station to JWA via Von Karman Avenue. 1.3.2 Bus Transit OCTA provides the bus transit service throughout Orange County with two of its routes serving JWA. Bus Route 76 serves north Orange County, begins in Huntington Beach, and follows MacArthur Boulevard into JWA. Actual travel time from Huntington Beach to JWA is 55 minutes. The service runs every half hour, seven days a week. Bus Route 212 serves south Orange County, and begins in San Juan Capistrano, following I- 405 into Irvine, and arriving at JWA in 65 minutes. However, this service has only two northbound and two southbound operations per day, and there is no weekend service. OCTA buses stop on the arrival level outside of Terminal B. 1.3.3 Express Bus The Disney® Express Bus provides non-stop transportation service between the local Anaheim hotels/Disney areas and JWA. The service is provided on a fixed schedule in half hour intervals. 1.3.4 Private Airport Shuttles Private airport shuttles are shared-ride, door-to-door transportation services which charge a predetermined flat fare per passenger or zone. Typically, transportation from the airport Ducey & Associates PAGE - 7
is on-demand, but transportation to the airport requires prior
 reservations. More than 20 private shuttle companies serve JWA
 passengers.

 1.3.5 Courtesy Shuttles
 Door-to-door, shared-ride transportation is provided for
 customers of hotels and motels. Typically, no fare is charged to
 the passenger because this transportation service is considered
 part of the hotel service being provided. Service is provided
 using minibuses, vans, and station wagons. JWA has over
 40 hotel courtesy shuttles servicing air passengers.

 1.3.6 Taxis and Limousines
 JWA taxi and limousine services provide exclusive and privately
 operated door-to-door transportation service. Cabs can seat up
 to five people and vans up to seven. Taxis are on-demand
 vehicles that are located at the GTC. Fares are metered ($2.95
 first 1/4 mile plus $0.65 per additional 1/4 mile, with a $30 wait
 fee per ½ hour) and calculated according to trip length and
 travel time. Taxis cabs and vans are always available in the GTC.

 Airport limousine services are pre-arranged by reservation, and
 offer exclusive door-to-door service using luxury vehicles. Over
 100 limousine companies provide this service at JWA.

 1.3.7 On-Site and Off-Site Parking
 Air passengers using their private vehicles to access the airport
 can park either on-site in the airport's parking structures or off-
 site at the Main Street Parking facility. The Main Street lot offers
 the lowest daily parking rate with complimentary shuttle service
 to and from the terminal every 15 minutes.

 1.3.8 On-Site and Off-Site Rental Car Agencies
 Rental cars are private automobiles leased by visitors at or near
 the airport. At JWA, a number of on-site rental car companies
 are located on the lower arrival level. Car rental pick-up and
 return is located on the ground level of the GTC. The off-site
 rental car companies are licensed to pick up passengers from the
 terminal and shuttle them to their off-site locations.

Ducey & Associates                                           PAGE - 8
Chapter 2 – Airport Transit Integration
Ridership estimates    While the costs for intermodal airport-transit projects vary
are difficult to       widely, planning and construction costs are substantial. A key
determine and are      challenge lies in securing the necessary funding to build the
normally over          project, and a critical component of any funding plan is the
estimated.             ridership estimate. While there are many non-financial reasons
                       to expand transit options (e.g. reduce congestion, environmental
                       factors) projected ridership and the subsequent derived revenues
                       are an important component in the justification of the capital
                       investment. Unfortunately, many airport-transit connections in
                       the United States have not lived up to expected ridership
                       projections, especially when compared to the performance of
                       similar projects around the world. Table 2-1 presents rail
                       ridership for major airports around the world.

                                                TABLE 2-1
                         RAIL TRANSPORTATION SHARES AT WORLD AIRPORT LOCATIONS
                       Airport                                 Share                Type of Rail
                       Oslo                                     39%                  High-Speed
                       Hong Kong                                28%                  Heavy Rail
                       Frankfurt                                27%            High-Speed/Commuter
                       Reagan National (Wash. D.C.)             13%                     Metro
                       Atlanta-Hartsfield                       10%                     Metro
                       New York JFK                              8%          APM to Metro/Commuter Rail
                       Chicago-Midway                            6%                     Metro
                       Boston Logan                              6%                    Subway
                       Newark                                    5%            APM to Commuter Rail
                       Chicago-O’Hare                            5%             Metro/Commuter Rail
                       St. Louis-Lambert                         3%                     Metro
                       Philadelphia                              3%                Commuter Rail
                       Baltimore Washington                      3%                    Amtrak
                       Cleveland-Hopkins                        2%                      Metro
                       Los Angeles
Consequently, making assumptions about all air passengers and
creating a “one size fits all” ridership model has its
shortcomings. Instead, airport and transportation planners must
first understand their aviation market—who they are, where
passengers come from prior to arriving the airport, how they get
to the airport, why they are traveling, who is paying for the trip--
and then evaluate specific airport transit project criteria based on
that thorough market analysis.
2.1 Airport Access Travel Time
Compared to typical transit commuters, air passengers are more
Air passengers put a time sensitive and less cost sensitive. Orange County air
greater emphasis on
passengers travel on average five-six times per year, and with
time and convenience
such infrequent travel, on-time arrival at the airport is more
than money. Air
important to flyers than cost.
passengers also have
above average
Further, the terrorist attacks of September 11, 2001 have led to
incomes which place
dramatic changes in the airline/airport industry; in particular
them outside of the
typical transit rider the processing through airport security. Over 40 percent of air
profile. passengers report they allow more time for air travel now than
before 9-11.2 The net impact is an increased “hassle” factor
related to air travel today. Additional airport time provides
something of a buffer against unexpected delays and in clearing
security. Nonetheless, if passengers are concerned about
security delays at the airport, they will be less tolerant of delays
due to ground congestion while traveling to the airport.
From the air passenger’s perspective, the critical performance
parameter for any airport transit system is total travel time; that
is, the door-to-door travel time from point of local trip origin
(home, business, hotel, etc.) to arrival at the airport ticketing
counter or security check-point. The more seamless the process--
the fewer mode changes, the more direct the route, the easier the
terminal access is from the transit drop-off location-- the more
likely air passengers are to forego their private vehicles for
public transit. If the process is not seamless, passengers will seek
more convenient, reliable ways to get to their flights on-time.
2 According to ACRP Report 4 “Ground Access to Major Airports by Public
Transportation” pg. 39
Ducey & Associates PAGE - 102.2 Market Segmentation
The air passenger market is not homogeneous, and different
market segments have different airport access needs and
available options. The most obvious distinction is between
visitors to and residents of the local area. The modes available
for resident and non-resident trips will generally be different.
Residents typically have access to private vehicles and someone
who can take them to or pick them up at the airport. Visitors on
the other hand may need to rent a car while in the area or may
stay at a hotel that provides shuttle service to the airport.
Within the visitor and resident air passenger market there are
The air passenger also distinct sub-segments, driven by different cost, time, and
market is divided convenience criteria. Most airport surveys divide passengers
into five or more into business or leisure travelers, but within these two broad
smaller markets that categories there are sub-segments. To be able to evaluate how
have distinct profiles. and why certain air passengers are choosing specific ground
transportation modes, this report divides air passengers into five
specific trip purpose segments:
Business (On-Site Meetings)
Business (Conference/Convention)
Leisure (Vacation/Pleasure Trip)
Leisure (Visiting Friends and Relatives)
Other (School, Personal)
The factors that influence the choice of where to stay (a hotel
versus a local residence) as well as the airport egress and access
travel options are quite different for visitors in the
five categories. Leisure passengers visiting friends and relatives
will normally be met and dropped off at the airport. If a relative
is visiting, it is unlikely that the host will want them to take a rail
or bus service to and from the host residence. This is different
for business travelers who have travel costs reimbursed by their
employer or client.
Therefore, while all air passengers share travel by airplane in
common, their choice of ground transportation to/from the
airport can be very different depending on their particular
market sub-segment. Resident and visiting travelers have very
different mode choices available. The business traveler makes a
Ducey & Associates PAGE - 11choice based on reimbursement of the travel, leisure travelers
choose on the basis of what they can afford, and leisure travelers
Ridership estimates visiting friends and family have an entirely different set of
require an in-depth options open to them.
understanding of
the current air This report is based on the premise that the most successful air-
passenger market transit projects are built on an in-depth needs analysis of the
segments and specific airport passenger market the project is meant to serve,
available public then evaluating the best airport access mode that meets the
transit network. specific passenger needs, rather than choosing a particular
transit mode based on some other criteria.
As shown in Table 2-2, both Tokyo Narita Airport and London
Heathrow Airport are good examples of how a specific air
passenger market can segment between different ground access
modes.
Table 2-2
TRAVELERS CHOICE OF GROUND ACCESS MODES
High Moderate- Total Rail Total Bus Total Public
Airport Speed Low Speed Market Market Transit
Rail Rail Share Share Share
Tokyo Narita
14% 22% 36% 23% 59%
31 MAP
London Heathrow 9% 14% 24% 12% 36%
67 MAP
Sources: TCRP Report 62 (16), CAA Passenger Survey Report 2004 (30)
These airports have created service targeted to specific air
passenger market segments. For example, high speed train
service is the fastest and most costly way to arrive at the airport.
Moderate or low speed rail is slower and will cost less, but won’t
be impacted by street or freeway traffic congestion. Bus transit is
the least expensive, but also the slowest. However, each transit
mode meets the needs of a different air passenger market sub-
segment.
Since different transit modes speak to different air passenger
market sub-sets, the first step is to define the air passenger
market for the target airport before evaluating a particular
intermodal project. This report is based on the principle that an
Ducey & Associates PAGE - 12accurate, justifiable airport transit ridership estimate cannot be
done without first obtaining a detailed, in-depth analysis of the
air passenger market that the project is meant to serve.
The resources needed to develop an airport access ridership
model depend, in part, on the availability of accurate, detailed
air passenger data. Without reliable, current air passenger data,
model assumptions about the success or viability of an airport
transit system will be questionable.
For the purposes of this report, the project evaluation process is
as follows:
Gather Market Data for Target Airport through an Airport
Passenger Survey
In this case, the target is JWA
Design survey questions to reveal key market
characteristics.
Emphasize accurate origin/destination information to
permit geo-coding.
Analyze and Understand Market Data
Understand the composition of the overall airport
market as well as its sub-segments.
Create a detailed profile of key passenger segments
and define the specific needs of each segment.
Establish target geographic markets based on air
passenger density concentrations.
Understand the drivers of market support of various
modes and services.
Evaluate Airport Transit Services
Understand the quality attributes of successful transit
project services.
Determine the best transit mode based on the specific
needs of the target passenger segment.
Match modes with markets.
Where practical, develop strategies to encourage
higher occupancy mode use.
By following this process, the passenger market served by the
project will drive the planning process, rather than the process
being driven by the choice of specific transit modes of service.
Ducey & Associates PAGE - 13Chapter 3 - JWA Air Passenger Market
To better understand the JWA passenger market, the consultant
A supplemental
passenger survey was team initially evaluated existing data from the JWA Passenger
performed in the Survey conducted in July 2007 by the Redhill Group. JWA
summer of 2008 to sponsors a biannual passenger survey to measure traveler
gather specific data preferences and customer satisfaction. The 2007 survey included
focusing on local two separate components: an intercept survey conducted at JWA
passenger trip origin with 570 visitor and resident passengers, and a telephone survey
and current modes of conducted with 1,500 Orange County residents. Of the airport
ground transportation. intercept responses, only 206 were residents of Orange County.
The 2007 passenger survey data initially provided the best data
for the preliminary analysis of the JWA passenger market.
However, one of the limitations of the 2007 survey was that zip
code data was provided only for residents of Orange County and
was based on their home address. As a result, it was not possible
to determine what level of visitor traffic came to JWA from key
local activity centers such as the Anaheim/Disneyland resort
area, nor could it be determined if residents were traveling from
home or a place of work.3
In order to collect data targeted to the specific objectives of this
study, the cities of Newport Beach and Costa Mesa agreed to
sponsor a new airport passenger intercept survey designed to
provide a detailed, accurate picture of the JWA passenger
market, and to specifically elicit the information necessary to
evaluate the viability of JWA transit services.
The following objectives guided the development of the specific
survey questions:
Develop a detailed profile of JWA passengers as a key
input to evaluate the potential of mass transit ground
access to JWA
Quantify key passenger segments: Visitor, Resident,
Business, Leisure, Visiting Friends and Family
3 It is important to note that these statements do not infer a deficiency in the
2007 passenger survey but simply that this study had a very different
purpose. In fact, in the instances where questions overlapped between
surveys a high level of correlation was found.
Ducey & Associates PAGE - 14 Identify key geographic clusters within Orange County
through geo-coded passenger trip origins
Identify which ground transportation mode passengers
currently use to travel to JWA (e.g. private car, rental car,
taxi, shuttle)
Understand passengers’ airport preferences, choice
factors, and propensity to travel from JWA
Determine general passenger perception and use of mass
transit, with an emphasis on rail transit
Evaluate inter-relational variables of trip time and price as
they pertain to potential mode substitution
With the full cooperation of JWA staff, the consultant team
Published flight conducted the survey at the JWA terminal from June 25 - July 13,
schedules were used 2008. A stratified random sample was used to select respondents
to yield balanced for this survey. A stratified sample ensured that the complete
overall results and mix of air carriers, markets, times of day, and days of week were
minimize any bias. represented in the survey. Airline schedules published in the
Official Airline Guide (OAG) were used to guide the survey
planning process. Table 3-1 provides a summary of the
distribution of activity for the survey period by airline, day of
week, and time of day.
Interview staff intercepted and surveyed 2,500 passengers
waiting at the airport departure gates. Passengers were
randomly selected by the interviewer to participate in the
survey, and only one person per traveling party was asked to
complete the survey. The surveys were self-administered by the
air passenger, and then checked for completeness by survey
staff.
Survey questions focused on the “door-to-airport” trip rather
than “in-airport” customer satisfaction, and were designed to
draw out detailed data for both Orange County visitors and
residents. Critical to the results were questions detailing the
exact location of travelers prior to leaving for the airport. This
permitted passenger origins to be geo-coded by zip code. The
survey questions were also designed to elicit information
regarding reasons for airport choice, airport preference, travel
behavior, destination, demographic characteristics, perceptions,
and use of mass transit. Of the 2,500 completed air passenger
Ducey & Associates PAGE - 15surveys, 2,317 were accurately completed and useable for the
study’s purpose. The stratified sampling plan was then used to
weight the results, to correct for any over sampling within each
departure flight strata.
TABLE 3-1
DISTRIBUTION OF WEEKLY SCHEDULED SEATS
Weekdays
Airlines 6am-10am 10am-2pm 2pm-6pm 6pm-10pm
Alaska 1.8% 1.7% 2.2% 1.8%
American 4.5% 4.3% 3.5% 1.2%
Continental 2.0% 1.0% 1.0% 0.5%
Delta 2.7% 2.4% 2.0% 0.6%
Frontier 0.6% 0.6% 0.6% 0.6%
Northwest 0.5% 0.5% 0.5% 0.0%
Southwest 5.1% 5.6% 5.6% 5.1%
United 3.8% 2.8% 1.3% 1.2%
US Airways 2.6% 2.1% 1.0% 1.8%
Total 23.6% 21.0% 17.7% 12.8%
Weekend
Airlines 6am-10am 10am-2pm 2pm-6pm 6pm-10pm Total
Alaska 0.5% 0.7% 0.9% 0.5% 9.9%
American 1.3% 1.6% 1.3% 0.3% 17.9%
Continental 0.7% 0.2% 0.3% 0.1% 5.9%
Delta 0.9% 1.0% 0.6% 0.2% 10.3%
Frontier 0.2% 0.2% 0.2% 0.2% 3.1%
Northwest 0.2% 0.2% 0.2% 0.0% 2.1%
Southwest 1.5% 2.1% 2.0% 1.7% 28.7%
United 1.2% 0.7% 0.4% 0.3% 11.7%
US Airways 0.9% 0.8% 0.3% 0.6% 10.2%
Total 7.4% 7.5% 6.2% 3.8% 100.0%
Sources: Official Airline Guide; Landrum & Brown analysis
Survey Weighting
A weighting and expansion process was used to adjust the
sample to be population-proportional and to expand it to be
reflective of the total number of passenger trips made. Survey
data was weighted to reflect the known proportions of
scheduled departing seats, and actual counts of departing
passenger surveys obtained from JWA for the survey period.
Geo-coding
A key objective was to determine the start location of air
passengers before they began their trip to the airport. This
facilitated visual mapping of travel patterns and concentrations
of air passengers within the Orange County area. Survey
respondents provided their origin zip code if known. To the
Ducey & Associates PAGE - 16extent that passengers were not familiar with their location of
origin, data was derived from city, hotel, street address, and
cross streets, which permitted staff to identify the specific zip
code.
3.1 Passenger Demographics and Residency
Demographic characteristics collected for JWA passengers
The JWA passenger include gender, age, income and residency. As shown in
base is relatively
Exhibit 3-1, passengers are almost evenly divided between men
high income with
and women, 51 percent to 49 percent respectively.
over half of
passengers
EXHIBIT 3-1
reporting household DEMOGRAPHIC CHARACTERISTICS
income of more
than $100,000.
Male Female
51% 49%
Sources: 2008 Air Passenger Survey, Landrum & Brown analysis
Almost half of JWA passengers (48 percent) are between the ages
of 35 and 54. The median age range is 45-54 years. When asked
to report their income, JWA passengers most frequently cited an
annual household income of $100,000-$125,000, with at least
15 percent of all passengers reporting earnings within that range
(see Table 3-2). Household income for the JWA passenger
market is well above the State median of $57,000 and the U.S.
national median of nearly $50,000.4 Over 51 percent of the total
surveyed reported earnings of more than $100,000 per year. The
fact that the JWA passenger market is wealthier than the broader
population is an important finding as there is typically an
inverse relationship between income levels and the desire to use
public transit.
4 State and U.S. medians based on data published in the U.S. Census, 2006
American Community Survey.
Ducey & Associates PAGE - 17TABLE 3-2
DISTRIBUTION OF AIR PASSENGER HOUSEHOLD INCOME
Business Leisure Total
Under $50,000 5% 14% 10%
$50,000 - 74,999 10% 17% 14%
$75,000 - 99,999 12% 14% 13%
$100,000 - 124,999 17% 14% 15%
$125,000 - 149,999 12% 7% 9%
$150,000 - 174,999 10% 6% 8%
$175,000 - 199,999 6% 3% 4%
$200,000 and over 18% 13% 15%
Refused 10% 13% 12%
Sources: 2008 Air Passenger Survey, Landrum & Brown analysis.
The business base at JWA has particularly high household
income levels (see Exhibit 3-2). Approximately 63 percent of
business travelers reported earning over $100,000 annually and
18 percent reported earning over $200,000 annually.
EXHIBIT 3-2
HOUSEHOLD INCOME - BUSINESS TRAVELERS
Refused
less than $100,000
$100,000 or more
10%
27%
63%
Sources: 2008 Air Passenger Survey, Landrum & Brown analysis.
By comparison, the reported passenger income results during
the 2006 Passenger Survey at Los Angeles International Airport
(LAX) showed only 29 percent of the total passenger market
earning more than $100,000 annually. The higher income level at
JWA may indicate an opportunity for premium-level airport
transit service, and also warrants a more in-depth analysis of the
potential to attract a public-private partnership to develop an
airport express transit model.
Ducey & Associates PAGE - 18Passengers were found to arrive 1 hour and 45 minutes prior to
departure, with visitors typically arriving 20 minutes earlier than
residents. The average party size is two passengers, but nearly
two-thirds of business passengers travel alone. Business
travelers generally make shorter trips than leisure travelers,
averaging four days versus 7-8 days for leisure travelers.
A quarter of the passengers do not check bags. Data on baggage
is important to an airport transit model. In order to maximize
ridership, the service design typically includes a number of air
passenger amenities. Very often, a remote satellite terminal is
offered in locations that have a high concentration of air
passengers, such as a central downtown area. Amenities such as
remote ticketing and baggage check-in are often offered, so
obtaining data on the number of checked bags is important.
3.2 Residents and Visitors
Departing passengers were asked to indicate their home city and
Over 46% of JWA zip code (see Exhibit 3-3). Those living in the Southern
passengers are California counties of Orange, Los Angeles, San Bernardino,
residents. Riverside, and San Diego were considered residents. All others
were classified as visitors. Of the total surveyed, 46.5 percent of
JWA passengers were residents. Over 40 percent were residents
of Orange County while the additional 6 percent of residents
lived in neighboring counties. A little over half (almost 54
percent) of JWA passengers were visitors to the area. Since the
survey was done during peak summer travel months, the larger
visitor market is not surprising. An air passenger survey
conducted during winter months would produce a slightly
different mix of visitor and resident passengers. Of the visitors,
11.5 percent were from central or northern California, illustrating
the demand for short-haul flights within California.
Ducey & Associates PAGE - 19EXHIBIT 3-3
PASSENGERS’ PRIMARY RESIDENCE
The survey showed Out-of-State
that 40% of air Orange County
passengers were from Other So Cal
Orange County Rest of California
alone, with another
6% from bordering
40.3%
counties.
6.2%
11.5%
41.9%
Sources: 2008 Air Passenger Survey, Landrum & Brown analysis
JWA draws a three percent of its passengers from Los Angeles
County residents, and one-third of these were from the City of
Long Beach (see Table 3-3). Residents of Riverside and San
Bernardino Counties made up 2.5 percent of the total. Many of
these passengers reported they used JWA because Ontario
International Airport did not serve their particular destination.
Less than one percent originated from San Diego County.
Los Angeles County TABLE 3-3
RESIDENT NON ORANGE COUNTY AIR PASSENGERS
accounts for the
highest percentage County City % Share
LOS ANGELES 3.0%
of local resident air
Long Beach 1.0%
passengers outside Los Angeles 0.3%
Orange County. Lakewood 0.2%
RIVERSIDE 1.8%
Corona 0.5%
Murrieta 0.3%
Riverside 0.3%
SAN BERNARDINO 0.7%
SAN DIEGO 0.7%
VENTURA 0.0%
TOTAL 6.2%
Sources: 2008 Air Passenger Survey, Landrum & Brown analysis.
Ducey & Associates PAGE - 203.3 Trip Purpose
To permit a more detailed analysis, trip purpose was divided
into five categories:
Business: Includes trips for business only
Conference/Convention: Includes attendance specifically
for professional/business conferences and conventions
Vacation/Pleasure trip: Includes only those passengers
who state they were traveling on vacation
Visiting Friends/Relatives: Includes leisure travelers that
were specifically meeting family and/or friends
Other: Includes travel for school, military, health, or other
personal business
These categories help to better gauge and predict air passenger
decision-making and choices for airport ground access modes.
In general, the purpose of a trip will affect how sensitive a
traveler is to costs, time constraints, and convenience. A
business traveler will typically be less cost-sensitive since the
Business travelers
passenger’s employer or client is paying the trip expense, and
put a premium on
will be more willing to pay a premium price for convenience and
time and
reliability.
convenience while
leisure travelers are
typically more Business travelers often have less flexibility in flight plans as
price sensitive. most of their out-of-town meetings are already scheduled, so
missing a flight because of traffic congestion is for them a more
serious concern. Leisure travelers will be more motivated by
cost-savings and economy service, with speed and convenience
being lesser concerns. Leisure travelers normally take longer
trips and travel in bigger parties, and since the individual
traveler personally pays for leisure travel, they are more likely to
be price sensitive.
Leisure travelers were also segregated into a sub-group known
as passengers visiting family or friends. This group is driven by
different motivations that significantly affect the airport access
mode these travelers use. Whether grandparents are visiting
grandchildren or college roommates are reconnecting, there is a
personal and emotional component when these air passengers
travel to visit friends or relatives. In general, these passengers
Ducey & Associates PAGE - 21are picked up and dropped off at the airport by their hosts and
are less likely to consider public transportation as a real
alternative.
During the peak summer travel months, leisure passengers made
up 55 percent of the total market (see Exhibit 3-4). Over half of
leisure travelers (27 percent) were visiting family and friends.
Approximately 45 percent of air passengers were traveling for
business, of which eight percent were attending professional
conferences or conventions.
EXHIBIT 3-4
PASSENGER TRIP PURPOSE
Business
Convention/Conference
Vacation/Pleasure Trip
Visiting Friends/Relatives
Other
8%
25%
37%
27%
3%
Sources: 2008 Air Passenger Survey, Landrum & Brown analysis
3.4 Origins of JWA Passengers
To better understand the county-wide geographic distribution
and concentration density of the JWA market, passengers were
asked a series of questions regarding their location prior to
coming to the airport.
To attract riders, a successful airport transit service must align
well with the travel patterns and preferred origin locations of
airport passengers. A dense passenger concentration may
provide the environment necessary for adequate ridership that is
essential for the financial success of a new transit service.
Ducey & Associates PAGE - 22Passenger origins were first mapped by City. There are
The cities of 34 incorporated cities in Orange County, as well as larger
Anaheim, Irvine, unincorporated areas such as Sunset Beach, Ladera Ranch,
Newport Beach, Midway City, and Rossmoor. When mapped by city, air
Costa Mesa, passengers were distributed over a fairly broad area.
Huntington Beach,
and Santa Ana are However, when passenger origins were mapped to zip code
key trip origin levels, passenger density became very localized and focused in
points for JWA select areas as illustrated in Exhibit 3-5. For example, the entire
passengers. City of Anaheim produces 15.5 percent of total JWA air
passengers, but the Anaheim zip code that hosts the Disneyland
Resort captures 75 percent of Anaheim air passengers.
EXHIBIT 3-5
AIR PASSENGER TRIP ORIGIN BY CITY
Ducey & Associates PAGE - 23Sources: 2008 Air Passenger Survey, Landrum & Brown analysis
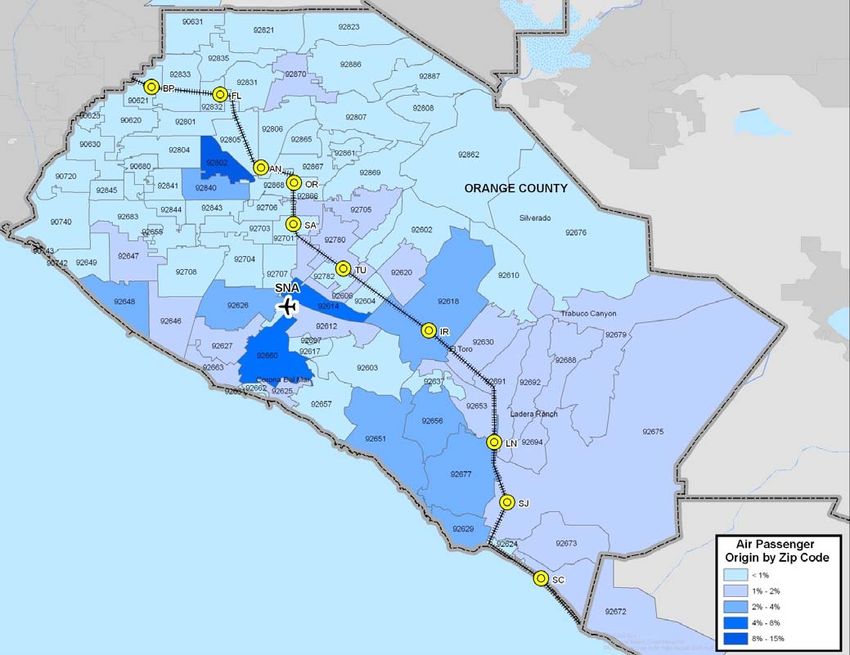
Zip codes with the heaviest concentration of air passengers fall
into three distinct geographic regions as illustrated on
Exhibit 3-6.
EXHIBIT 3-6
AIR PASSENGER TRIP ORIGIN BY ZIP CODE
Sources: 2008 Air Passenger Survey; Landrum & Brown analysis
Nearly 43% of air The Disney Resort area, the South Coast Metro area, and South
passengers live in Orange County capture almost 43 percent of air travelers, or over
or visit three key four million air passengers annually (see Table 3-4). The three
market clusters. areas are better detailed and defined in Chapter 4.
Ducey & Associates PAGE - 24TABLE 3-4
AIR PASSENGER CLUSTERS
% OF % OF TOTAL
CITY ZIP CODE PASSENGERS JWA
BY ZIP CODE PASSENGERS
Disney Resort Area 14%
Anaheim 92802 11.7%
Garden Grove 92840 2.2%
John Wayne Airport/
14%
South Coast Metro
Irvine 92614 4.1%
Newport Beach 92660 5.9%
Costa Mesa 92626 3.9%
South Orange County 14%
Dana Point 92629 2.8%
San Juan Capistrano 92675 2.0%
Laguna Niguel 92677 2.4%
Aliso Viejo 92656 2.2%
Irvine 92618 2.4%
Laguna Beach 92651 2.3%
Sources: 2008 Air Passenger Survey, Landrum & Brown analysis
3.5 Airport Access and Traffic Congestion
Ground traffic generated by air travel can have a significant
impact on both traffic congestion and air quality. Airport host
communities with good ground access will have fewer quality of
life impacts. For example, when Frankfurt International Airport
connected metro and high speed rail to the airport, passengers
accessing the airport by private vehicle dropped by eight percent
with a corresponding increase in the rail mode share into the
airport. Modal decisions for airport ground access are
influenced by the location the air passenger begins their trip to
the airport, the actual travel time to the airport, and the variety
of modal choices available to the traveler.
More than half of all JWA passengers (56.4 percent) came either
More than 85% of
from home or another residence (see Exhibit 3-7). Furthermore,
residents begin
over 85 percent of residents, both business and leisure travel,
their trip to JWA
from home. began their trip to JWA from home. This may be due to
California’s west coast location, since traveling eastward means
arriving in later time zones, which causes residents to depart
earlier in the day when they are more likely to be at home.
Ducey & Associates PAGE - 25You can also read